https://doi.org/10.1051/0004-6361/201834079 c
ESO 2018
Astronomy
&
Astrophysics
The s process in AGB stars as constrained by a large sample of barium stars
B. Cseh1, M. Lugaro1,2, V. D’Orazi3, D. B. de Castro4, C. B. Pereira5, A. I. Karakas2, L. Molnár1,6, E. Plachy1,6, R. Szabó1,6, M. Pignatari7,1,8?, and S. Cristallo9,10
1 Konkoly Observatory, Research Centre for Astronomy and Earth Sciences, Hungarian Academy of Sciences, Konkoly Thege M. út 15-17, 1121 Budapest, Hungary
e-mail:cseh.borbala@csfk.mta.hu
2 Monash Centre for Astrophysics, School of Physics and Astronomy, Monash University, VIC 3800, Australia
3 INAF Osservatorio Astronomico di Padova, Vicolo dell’Osservatorio 5, 35122 Padova, Italy
4 Department for Astrophysics, Nicolaus Copernicus Astronomical Centre of the Polish Academy of Sciences, 00-716 Warsaw, Poland
5 Observatorio Nacional, Rua General José Cristino, 77 Sao Cristovao, Rio de Janeiro, Brazil
6 MTA CSFK Lendület Near-Field Cosmology Research Group, Hungary
7 E. A. Milne Centre for Astrophysics, Department of Physics & Mathematics, University of Hull, HU6 7RX, UK
8 Joint Institute for Nuclear Astrophysics – Center for the Evolution of the Elements, USA
9 INAF, Osservatorio Astronomico d’Abruzzo, 64100 Teramo, Italy
10 INFN-Sezione di Perugia, 06123 Perugia, Italy Received 13 August 2018/Accepted 3 October 2018
ABSTRACT
Context.Barium (Ba) stars are dwarf and giant stars enriched in elements heavier than iron produced by the slow neutron-capture process (sprocess). These stars belong to binary systems in which the primary star evolved through the asymptotic giant branch (AGB) phase. During this phase the primary star produceds-process elements and transferred them onto the secondary, which is now observed as a Ba star.
Aims.We compare the largest homogeneous set of Ba giant star observations of thes-process elements Y, Zr, La, Ce, and Nd with AGB nucleosynthesis models to reach a better understanding of thesprocess in AGB stars.
Methods.By considering the light-s(ls: Y and Zr) heavy-s(hs: La, Ce, and Nd) and elements individually, we computed for the first time quantitative error bars for the different hs-element to ls-element abundance ratios, and for each of the sample stars. We compared these ratios to low-mass AGB nucleosynthesis models. We excluded La from our analysis because the strong La lines in some of the sample stars cause an overestimation and unreliable abundance determination, as compared to the other observed hs-type elements.
Results.All the computed hs-type to ls-type element ratios show a clear trend of increasing with decreasing metallicity with a small spread (less than a factor of 3). This trend is predicted by low-mass AGB models in which13C is the main neutron source. The comparison with rotating AGB models indicates the need for the presence of an angular momentum transport mechanism that should not transport chemical species, but significantly reduces the rotational speed of the core in the advanced stellar evolutionary stages.
This is an independent confirmation of asteroseismology observations of the slow down of core rotation in giant stars, and of rotational velocities of white dwarfs lower than predicted by models without an extra angular momentum transport mechanism.
Key words. stars: abundances – nuclear reactions, nucleosynthesis, abundances – stars: AGB and post-AGB
1. Introduction
Barium (Ba) stars are a type of chemically peculiar star (G-K giants or dwarfs) belonging to a binary system in which the material formed in the interior of the more evolved primary star during the asymptotic giant branch (AGB) phase was transferred onto the companion star. Consequently the less evolved sec- ondary star is enriched in the elements heavier than Fe (including Ba) that were synthesised in the AGB star companion through the slow neutron capture (s) process (e.g. Busso et al. 1999).
As first recognised by Bidelman & Keenan (1951), Ba stars also show strong CH, C2 molecular bands, indicating enrich- ment in C. This is in agreement with the idea of mass trans- fer from an AGB star, since these stars also produce carbon.
Further evidence for the AGB origin of the abundances of
? The NuGrid Collaboration,http://www.nugridstars.org
Ba stars was provided by the discovery of a low-metallicity Ba star rich in F, another AGB product (Alves-Brito et al.
2011). Radial velocity observations have confirmed this sce- nario: the large majority of Ba stars show radial velocity variations originating from orbital motion, meaning that a com- panion star is present in the system (see e.g. Griffin & Griffin 1980;Griffin & Herbig 1981;McClure 1983;Jorissen & Mayor 1988;McClure & Woodsworth 1990;Jorissen et al. 1998). The primary star in these systems is now considered to be a white dwarf (WD), as confirmed in some cases by UV obser- vations (see e.g. Boehm-Vitense 1980; Schindler et al. 1982;
Dominy & Lambert 1983; Böhm-Vitense et al. 1984, 2000;
Jorissen et al. 1996;Frankowski & Jorissen 2006). The features of the mass transfer mechanism that produced these systems, most likely wind accretion, however, are still under debate. A main problem is that wind accretion predicts much larger final orbits for the binary systems than those observed in the Ba star
population. Solutions include a WD kick (Izzard et al. 2010), although this possibility has been disputed by Milliman et al.
(2015), and an eccentricity-enhancing mechanism due to tidally enhanced mass loss (Bonaˇci´c Marinovi´c et al. 2008). Hydrody- namical simulations of wind mass transfer have been performed byLiu et al.(2017), who found that along with increase of the mass ratio of the system, the mass-accretion efficiency and the accreted specific angular momentum also increase. A poten- tial problem is that accretion increases the angular momentum such that the star quickly reaches critical rotational velocity (Matrozis et al. 2017).
In AGB stars, C and s-process elements are produced in the He-rich intershell located between the H-burning and He- burning shells. The two burning shells are activated alternately:
H burning is present most of the time and is recurrently inter- rupted by brief episodes of He burning known as thermal pulses (TPs). These produce enough energy at the bottom of the intershell to drive a convective zone within it. Once this convective region disappears, the extended H-rich convective envelope deepens into the He-rich intershell layers, carrying to the stellar surface the C resulting from partial He burn- ing. These recurrent mixing episodes are collectively known as the third dredge-up (TDU). The s-process elements are pro- duced via the capture of neutrons on Fe seeds; neutrons are released both during the H-burning phases, within a so-called
13C “pocket” by the13C(α,n)16O reaction at temperatures of the order of 100 MK, and during the TPs by the22Ne(α,n)25Mg reac- tion, if the temperature reaches above '300 MK (Gallino et al.
1998;Goriely & Mowlavi 2000;Busso et al. 2001;Lugaro et al.
2003b;Cristallo et al. 2009). The resulting abundances are car- ried to the stellar surface via the TDU. In AGB stars of relatively low mass (<4–5M) the temperature barely reaches 300 MK and the 13C nuclei are the predominant neutron source. For higher masses the22Ne neutron source becomes predominant. To gen- erate enough 13C nuclei in low-mass AGB stars it needs to be assumed that some partial mixing occurs between the base of the convective envelope and the radiative intershell at the deep- est extent of each TDU episode, leaving an abundance profile of protons in the radiative He-rich region. The protons react with the abundant 12C to produce the 13C pocket. Within this pocket the neutron exposureτ, i.e. the time-integrated neutron flux, is relatively large, of the order of 10−1 to 1 mbarn, result- ing in strong enhancements (up to 103−4 times the initial abun- dances) of nuclei heavier than Fe. These nuclei are mixed inside the TP convective region and then carried to the stellar sur- face by the following TDU. SeeHerwig(2005),Straniero et al.
(2006),Käppeler et al.(2011), andKarakas & Lattanzio(2014) for recent reviews on AGB stars and thesprocess.
Barium stars can provide us stringent constraints on the s process in AGB stars because we can perform a more straight- forward, accurate, and precise derivation of the abundances of different elements on their surfaces than on the AGB stars them- selves. The temperatures of Ba stars (from over 4000 K up to 6500 K) are higher than those of late AGB stars ('3000–
4000 K), consequently, the spectra of Ba stars are easier to model than those of AGB stars because there are fewer molecules.
Furthermore, the atmospheres of AGB stars are characterised by strong dynamical processes, such as pulsations and mass loss, as well as dust formation, which makes their modelling challenging (Abia et al. 2002;Pérez-Mesa et al. 2017). Ba stars cover a range of metallicity roughly from solar to 1/10 of solar, which makes them the higher metallicity equivalent ofs-process enriched CH and carbon-enhanced metal-poor stars (CEMP- s) in the halo (e.g.Lucatello et al. 2005;Masseron et al. 2010;
Bonifacio et al. 2015;Cristallo et al. 2016;Yoon et al. 2018and references therein).
Up to a couple of years ago, observations of Ba stars were limited both in number and in terms of the self-consistency of the spectral analysis.Allen & Barbuy(2006a;2006b) presented a self-consistent sample of 26 Ba dwarfs and giants observed with the FEROS spectrograph (R = 48 000Kaufer et al. 1999).
Smiljanic et al.(2007) compared normal giants and roughly 10 Ba stars with different s-process enhancements. The spectra were also taken with the FEROS spectrograph with high signal-to-noise ratio (≈500–600). The number of known Ba stars grew with the discovery of 12 metal-rich Ba giants based on a high-resolution spectroscopic survey of 230 stars (Pereira et al. 2011).Yang et al.
(2016) derived atmospheric parameters and abundances for 19 Ba giants with somewhat lower resolution (R∼30 000) than the other observations. Recently,Karinkuzhi et al.(2018a) pub- lished an analysis of three Ba stars based on FEROS spectra andKarinkuzhi et al.(2018b) observed further 18 Ba stars with the HERMES spectrograph (Raskin et al. 2011). All the men- tioned papers observed differents-process elements. The situation changed substantially since the study byde Castro et al.(2016;
hereafter deC16), in which 182 Ba stars candidates were observed and analysed. We present a detailed comparison between this largest available sample of high-resolution spectroscopic obser- vations of Ba stars from deC16 and predictions for the abundances of thes-process elements produced in AGB models. The final aim is to derive the implications of these new data on our understand- ing of thes-process in AGB stars.
2. Sample stars and error calculations
We consider the largest, self-consistent data set of abundances derived from high-resolution observational data of bona fide and possible Ba stars published by deC16. The whole sample of 182 stars is an order of magnitude larger than those available previously (e.g. as mentioned above,Antipova et al. 2004with 16 stars, Allen & Barbuy 2006a with 26 stars, andYang et al.
2016with 19 stars) and includes Ba giant stars in a wide range of mass, temperature, and metallicity. The observations were car- ried out with the FEROS spectrograph (R=48 000Kaufer et al.
1999), which covers the spectral region from 3800 to 9200 Å.
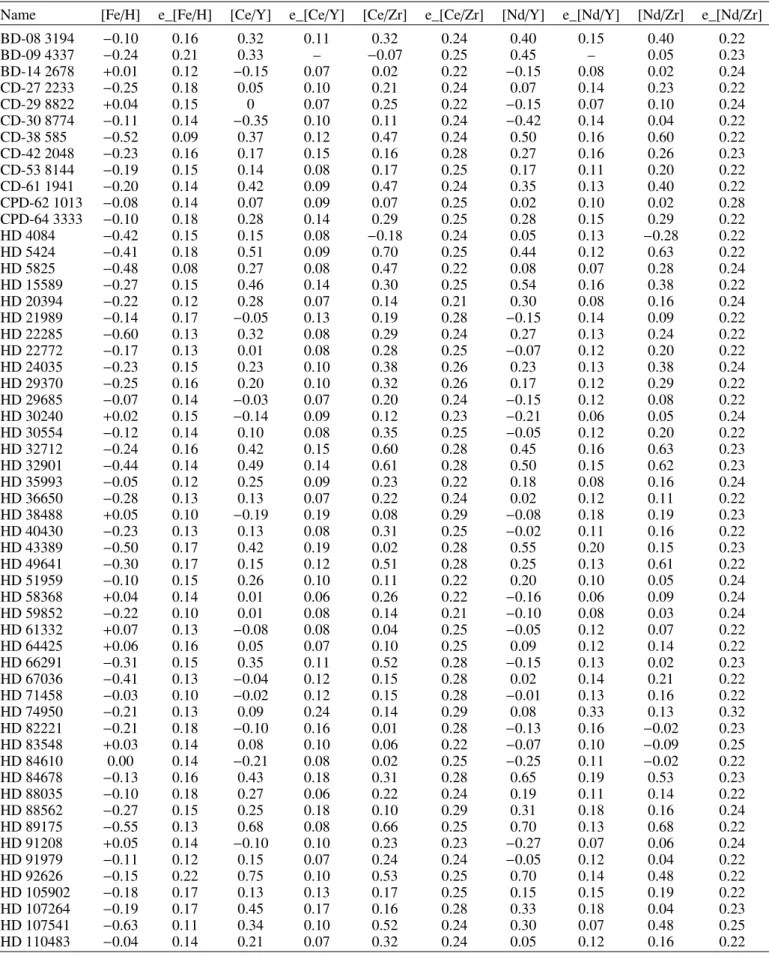
The determination of the atmospheric parameters and the abun- dances of the elements were calculated by measuring the equiv- alent widths (EW) of the spectral lines. See Sect. 4 of deC16 for more details. Thes-process elements analysed are Y (5 lines), Zr (20 lines), La (5 lines), Ce (10 lines), and Nd (16 lines). The Ba abundances are not available because the Ba lines are very strong in the sample stars (EW typically between 200 and 400 mÅ). The selection criteria of deC16 for a Ba star is [s/Fe]1>0.25, [s/Fe]
meaning the average of [Y/Fe], [Zr/Fe], [La/Fe], [Ce/Fe], and [Nd/Fe]. Thirteen stars did not match this criteria and we do not include them in our comparison. The final number of Ba stars considered in this work is thus 169.
To date, extensive use of the so-called ls and hs indexes has been made in relation to observations of s-process elements.
These indexes are calculated as the arithmetic average of the [X/Fe] ratios of the elements belonging to the first (light, ls) and second (heavy, hs)s-process peaks (Luck & Bond 1991) and are referred to as peaks because of their higher abundances in the solar-systems-process distribution. Observable elements heavier
1 Throughout the paper we use the standard spectroscopic notation [X/Y]=log(X/Y)?−log(X/Y), where X and Y are abundances by num- ber.
than Fe that have been considered to belong to the first and sec- ond s-process peak are Sr, Y, and Zr/Ba, La, Ce, Pr, Nd, and Sm and are characterised by isotopes with, or close to, the neu- tron magic number of neutrons N = 50/N = 82. A third peak is located at Pb with N = 126. These elements are produced more by thesprocess relative to the other elements because their neutron-capture cross sections are significantly lower, by up to orders of magnitude, than those of the other isotopes heavier than Fe. During a neutron exposure these magic neutron isotopes are less likely to capture a neutron; they accumulate, resulting in higher abundances.
In this work, we do not use thes-process indexes described above, but consider directly each first and second observed s-process peak element separately. The main reason is that the usage of the ls and hs indexes does not allow a straightforward calculation of the uncertainty. When comparing to the models, a typical value of the order of±0.25 dex has been taken as the error bar for all the stars considered, rather than computed for each individual star. The ls and hs indexes were originally introduced to maximise the information from the spectroscopic analysis and variations in the choice of elements used to calculate these indexes were made to follow the quality of the spectra. How- ever, with the high-resolution spectra and self-consistent sample analysis of deC16 there is a priori no need to maximise infor- mation nor to select elements depending on the quality of the spectra. Considering elemental ratios directly rather than aver- aged indexes allows us to significantly improve the error anal- ysis, calculate uncertainties for individual stars, and single out potential issues related to specific elements. Furthermore, obser- vational studies are able to observe only a number of elements belonging to the first and second peak and the choice of elements used to compute the indexes needed to be adjusted accordingly.
Theoretical studies have used different elements to compute ls and hs; see, for example, definitions inBusso et al. (2001) and Lugaro et al.(2012). This is in principle justified because differ- ent elements belonging to the same s-process peaks are to first order produced in similar amount by the s process relative to their solar abundances. However, it can lead to inconsistencies of the order of 0.1–0.2 dex when comparing results to each other, in particular when considering elements such as Nd, Pr, and Sm whose solar abundances are not predominantly ofs-process ori- gin (Arlandini et al. 1999;Bisterzo et al. 2011).
Sixteen out of 169 stars in our sample show unexpectedly high La abundances with [La/Fe]>2.0 (Fig.1). These [La/Fe]
values are much higher than the [Ce/Fe] and [Nd/Fe] values. For example, HD 24035 has the highest [La/Fe] with 2.70 dex, while both [Ce/Fe] and [Nd/Fe] are 1.58 dex. Likewise HD 43389 has [La/Fe]=2.65, [Ce/Fe]=1.36 and [Nd/Fe]=1.49. This is not possible to explain by the s process, which by definition pre- dicts that elements belonging to the same s-process peak have similar enhancements (see also Sect.3), and we considered the possibility that the La enhancements in these stars may be an observational artefact. We found that they are most likely caused by the very strong La lines (EW'150 mÅ) in their spectra. For this reason we decided to exclude La from further analysis. The other hs elements (Ce and Nd) considered by deC16 do not have such strong lines as La and can be used safely as proxies of the seconds-process peak.Smiljanic et al.(2007) also noted that the uncertainties of thes-process elements abundances for some of their sample stars may be underestimated due to the same prob- lem of determining accurate abundances for elements with very strong lines in the spectra of Ba stars.
We calculated individual error bars for each ratio of a second (Ce and Nd) to a first (Y and Zr) peak element by combining the
0 0.5 1 1.5 2 2.5
-1 -0.8 -0.6 -0.4 -0.2 0
[Fe/H]
[La/Fe]
[Ce/Fe]
[Nd/Fe]
Fig. 1.[La/Fe], [Ce/Fe], and [Nd/Fe] values for the 169 sample stars showing the difference between the individual [hs/Fe] abundances.
uncertainties coming from the model atmospheres, and from the dispersion of the observed abundances if at least three lines are available for the given element. These calculated errors are likely to be upper limits because most of the stellar parameters are not independent from each other. The steps of our error calculations are the following:
1. Calculate the variation as the difference of two elements (X and Y) for ∆Teff,∆log g,∆ξ,∆[Fe/H], and∆Wλ from Tables 9, 10, and 11 of deC16. The stars were grouped in these three tables according to the three temperature ranges 5000–5400 K, 4700–4900 K, and 4100–4600 K. The uncer- tainty was calculated as
vu ut
∂hX
Y
i
∂Teff
2
+
∂hX
Y
i
∂logg
2
+
∂hX
Y
i
∂ξ
2
+
∂hX
Y
i
∂[Fe/H]
2
+
∂hX
Y
i
∂Wλ
2
.
(1) The calculated value for each group was applied to all the stars belonging to the same group.
2. Calculate the uncertainty coming from the dispersion of the abundances as
q(σobs/√
N)2A+(σobs/√
N)2B, where A and B are two different elements,Nis the number of lines for each element, andσobsis the dispersion of the abundances among different lines.
3. Combine the errors calculated in steps 1 and 2 above by tak- ing the square root of the sum of the squares of the two errors.
Figure2shows the [Ce/Y] ratios as a function of [Fe/H] as an example of the results. The [Fe/H] error for each star is the dispersion given in deC16. The distribution presents (1) a clear trend of [Ce/Y] increasing by 0.6 dex as [Fe/H] correspondingly decreases by 0.6 dex (weighed fit solid line); (2) a spread of roughly a factor of three (dashed lines at±0.25) at any given metallicity, and (3) a few (<5%) outliers located with their error bars outside the dashed lines at both higher and lower [Ce/Y]
values. These results represent a significant improvement with respect to all the previously available data. In fact, early studies aimed at understanding the physics of thesprocess in AGB mod- els using spectroscopic observations (Smith & Lambert 1988;
Busso et al. 1992,1995,2001) had to rely on very limited data sets and to consider together all the available observations, not only from Ba stars but also from AGB and post-AGB stars (see
-0.8 -0.6 -0.4 -0.2 0 0.2 0.4 0.6 0.8 1 1.2
-1.2 -1 -0.8 -0.6 -0.4 -0.2 0 0.2
[Ce/Y]
[Fe/H]
Fig. 2.[Ce/Y] values for the 169 sample stars. The dots without error bars represent stars for which there are less than 3 lines for one of the elements. The solid line represents the weighed fit through the data points with [Fe/H] between solar and−0.8. The equation of the line is (−0.038±0.021)+(−0.796±0.087)×x. The dotted lines represent a spread of±0.25 around the fitted line.
e.g. Fig. 12 of Cristallo et al. 2011). However, different sam- ples from different studies are prone to be inconsistent with each other, and further, different types of stars may represent the sig- nature of different physics.
3. Models
For comparison to the observational data we consider two sets of models: the FRUITY models available on-line via the FRUITY database2 (Cristallo et al. 2009, 2011, 2015b) and the Monash models (Lugaro et al. 2012; Fishlock et al. 2014;
Karakas & Lugaro 2016; Karakas et al. 2018). These data sets are the most complete available for thesprocess in AGB stars in terms of stellar mass and metallicity. The FRUITY models are available for eight metallicities between Z = 0.001 and 0.02, covering the whole range of Ba stars. The Monash mod- els are available for five metallicities between Z = 0.001 and 0.03. Models produced by the NuGrid collaboration have also become recently available (Pignatari et al. 2016; Battino et al.
2016; Ritter et al. 2018) for the following four metallicities in the range of interest in this work: 0.001, 0.006, 0.01, and 0.02.
We do not include these models in the following tables but dis- cuss and compare these NuGrid models with the Monash and FRUITY models where relevant3.
The details of the models have been reported elsewhere and are provided in the papers mentioned above. All the models pre- sented in this work were calculated using initial solar scaled abundances fromAsplund et al.(2009). Some FRUITY models were further computed including stellar rotation (Piersanti et al.
2013) and we include some of these models in the discussion. In Table1and Fig.3we present the results from the FRUITY mod- els and in Table2and Fig.4those from the Monash models. We selected only models that are able to achieve [s/Fe]>0.25 dex at the stellar surface, since this is the same condition applied by deC16 to define Ba stars. However, the Ba stars from deC16 are
2 http://fruity.oa-teramo.inaf.it/
3 Another recent stellar AGB model yield set for different metallicities has been used in a focus study on the Galactic chemical evolution of heavy elements (Bisterzo et al. 2016), but we do not consider this yield set since tabulated data are not available.
all giants and dilution of the s-process AGB material deposited on the stellar surface necessarily occurred owing to the presence of their convective envelope. Consequently, only the models that achieve [s/Fe] above roughly 0.5 dex are appropriate for com- parison, as we discuss in detail at the start of Sect. 4. On the other hand, all the models we present are appropriate for future comparison to observations of Ba dwarfs. Even if these are less luminous and more difficult to observe than the Ba giants con- sidered in this work, the number of known Ba dwarfs is continu- ously growing (see e.g.Kong et al. 2018and references therein).
In the case of Ba dwarfs, the material deposited on the stellar surface during the mass transfer may remain undiluted, although several mixing processes could occur that may carry this mate- rial deeper into the star and dilute it. These processes have been investigated in detail mostly in relation to CEMP stars (see e.g.
Matrozis & Stancliffe 2017and references therein).
The FRUITY models include the formation of the13C pocket in a self-consistent way based on a time-dependent overshoot mechanisms. The free overshoot parameter βin the exponen- tially decaying velocity function is set so that enough neutrons are released in order to maximise the production of s-process elements (seeCristallo et al. 2009for details). On the other hand, in the Monash models the mixing of protons leads to the for- mation of13C pockets is performed by adding an exponential profile of the proton abundance into the top layers of the He intershell over an extent in mass Mmix, which is a free param- eter. A detailed description of this method and related equations is given inBuntain et al.(2017). These authors also showed that varying the steepness of the exponential function or the variable Mmix produces similar results in terms of the s-process abun- dance distribution. We consider models in which only Mmix is varied and show these in Table2. A few of the Monash models with the lowest mass or the highest metallicity were calculated including non-time-dependent overshoot, by extending the base of the envelope byNov(value indicated in footnotes of Table2) pressure scale heights during the TDU. This overshoot does not lead to the partial mixing needed to produce the13C pocket, but has the effect of enhancing the TDU efficiency and producing C stars of low initial masses, as required by observations (see discussion inKamath et al. 2012;Karakas & Lugaro 2016).
Careful comparisons between the two sets of models in rela- tion to thes-process results can be found inFishlock et al.(2014) andKarakas & Lugaro(2016). The main difference between the FRUITY and Monash sets of models are the absolute values of the elemental abundances, i.e. the [X/Fe] ratios. The FRUITY models have typically lower abundances than the Monash mod- els, depending on the size of Mmix. For example, in the case of the 3M model of Z = 0.014, the Monash model with Mmix = 2×10⁻³M, results in [Ce/Fe] roughly 0.5 dex higher than the corresponding FRUITY model. This has been noted before and is also due to a different efficiency of the TDU. As demonstrated by Tables1and2, the elements belonging to the first peak (Y and Zr) behave very similarly to each other and have [X/Fe] values mostly within 0.15 dex. The same applies to the elements belonging to the second peak (Ce and Nd), although some differences of up to 0.3 dex are present in this case in the Monash models of higher mass.
The most obvious feature of both sets of models in Tables1 and2is the shift of the peak abundance production from the first to the second and to the thirds-process peak as the metallicity decreases. Figures 3and4 show the [Ce/Y] ratios as function of metallicity for all the models considered. All the models up to 3M for which 13C is the main neutron source show the same trend where the [Ce/Y] ratios increase with decreasing
Table 1.FRUITY models that achieve [s/Fe]>0.25 at the stellar surface in the metallicity range relevant to Ba stars, computed without rotation.
M(M) Z TDUtot [Y/Fe] [Zr/Fe] [Rb/Fe] [La/Fe] [Ce/Fe] [Nd/Fe] [Pb/Fe] [Ce/Y]
1.5 0.001 8 0.711 0.739 0.254 1.35 1.46 1.36 2.46 0.749
0.002 7 0.798 0.858 0.297 1.50 1.62 1.53 2.38 0.822
0.003 6 0.713 0.786 0.198 1.47 1.58 1.48 1.93 0.867
0.006 7 0.813 0.875 0.193 1.42 1.47 1.33 1.17 0.657
0.008 5 0.682 0.734 0.145 1.09 1.11 0.96 0.642 0.428
0.01 4 0.715 0.748 0.207 0.913 0.904 0.742 0.399 0.189
0.014 5 0.621 0.62 0.148 0.586 0.514 0.368 0.152 −0.107
2.0 0.001 11 1.05 1.08 0.701 1.63 1.74 1.63 2.65 0.69
0.002 11 1.04 1.08 0.465 1.72 1.84 1.74 2.55 0.80
0.003 11 1.05 1.11 0.395 1.82 1.93 1.82 2.19 0.88
0.006 10 1.15 1.21 0.389 1.72 1.76 1.61 1.47 0.61
0.008 10 1.11 1.15 0.338 1.50 1.52 1.36 1.11 0.41
0.01 9 1.11 1.13 0.362 1.36 1.32 1.13 0.857 0.21
0.014 9 1.01 1.00 0.305 0.957 0.887 0.707 0.496 −0.123
0.02 9 0.923 0.865 0.306 0.56 0.507 0.375 0.189 −0.416
2.5 0.001 10 0.939 0.995 0.676 1.48 1.58 1.48 2.53 0.641
0.002 10 0.925 0.957 0.526 1.53 1.65 1.53 2.45 0.725
0.003 11 1.03 1.06 0.462 1.73 1.84 1.73 2.13 0.81
0.006 13 1.27 1.32 0.560 1.80 1.85 1.71 1.57 0.58
0.008 15 1.30 1.33 0.505 1.63 1.64 1.47 1.26 0.34
0.01 14 1.28 1.30 0.486 1.43 1.40 1.22 1.00 0.12
0.014 13 1.18 1.16 0.466 1.03 0.995 0.819 0.621 −0.185
0.02 15 1.07 0.999 0.413 0.643 0.626 0.485 0.256 −0.444
3.0 0.001 11 0.885 0.926 0.776 1.33 1.39 1.32 2.39 0.505
0.002 10 0.844 0.871 0.623 1.32 1.40 1.31 2.29 0.556
0.003 9 0.697 0.732 0.364 1.32 1.43 1.33 2.03 0.733
0.006 9 0.849 0.895 0.312 1.46 1.52 1.38 1.29 0.671
0.008 10 1.03 1.06 0.369 1.41 1.42 1.26 1.04 0.39
0.01 11 1.05 1.06 0.361 1.24 1.20 1.02 0.796 0.15
0.014 13 1.06 1.04 0.375 0.965 0.899 0.726 0.539 −0.161
0.02 14 1.01 0.931 0.380 0.615 0.574 0.439 0.235 −0.436
4.0 0.001 15 0.617 0.612 0.709 0.838 0.858 0.801 1.83 0.241
0.002 15 0.462 0.479 0.441 0.827 0.872 0.804 1.75 0.41
0.003 12 0.507 0.511 0.368 0.846 0.90 0.807 1.59 0.393
0.006 9 0.728 0.693 0.402 0.913 0.961 0.859 1.04 0.233
0.008 9 0.405 0.41 0.171 0.745 0.781 0.684 0.663 0.376
0.01 8 0.436 0.44 0.159 0.691 0.697 0.59 0.468 0.261
0.014 8 0.42 0.414 0.126 0.478 0.451 0.351 0.231 0.031
0.02 8 0.569 0.536 0.168 0.43 0.407 0.312 0.189 −0.162
5.0 0.001 24 0.527 0.469 0.812 0.378 0.356 0.326 1.23 −0.171
0.002 22 0.351 0.313 0.570 0.417 0.433 0.394 1.24 0.082
0.003 18 0.26 0.256 0.286 0.466 0.501 0.439 1.18 0.241
0.006 12 0.227 0.23 0.144 0.511 0.563 0.486 0.739 0.336
0.008 11 0.27 0.274 0.150 0.554 0.589 0.501 0.522 0.319
0.01 11 0.215 0.217 0.0988 0.414 0.421 0.344 0.242 0.206
Notes. The mass (inM), metallicity, total number of TDU episodes (TDUtot), final surface abundances [X/Fe] of selected elements, and the [Ce/Y] ratios are indicated.
[Fe/H]. This is a well-known feature of the13C neutron source (Busso et al. 2001) and a fundamental consequence of the fact that the neutron exposureτin the13C pocket is proportional to the13C/56Fe abundances ratio. This ratio increases with decreas- ing the metallicity because the number of Fe seeds decreases with metallicity, while the number of13C nuclei does not change with metallicity. The 13C nuclei are primary (i.e. metallicity independent) because they are produced by the interaction of H with the12C produced by He burning (Clayton 1988). In other words, fewer Fe seeds capturing neutrons means that more free neutrons are available for progressing to the production of the
heaviest elements. The maximum [Ce/Y] value is around 0.8 in both sets of models, however, at higher metallicities the [Ce/Y]
ratios from the Monash models are typically higher, at most by roughly 0.3 dex, than the FRUITY models. This may be partly due to the details of the different implementation for the forma- tion of the 13C pocket, where Buntain et al. (2017) found dif- ferences of roughly 0.1 dex for proton profiles not drastically different from each other (see 1.8Mmodels in their Table 5) as well as lower temperatures in the intershell in the FRUITY models leading to incomplete burning of13C before the onset of the next TP.
The models byRitter et al.(2018) do not produce high enough Ba and s-process abundances to be able to explain the level of enrichment observed in the metallicity range of Ba stars in the deC16 sample. This is due to the prescription used for the convective-boundary mixing at the bottom of the convective enve- lope during the TDU, where an exponential-diffusive model is based onFreytag et al.(1996) andHerwig(2000). This results in13C pockets smaller and less efficient in makings-process ele- ments compared to the other models considered. In the AGB mod- els byBattino et al.(2016), the efficiency of13C pocket forma- tion is higher with respect to the models byRitter et al.(2018) owing to the inclusion of the effect of gravity waves, as accord- ing toDenissenkov & Tout(2003). These models produce [s/Fe]
in the range observed in Ba stars, from 0.5 to 1.5 dex, and [hs/ls]
ratios from 0 to 0.5 dex for stars of around solar metallicity, within the same range predicted by the Monash and the FRUITY mod- els. We note that, based onHerwig et al.(2007) study, the mod- els byRitter et al. (2018) and Battino et al.(2016) also employ convective-boundary mixing at the bottom of convective TPs . This results in an increased12C abundance in the He intershell, a higher13C abundance in the13C pocket, and a local higher number of neutron captures per Fe seeds (Lugaro et al. 2003b).
As shown in Figs.3and4, below [Fe/H]∼ −0.6 the [Ce/Y]
ratio becomes flat as equilibrium is achieved between the first two peaks while the s-process flux reaches the third peak at Pb.
The production of Pb located at the end of the s-process chain of neutron captures increases steadily with decreasing metallic- ity (Gallino et al. 1998;Van Eck et al. 2001); the result is that most of the cosmic Pb is made in low-metallicity AGB stars (Travaglio et al. 2001).
The effect of the 22Ne neutron source becomes more pro- nounced with increasing stellar mass. Similar to the13C reac- tion, this neutron source also becomes more efficient in pro- ducing heavier elements as the metallicity decreases. The22Ne abundance derives from the initial CNO abundance in the star and thus it decreases with the metallicity together with the Fe seeds. However, there is a primary component to22Ne due to the TDU of primary12C from partial He burning;12C is converted in
14N via H burning, which, in turn, produces22Ne via doubleα- capture during He burning. The22Ne neutron source is activated efficiently in AGB stars of initial mass above 4–5M, the exact range depending on the metallicity, where it contributes to the production of the bulk of the elements heavier than Fe. In these models, we still see enhancements in the elements heavier than Fe even if the13C(α,n)16O reaction is not present (see e.g. the Monash models of masses between 3.5 and 4.5MatZ=0.001 withMmix=0). In stars of mass between 2.5Mand 4M, the exact range again depending on the metallicity, the22Ne neutron source is also activated, albeit marginally. In this case this does not significantly contribute to the production of the bulk of the elements heavier than Fe, but it can act upon and affect the dis- tribution produced by the13C source. In these models if the13C source is not present, we do not have any significant production ofs-process elements. For example, the Monash 3.75Mmodel at Z=0.007 with Mmix = 0 produces only [Sr/Fe]=0.024 and [Ba/Fe]=0.015 (seeKarakas & Lugaro 2016).
The activation of the22Ne source in our models of higher mass (>2.5M) results in higher production of the first peak s-process elements for metallicities around solar, and higher pro- duction of the second peak s-process elements for lower metal- licities. This is due to the neutron exposure produced by the
22Ne source being roughly an order of magnitude lower than that produced by the 13C. This effect is more noticeable in the Monash than in the FRUITY models. In fact, at the earlier TDUs,
-0.8 -0.6 -0.4 -0.2 0 0.2 0.4 0.6 0.8
-1.2 -1 -0.8 -0.6 -0.4 -0.2 0 0.2 0.4
[Ce/Y]
[Fe/H]
FRUITY 1.5 M
O.
2.0 MO.
2.5 M
O.
3.0 MO.
4.0 M
O.
5.0 MO.
Fig. 3.[Ce/Y] ratio vs. [Fe/H] at the stellar surface at the end of the evolution from all the FRUITY models with [s/Fe] >0.25 reported in Table1. The different colours represent different stellar masses, as indicated.
the Monash models of masses above roughly 2.5M produce similar [Ce/Y] ratios as the FRUITY models. Later on, when the temperature increases and the22Ne source is more significantly activated, the [Ce/Y] ratios decrease. For example, the Monash 3M, [Fe/H]=−0.3 model produces [Ce/Y] ∼0.6 after the first few TDUs, which is very similar to the FRUITY model; how- ever, as the TDU number increases the ratio decreases to the final values around 0.3 dex seen in the Fig.4. Another effect of the
22Ne neutron source noticeable in Tables1and2is the produc- tion of Rb (Abia et al. 2001). This depends on the activation of the branching point at86Rb (van Raai et al. 2012) for the higher neutron densities associated with the22Ne neutron source (up to 1013cm3) with respect to the13C source (up to 108cm3). In fact, for the low-mass stars [Rb/Fe]<[Zr/Fe], while for the high-mass stars the [Rb/Fe] increases and the reverse applies in some cases.
Further differences appear between the FRUITY and Monash predictions for AGB stars of masses above roughly 4M. In the Monash models these masses show a similar behaviour to the lower masses, while in the FRUITY models the 4 and 5Mstars deviate from the trend of the lower masses in that the [Ce/Y]
ratios remains below 0.4.
Finally, we note that in the Monash models of mass above 3 and metallicity 0.001 (Fishlock et al. 2014) the13C pocket was not included and the resulting s-process distribution is domi- nated by the effect of the 22Ne source producing the first s- process peak much more favourably than the second peak. The resulting [Ce/Y] ratios are negative. There are only three Ba stars at this metallicity and they show positive [Ce/Y], which appears to exclude these models as a fit for these stars.
4. Results and discussion
In Fig.5 we plot the [Ce/Y] ratio as a function of the overall enhancement of the two elements. In this and the following fig- ures we selected from our full set of models those of mass 1.5, 3, and 4M. This range well represents the observations of the masses of Ba stars, which show a peak at around 2.5M and a spread around this peak of roughly±1.5M(de Castro et al.
2016; Escorza et al. 2017). The rest of the models shown in Figs. 3 and 4 are within the values of those plotted in the following figures. Overall, both the data and models show a qualitatively similar trend: higher [Ce/Y] ratio are expected for
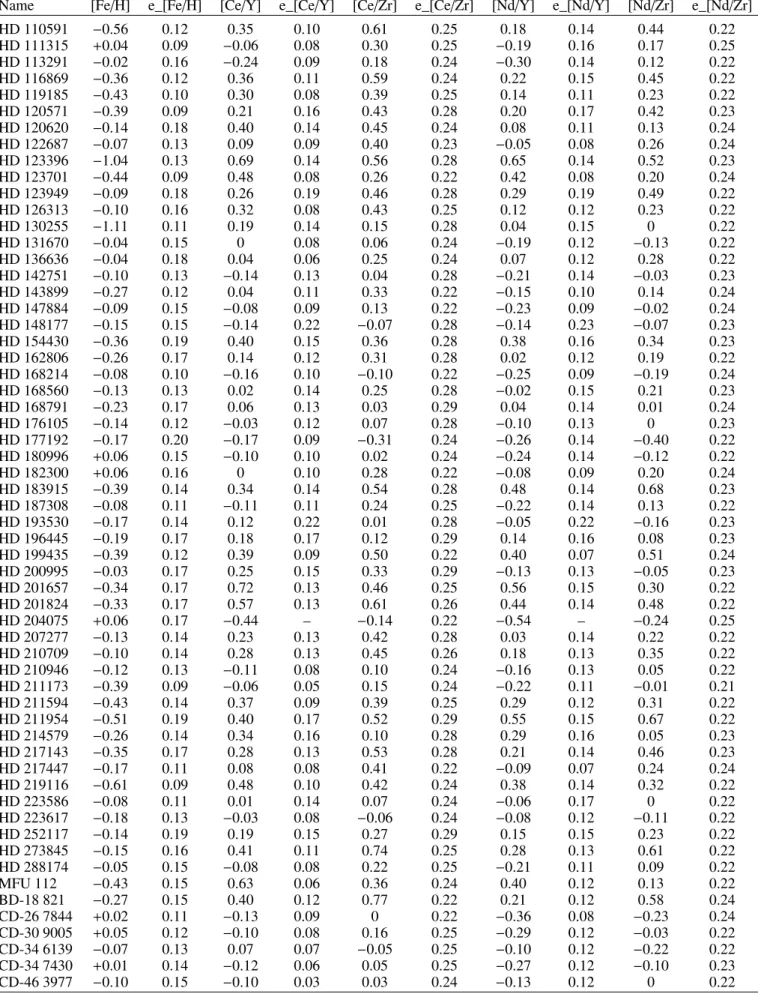
Table 2.Same as Table1but for the Monash models.
M Z Mmix TDUtot [Y/Fe] [Zr/Fe] [Rb/Fe] [La/Fe] [Ce/Fe] [Nd/Fe] [Pb/Fe] [Ce/Y]
1.5 0.001 2×10⁻³ 10 1.099 1.179 0.520 1.617 1.723 1.625 2.681 0.625
0.0028 2×10⁻³ 7 0.922 0.960 0.291 1.516 1.633 1.538 2.200 0.711
6×10⁻³ 7 1.319 1.377 0.553 1.910 1.998 1.891 2.428 0.679
0.007a 2×10⁻³ 5 0.730 0.781 0.152 1.293 1.381 1.274 1.367 0.652
0.014b 2×10⁻³ 4 0.684 0.728 0.163 0.962 0.947 0.797 0.424 0.263
2.0 0.001 2×10⁻³ 14 1.418 1.526 0.697 2.031 2.139 2.022 2.954 0.721
0.0028 2×10⁻³ 13 1.401 1.435 0.701 2.001 2.118 2.014 2.678 0.717
6×10⁻³ 13 1.827 1.881 1.119 2.371 2.436 2.318 2.729 0.609
0.014 1×10⁻³ 8 0.889 0.948 0.193 1.112 1.087 0.917 0.677 0.198
2×10⁻³ 8 1.155 1.199 0.337 1.308 1.299 1.135 1.055 0.144
4×10⁻³ 8 1.361 1.388 0.497 1.492 1.514 1.368 1.402 0.152
2.5 0.001 2×10⁻³ 16 1.544 1.677 1.199 2.134 2.265 2.072 2.940 0.721
0.0028 2×10⁻³ 17 1.633 1.681 1.026 2.253 2.365 2.239 2.596 0.731
4×10⁻³ 17 1.862 1.913 1.400 2.433 2.510 2.376 2.726 0.648
0.007 2×10⁻³ 15 1.499 1.560 0.668 1.983 2.030 1.888 1.896 0.531
0.014 2×10⁻³ 12 1.355 1.377 0.533 1.414 1.411 1.255 1.224 0.057
0.03c 2×10⁻³ 12 1.223 1.177 0.480 0.927 0.905 0.747 0.510 −0.319
3.0 0.001 5×10⁻⁴ 20 1.082 1.272 1.002 1.594 1.754 1.532 2.563 0.671
0.0028 1×10⁻³ 17 1.467 1.507 1.204 1.861 1.992 1.799 2.246 0.525
2×10⁻³ 17 1.521 1.580 1.453 2.095 2.223 2.016 2.602 0.703
0.007 1×10⁻³ 19 1.414 1.463 0.751 1.819 1.850 1.691 1.567 0.437
2×10⁻³ 19 1.680 1.721 1.038 1.954 1.965 1.792 1.775 0.284
0.014 1×10⁻⁴ 17 0.412 0.431 0.076 0.430 0.376 0.247 0.042 −0.036
1×10⁻³ 17 1.310 1.338 0.542 1.343 1.305 1.126 0.931 −0.005
2×10⁻³ 17 1.537 1.527 0.798 1.457 1.455 1.297 1.198 −0.082
0.03a 2×10⁻³ 16 1.227 1.152 0.584 0.936 0.919 0.767 0.557 −0.308
3.5 0.001 0 27 0.577 0.514 0.890 0.096 0.087 0.018 0.043 −0.491
0.0028 1×10⁻³ 21 1.302 1.396 1.341 1.825 1.972 1.761 2.398 0.671
0.007 1×10⁻³ 19 1.412 1.478 1.136 1.798 1.852 1.607 1.543 0.439
0.014 1×10⁻³ 19 1.344 1.331 0.777 1.172 1.141 0.965 0.801 −0.203
0.03 1×10⁻³ 24 1.103 1.003 0.598 0.638 0.607 0.467 0.255 −0.496
4.0 0.001 0 68 1.417 1.396 1.650 0.723 0.680 0.445 0.294 −0.738
0.0028 1×10⁻⁴ 24 0.540 0.601 0.607 0.924 1.063 0.870 1.736 0.523
0.007 1×10⁻⁴ 23 0.561 0.630 0.466 1.030 1.160 0.953 1.073 0.599
1×10⁻³ 23 1.349 1.428 1.340 1.758 1.861 1.618 1.974 0.512
0.014 1×10⁻⁴ 20 0.513 0.540 0.276 0.676 0.656 0.469 0.165 0.143
1×10⁻³ 20 1.280 1.278 1.120 1.223 1.238 0.997 0.950 −0.042
0.03 1×10⁻³ 20 1.036 0.918 0.713 0.572 0.535 0.389 0.175 −0.501
4.5 0.001 0 78 1.425 1.410 1.646 0.729 0.690 0.455 0.305 −0.735
0.0028 1×10⁻⁴ 30 0.610 0.668 0.712 0.982 1.124 0.934 1.808 0.515
0.007 1×10⁻⁴ 50 0.780 0.867 0.848 1.235 1.366 1.139 1.188 0.586
0.014 1×10⁻⁴ 29 0.629 0.682 0.435 0.765 0.750 0.525 0.223 0.120
1×10⁻³ 29 1.314 1.350 1.325 1.514 1.590 1.331 1.685 0.275
0.03 1×10⁻³ 16 0.855 0.768 0.793 0.586 0.559 0.400 0.248 −0.296
Notes.In this table a further Col. (3) is added, which indicates the value ofMmixin units ofM.(a)Nov=1.0,(b)Nov=3.0,(c)Nov=2.5.
higher s-process enhancements. This is a typical feature of the sprocess because higher neutron exposures naturally result in an increase of both the absolute amount of abundances produced (represented by thexaxis in the figure) and a shift towards the second s-process peak (represented by theyaxis). Any [X/Fe]
ratio, where X is a generics-process element or a combination of s-process elements such as in thex-axis of Fig.5, is affected by the binary transfer and accretion mechanism not considered in our models, which determines the amount ofs-process material carried from the primary to the secondary star. This is because Fe is not significantly affected by AGB nucleosynthesis. The
accretion mechanism controls which fraction of the total mat- ter lost by the primary star is deposited onto the secondary. Fur- thermore, if the Ba star is a giant, as in the case of all the stars considered in this work, the material deposited at its surface is mixed with the whole stellar envelope and further diluted.
Figure 5 shows that the 3M models allow for an overall dilution factor between 0.5 and 1.5 dex. This dilution factor cor- responds to a horizontal shift of the model predictions. If we assume for simplicity that the accreted material is mixed with an envelope mass of roughly 2M, this dilution factor trans- lates into roughly 0.7–0.07M that needs to be accreted from
-0.8 -0.6 -0.4 -0.2 0 0.2 0.4 0.6 0.8
-1.2 -1 -0.8 -0.6 -0.4 -0.2 0 0.2 0.4
[Ce/Y]
[Fe/H]
Monash 1.5 M
O.
2.0 MO.
2.5 M
O.
3.0 MO.
3.5 M
O.
4.0 MO.
4.5 M
O.
Fig. 4.[Ce/Y] ratio vs. [Fe/H] at the stellar surface at the end of the evolution from all the Monash models with [s/Fe] >0.25 reported in Table2. As in Fig.3, the different colours represent different stellar masses. The solid lines represent the models withMmix=2×10⁻³M, the dashed lines with Mmix = 1×10⁻³M, and the different types of dots represent the following Mmix values: circle= 1×10⁻³M; square=4×10⁻³M; triangle=6×10⁻³M; cross=1×10⁻⁴M; and diamond=0.
-0.5 0 0.5 1 1.5
0 0.5 1 1.5 2
[Ce/Y]
([Y/Fe]+[Ce/Fe])/2 Monash 1.5 M
O.
Monash 3.0 M
O.
Monash 4.0 MO.
-0.5 0 0.5 1 1.5
0 0.5 1 1.5 2
[Ce/Y]
([Y/Fe]+[Ce/Fe])/2
FRUITY 1.5 M
O.
FRUITY 3.0 M
O.
FRUITY 4.0 MO.
Fig. 5.[Ce/Y] ratios plotted against the average enhancements of the two elements for the Ba stars and the final surface composition a selec- tion of models with the indicated stellar masses. For the 1.5 and 3M
Monash models we used the cases withMmix =2×10⁻³M, for the 4M Monash models the cases withMmix = 1×10⁻³M. The dots without error bars represent stars for which there are less than 3 lines for one of the elements.
the primary star. The 1.5M models instead only allow for a dilution factor around 0.5 dex, which translates in 0.3M of accreted mass, considering this time an envelope of 1M. The 4MMonash models computed withMmix =1×10⁻⁴Mpro- duce a similar result as the 3M models, while the FRUITY models of the same mass only allow for dilution due to mass accretion at low metallicity. The predicted [X/Fe] values depend on the efficiency of the TDU, mass loss, and extent of the 13C pocket. These are the three major AGB model uncertainties; as a consequence the models cannot set strong constraints on the accretion process.
One the other hand, if we consider [X/Y] ratios in which both elements are produced by thesprocess, the dilution due to mass transfer and mixing on the secondary applies to both the elements and in first approximation this dilution is factored out
when taking the ratios. For example, the [hs/ls] ratio has been extensively used as a direct measure of the neutron exposureτin the intershell of AGB stars. This is because the relative accumu- lation of thes-process peaks is a strong function of the total num- ber of available neutrons, represented by the total time-integrated neutron flux, orτ.
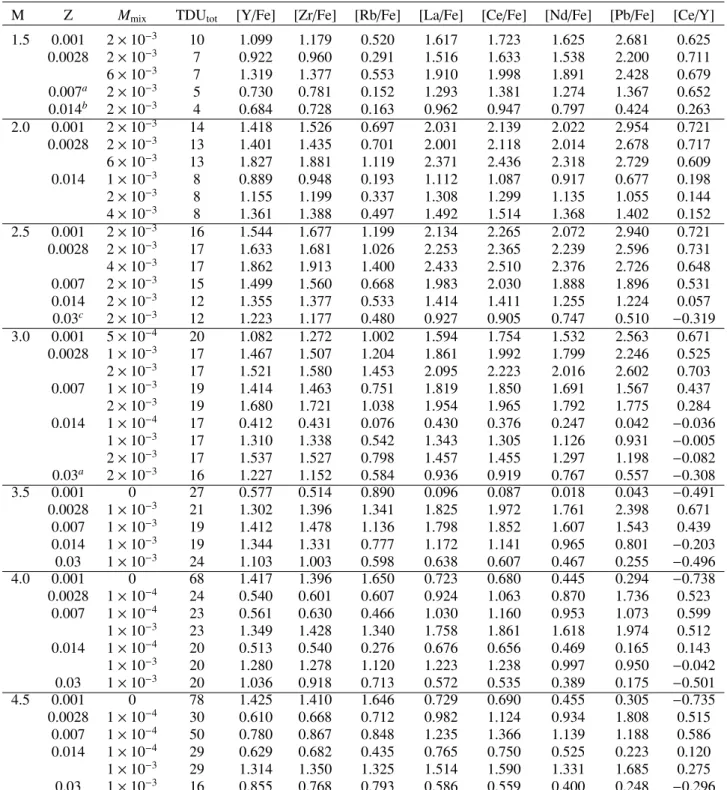
In Fig. 6 we combine the different possibilities of ratios between the first and second peaks-process elements observed in the Ba stars by deC16 and compare these to the stellar mod- els. We note that while the predicted [X/Fe] are calculated nor- malising to the solar meteoritic abundances fromAsplund et al.
(2009), the observations are normalised to the solar photospheric abundances given inGrevesse & Sauval(1998). For the species taken into consideration in this paper the largest difference is of 0.07 dex for both Y and Zr, which is comparable to typical uncer- tainties in the solar abundances themselves. Based on our error calculations the ratios computed using Zr show higher error bars than those computed using Y. The plots show the predicted final surface composition of the AGB stars, i.e. after the last com- puted TDU episode, while the mass transfer could have occurred earlier. The plotted ratios, however, are not significantly differ- ent at earlier times, as far as enoughs-process abundances are present at the stellar surface to allow for dilution into the Ba star envelope. The main result is that the data trend of thes-process ratios increasing with decreasing [Fe/H] between 0 and−0.8 is matched by the theoretical trend of the models. This clearly con- firms the primary behaviour of the main13C neutron source.
Several second-order effects can produce the spread of roughly a factor of three at any given [Fe/H] (see also Fig.2):
variations in the initial mass, which can affect the activation of the22Ne neutron source and the temperature in the13C pocket;
the treatment of the mixing at the base of the TP and dur- ing the TDU (see e.g. the difference between the “Standard”
and the “Tail” FRUITY models inCristallo et al. 2015aand the magnetic models ofTrippella et al. 2016); or mixing within the
13C pocket possibly due to stellar rotation or magnetic fields.
Because of the uncertainties associated with all these processes it is not yet possible to accurately establish among these possi- bilities the actual physics from which the spread originates. Fur- thermore, the exact location of the theoretical spread cannot be firmly established until systematic uncertainties in the neutron- capture cross sections of the nuclei involved are resolved. For example, the neutron-capture cross section of the mains-process seed nucleus56Fe is uncertain at the temperature of 90 MK of the activation of the13C neutron source because experimental data are currently available only for temperatures around 270 MK and the lower temperature values are derived via extrapolation using theoretical models. As an exercise, we calculated a 3M, Z =0.014 Monash model increasing the neutron-capture cross section of 56Fe by 50% in the whole temperature range. The result is a decrease of the [Ce/Y] ratio of roughly 10% (i.e.
0.04 dex). The decrease is expected since if56Fe captures more neutrons, the neutron exposure decreases, however, the effect is not linear. Furthermore, new evaluations of the neutron-capture cross sections of 140Ce and 89Y, of crucial importance in this paper, are currently undergoing at the n_TOF experiment at CERN (Amaducci et al. 2018; Tagliente et al. 2017). The new values may result in a systematic shift of the plotted lines.
The case of stellar rotation
The transport of angular momentum in rotating stars has received much attention in the past decade in relation to aster- oseismology observations from theKeplersatellite. These have
-0.4 0 0.4 0.8
1.2 [Ce/Y]
FRUITY 1.5M
O.FRUITY 3.0M
O.FRUITY 4.0M
O.NuGrid 3.0M
O.-0.4 0 0.4 0.8 [Ce/Zr] 1.2
Monash 1.5M
O.Monash 3.0M
O.Monash 4.0M
O.-0.4 0 0.4 0.8 1.2
-1.2 -0.8 -0.4 0 [Nd/Y]
[Fe/H]
-1.2 -0.8 -0.4 0
-0.4 0 0.4 0.8 [Nd/Zr] 1.2
[Fe/H]
Fig. 6.Comparison between Ba star observations and the predicted final surface composition for the same selection of FRUITY and Monash models as in Fig.5. We show also 3Mtype He07 models fromBattino et al.(2016) for comparison. We consider all of the four combinations of ls (Y and Zr) and hs (Ce and Nd) elements. The dots without error bars represent stars for which there are less than 3 lines for one of the elements.
allowed us to infer the rotation of the stellar core as stars evolve from the main sequence onto the giant branch and demonstrate that the cores of red giant stars rotate much slower than expected by models that do not include any coupling of the faster rotating, contracting core with the slower rotating, expanding envelope (Mosser et al. 2012; Deheuvels et al. 2015;Gehan et al. 2018).
Rotational rates of WDs also show that they rotate slower than expected (Suijs et al. 2008; Hermes et al. 2017). On the other hand, we cannot derive the core rotation for AGB stars directly because the asteroseismology observations that would allow us to do that are expected to be at low frequency, and their usage is hampered by the frequency resolution determined by the limited length of the availableKeplerobservations and by instrumental effects (Mosser et al. 2013).
Regarding thesprocess, stellar rotation and the ensuing dif- ference in the angular momentum between the core and enve- lope when the star becomes a giant has been demonstrated to drive mixing inside the 13C pocket during the neutron flux on the AGB phase and effectively diminish the neutron expo- sure (Herwig et al. 2003;Siess et al. 2004;Piersanti et al. 2013).
This is because the partial mixing of protons from the enve- lope that results in the formation of the 13C pocket also pro- duces an adjacent 14N-rich pocket (Goriely & Mowlavi 2000;
Lugaro et al. 2003b; Cristallo et al. 2009; Buntain et al. 2017).
Rotational mixing, if it occurs, carries14N into the13C pocket, and the 14N(n,p)14C reaction (Wallner et al. 2016) effectively captures the free neutrons. Rotation could thus represent a second parameter that varies the s-process distribution at any given metallicity.
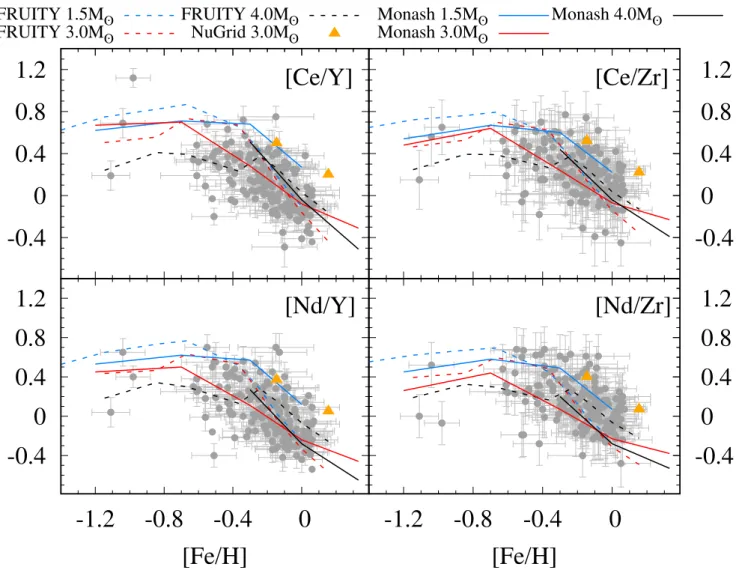
In Fig.7 we compare the Ba star data to 1.5M FRUITY models computed with and without the inclusion of an initial rotational velocity (IRV) of 60 km s−1 (Piersanti et al. 2013).
This is a typical value for stars of this mass, while stars of higher mass are known to initially rotate even faster,>100 km s−1 (Stauffer & Hartmann 1986; Nielsen et al. 2013). As a conse- quence of the mixing of 14N into the 13C-rich region, in the rotating models the neutron exposure in the13C pocket is much lower than in the non-rotating models and results in much lower [Ce/Y] ratios. These are not seen in the bulk of the Ba stars, which indicates that strong mixing within the13C pocket of their AGB companions should not occur.
Rotating models for the metallicity range of the Ba star sam- ple plotted in Fig.7 are not yet available for masses different from 1.5M. For stars of masses up to 3M several rotating models have been published at solar metallicity: 2Mstars by Piersanti et al. (2013), and 3M stars by Herwig et al. (2003) andSiess et al. (2004). While the different codes differ in the details of the final results, the qualitative result is the same as
−0.8
−0.6
−0.4
−0.2 0 0.2 0.4 0.6 0.8 1 1.2 1.4
−1.4 −1.2 −1 −0.8 −0.6 −0.4 −0.2 0 0.2
[Ce/Y]
[Fe/H]
1.5 MO. FRUITY, IRV=0 km/s 1.5 M
O. FRUITY, IRV=60 km/s
Fig. 7.Comparison for [Ce/Y] between the Ba stars and 1.5Mrotating and non-rotating (IRV=initial rotational velocity) FRUITY models that achieve [s/Fe]>0.25. The dots without error bars represent stars for which there are less than 3 lines for one of the elements.
for the 1.5M model plotted in Fig. 7: rotation decreases the efficiency of the 13C neutron source and, in turn, the [Ce/Y]
ratio. Furthermore, as mentioned above, stars of mass above 1.5M are observed to have initial rotational velocities above 100 km s−1, and, for a given set of model inputs, the effect of rotational mixing increases with the IRV (Piersanti et al. 2013).
Also asteroseismology observations of the slow down of the core of giant stars and of the rotational velocities of WDs extend to stars of initial mass 2.5–3M(Mosser et al. 2012;Hermes et al.
2017;Gehan et al. 2018). We derive that in this range of mass our conclusion holds.
In contrast, asteroseismologic evidence is not readily avail- able on the evolution of the angular momentum in giant stars of mass above 3M. These are relatively rare in theKeplerfield of view (Hekker et al. 2011) because of the initial mass func- tion, their shorter red giant phase (<100 Myr), and the fact that the field of view was shifted out of the Galactic plane. One classical Cepheid in theKeplerfield (V1154 Cyg,Derekas et al.
2017) has an estimated mass of 4.5M. However, we do not see solar-like oscillations in this star probably because the large-amplitude violent pulsations hamper the development of observable turbulence-driven oscillations in the thin convective layers. Among the sample of Hermes et al.(2017), only three WDs have progenitor masses between 3 and 4M. The most mas- sive rotates faster than any other pulsating WDs. This may indi- cate a link between higher mass and faster rotation, but more data are required to confirm this trend. In this mass range above 3M, models for the sprocess including stellar rotation are also still missing.
However, based on the nucleosynthesis evidence detailed below, we can conclude that AGB stars with initial masses much higher than 3Mcannot be responsible for the bulk of the Ba stars observations. First, both observations (García-Hernández et al.
2013) and models (Goriely & Siess 2004;Cristallo et al. 2015b) show that the importance of the 13C neutron source decreases with the stellar mass. In fact, the FRUITY models of 4 and 5M also presented in this work do not produce enough s- process enhancements to cover the bulk of the Ba stars obser- vations (see Fig.5). Second, the22Ne source can be more signif- icantly activated in these models and help reaching the required s-process enhancements (for example, as in the 4 and 4.5M
Monash models presented), however, as discussed above, this
neutron source results in high neutron densities and the efficient production of Rb, with [Rb/Zr] and [Rb/Y] ratios always above
−0.25 dex (see Tables1 and2). This is in contrast with obser- vations, which show that Ba stars have [Rb/Zr] and [Rb/Y] <
−0.4; see Fig. 7 of Abia & Wallerstein (1998), Sect. 6.2 of Busso et al. (1999), and Fig. 18 of Karinkuzhi et al. (2018b).
Observations of massive AGB stars have confirmed that these stars in fact produce Rb (García-Hernández et al. 2006,2009), although a quantitative mismatch with the models is still present (van Raai et al. 2012; Karakas et al. 2012) and currently being investigated (Pérez-Mesa et al. 2017).
A braking mechanism to slow down the core is already urgently looked for on the basis of the asteroseismology data (Eggenberger et al. 2017). Magnetic field (Cantiello et al.
2014), gravity waves (Fuller et al. 2014), and mixed modes, i.e.
g-modes excited in the core coupled to p-modes present in the atmosphere (Belkacem et al. 2015) have been considered so far as possibilities. It could be stressed that a lower injec- tion of initial angular momentum may improve the situation.
However, Piersanti et al. (2013) already demonstrated that the introduction of a strong coupling between core and envelope prior to the AGB phase (needed to reproduce observations) would cancel any mixing induced by rotation. The observations of Ba stars provide an independent and complementary con- straint for the presence of a mechanism for transporting angu- lar momentum. Further, they indicate that such a mechanism should transport the angular momentum, but not the chemical species.
5. Conclusions
Based on the large (169 stars) data set of observations of s-process elements in Ba stars of deC16, we have performed a new comparison between data and model predictions includ- ing calculation of more accurate error bars for the ratios of hs elements (Ce and Nd, belonging to the second s-process peak) to ls elements (Y and Zr, belonging to the firsts-process peak).
We compared the results to two sets of models (FRUITY and Monash) for the sprocess in the AGB star of masses between 1.5 and 4M and [Fe/H] between 0 and−1.2 believed to have transferred thes-process elements onto the companion Ba star.
Our main results are as follows:
1. In our analysis we excluded La because we found that the La abundance may be overestimated in some Ba stars. The [La/Fe] ratios reaches up to'2.5 dex, well above the [Ce/Fe]
and [Nd/Fe] ratios, where La, Ce, and Nd all belong to the second peak of the s-process elements and are necessarily produced by a similar factor. The fact that very strong La lines are present in the sample spectra makes the abundance determination of La in these stars unreliable.
2. All the computed ratios [Ce/Y], [Ce/Zr], [Nd/Y], and [Nd/Zr] show a clear trend of increasing with decreasing the stellar metallicity. This is in very good agreement with the models, and confirms that the main neutron source in AGB stars, the13C nuclei in the13C pocket, are of primary origin, i.e. their abundance is independent of the metallicity of the star.
3. At any given metallicity a spread of roughly a factor of 3 is shown by the data. This could be explained by a variety of processes (related for example to the stellar mass, over- shoot, rotation, and magnetic fields), however, the uncertain- ties are currently too large to allow us to identify which of these effects plays the main role.
![Fig. 1. [La/Fe], [Ce/Fe], and [Nd/Fe] values for the 169 sample stars showing the difference between the individual [hs/Fe] abundances.](https://thumb-eu.123doks.com/thumbv2/9dokorg/1390517.115506/3.892.467.826.122.380/fig-values-sample-stars-showing-difference-individual-abundances.webp)
![Fig. 2. [Ce/Y] values for the 169 sample stars. The dots without error bars represent stars for which there are less than 3 lines for one of the elements](https://thumb-eu.123doks.com/thumbv2/9dokorg/1390517.115506/4.892.69.430.121.381/values-sample-stars-error-represent-stars-lines-elements.webp)
![Table 1. FRUITY models that achieve [s/Fe] > 0.25 at the stellar surface in the metallicity range relevant to Ba stars, computed without rotation.](https://thumb-eu.123doks.com/thumbv2/9dokorg/1390517.115506/5.892.105.785.155.925/fruity-achieve-stellar-surface-metallicity-relevant-computed-rotation.webp)
![Fig. 3. [Ce/Y] ratio vs. [Fe/H] at the stellar surface at the end of the evolution from all the FRUITY models with [s/Fe] > 0.25 reported in Table 1](https://thumb-eu.123doks.com/thumbv2/9dokorg/1390517.115506/6.892.461.828.123.380/ratio-stellar-surface-evolution-fruity-models-reported-table.webp)
![Fig. 5. [Ce/Y] ratios plotted against the average enhancements of the two elements for the Ba stars and the final surface composition a selec-tion of models with the indicated stellar masses](https://thumb-eu.123doks.com/thumbv2/9dokorg/1390517.115506/8.892.65.430.530.787/plotted-average-enhancements-elements-surface-composition-indicated-stellar.webp)
![Fig. 7. Comparison for [Ce/Y] between the Ba stars and 1.5 M rotating and non-rotating (IRV = initial rotational velocity) FRUITY models that achieve [s/Fe] > 0.25](https://thumb-eu.123doks.com/thumbv2/9dokorg/1390517.115506/10.892.68.432.123.385/comparison-rotating-rotating-initial-rotational-velocity-fruity-achieve.webp)