Advance Access publication 2018 October 24
Wandering near the red edge: photometric observations of three cool ZZ Ceti stars
Zs. Bogn´ar,
1M. Papar´o,
1A. S´odor, ´
1D. I. Jenei,
2Cs. Kalup,
1,3E. Bertone,
4M. Chavez-Dagostino,
4M. H. Montgomery,
5A. Gy˝orffy, ´
2L. Moln´ar,
1,6H. Oll´e,
2P. I. P´apics,
7E. Plachy
1,6and E. Vereb´elyi
11Konkoly Observatory, MTA Research Centre for Astronomy and Earth Sciences, Konkoly Thege Mikl´os ´ut 15-17, H–1121 Budapest, Hungary
2Visiting astronomer at Konkoly Observatory
3Department of Astronomy, E¨otv¨os University, Pf. 32, 1518, Budapest, Hungary
4Instituto Nacional de Astrof´ısica, ´Optica y Electr´onica, Luis Enrique Erro 1, CP 72840, Tonantzintla, Puebla, Mexico
5University of Texas at Austin, 2515 Speedway, Stop C1400, Austin, TX 78712-1205, USA
6MTA CSFK Lend¨ulet Near-Field Cosmology Research Group, Konkoly Observatory, MTA Research Centre for Astronomy and Earth Sciences, Konkoly Thege Mikl´os ´ut 15-17, H–1121 Budapest, Hungary
7Instituut voor Sterrenkunde, KU Leuven, Celestijnenlaan 200D, B-3001 Leuven, Belgium
Accepted 2018 October 22. Received 2018 October 19; in original form 2018 August 23
A B S T R A C T
We summarize our findings on three cool ZZ Ceti type pulsating white dwarfs. We determined eight independent modes in HS 0733+4119, of which seven are new findings. For GD 154, we detected two new eigenmodes, and the recurrence of the pulsational behaviour first observed in 1977. We discuss that GD 154 does not only vary its pulsations between a multiperiodic and a quasi-monoperiodic phase, but there are also differences between the relative amplitudes of the near-subharmonics observed in the latter phase. In the complex pulsator, Ross 808, we compared the pre- and post Whole Earth Telescope campaign measurements, and determined two new frequencies besides the ones observed during the campaign. Studying these stars can contribute to better understanding of pulsations close to the empirical ZZ Ceti red edge. All three targets are in that regime of the ZZ Ceti instability strip where short-term amplitude variations or even outbursts are likely to occur, which are not well-understood theoretically.
Key words: techniques: photometric – stars: individual: HS 0733 +4119, GD 154, Ross 808 – stars: oscillations – white dwarfs.
1 I N T R O D U C T I O N
White dwarfs represent the final evolutionary stage of initially low- to intermediate-mass stars (∼97 per cent of all stars in the Universe).
By the investigation of their interiors, we can find the clue to the previous steps of stellar evolution, use them as cosmic laboratories, and measure the age of the stellar population they are belonging to.
Some of them show light variations on time scales of minutes. We can find them in well-defined regions of the Hertzsprung–Russell diagram, and they can be classified in three major groups: DAV (ZZ Ceti), DBV (V777 Her) and GW Vir stars. The most populous one is that of ZZ Ceti;∼80 per cent of the known pulsating white dwarfs belong to this group. Contrary to DBVs and GW Vir stars, ZZ Ceti stars have a thin hydrogen layer above the helium one. These stars have some hydrogen left in spite of the effective mass-loss processes that occurred on the asymptotic giant branch.
E-mail:bognar@konkoly.hu
ZZ Ceti stars are short-period and low-amplitude pulsators with 10 500–13 000 K effective temperatures. Their light variations are caused by non-radialg-mode pulsations with periods in the 100–
1500 s range, typically with∼mmag amplitudes. It has been known for decades that ZZ Ceti stars close to the blue edge of the instability strip show different pulsational behaviour than their cooler siblings in the middle of the ZZ Ceti instability domain or close to its red edge. While we can detect a few small-amplitude eigenmodes at the hottest ZZ Cetis, the cooler variables are more likely to show a larger number of pulsation modes with higher amplitudes. There are also differences in their temporal pulsational behaviour, as the cool ZZ Cetis often show frequencies with variable amplitudes and phases in short time scales (days–weeks), while the pulsation of hotter ones is more stable (Goldreich & Wu1999). We also note the observations of the so-called outburst events, which means recurring increases in the stellar flux (up to 15 per cent) in cool ZZ Ceti stars (see e.g.
Bell et al.2017).
The pulsation periods of variable stars are sensitive to the global stellar structure, rotation, and internal chemical stratification.
C2018 The Author(s)
Downloaded from https://academic.oup.com/mnras/article-abstract/482/3/4018/5144232 by guest on 10 September 2019
However, for the in-depth asteroseismic investigations, the precise determination of as many eigenmodes as possible is needed. This motivated us in the selection of our targets: we focused on cool ZZ Ceti stars with the possibility of showing rich frequency spec- tra and amplitude variations or even outbursts. Assuming that the global structure of the star does not change on time-scales as short as the amplitudes of the excited frequencies, we observe a subset of the possible eigenmodes during one observing run. However, we can complement the list of significant frequencies with obser- vations at different epochs. That is, more observations provide a more complete sampling of the pulsation modes for asteroseismic analysis.
The outburst phenomenon might be in connection with the ces- sation of pulsations at the empirical red edge of the ZZ Ceti in- stability strip (Hermes et al.2015), which mechanism is still an open question from the theoretical point of view. It is also not well-understood how and why exactly the pulsation amplitudes vary in short time-scales if these phenomena are not results of insufficient frequency resolution of the data sets. Possible expla- nations are interactions of pulsation and convection (e.g. Mont- gomery et al.2010), and resonant mode couplings (e.g. in Zong et al.
2016).
According to the ground-based observations and the measure- ments with the Kepler space telescope, we can distinguish five stages of the cooling of the ZZ Ceti stars (Hermes et al.2017). (1) The stars show short-period (100–300 s), low-amplitude (∼1 mmag) low-radial-order pulsations at the blue edge of the instability strip.
(2) At a few hundred degrees cooler stage, the periods are still short, but the pulsation amplitudes rise up to∼5 mmag, and some modes are stable enough to investigate evolutionary period changes. (3) In the middle of the instability strip, we find the pulsators with the highest amplitudes, often showing several nonlinear combina- tion frequencies in their Fourier spectrum. In some cases, short- term amplitude and frequency variations emerge. (4) As the stars cool further, they may show irregularly recurring outbursts. (5) We can find the longest pulsation periods amongst the coolest ZZ Ceti stars, and as we reach the edge of the instability do- main, their amplitudes decrease. For a short explanation why the cooler ZZ Cetis show longer pulsation periods, see e.g. Clemens (1993).
We selected three stars for observations, situated at the cool part of the instability strip: HS 0733 + 4119 (Section 3), an object with known pulsation modes only by its discovery runs; GD 154 (Section 4), a relatively well-studied star that exhibited different pulsation behaviours in the past; and Ross 808 (Section 5), a star that had been targeted by an international campaign earlier, but we collected a significant amount of additional data before and after the campaign’s observing window, giving us the chance to compare its pulsation behaviour at different epochs.
In general, the more precise pulsation frequencies lead to more reasonable asteroseismic modelling results. Our goal is to investi- gate as many stars as possible for this purpose. This way we can get a more detailed picture on the ZZ Ceti stars as a whole group.
Moreover, besides the space observations, ground-based measure- ments obtained at different epochs also play an important role in the investigations of temporal pulsation variations over different time-scales. All three of our targets are in that regime of the ZZ Ceti instability strip where short-term amplitude variations or even outbursts are likely to occur (see Section 6), which are not well- understood theoretically. Studying these stars can contribute to bet- ter understanding of pulsations close to the empirical ZZ Ceti red edge.
2 O B S E RVAT I O N S , DATA R E D U C T I O N , A N D A N A LY S I S
We performed the observations with the 1-m Ritchey–Chr´etien–
Coud´e telescope located at the Piszk´estet˝o mountain station of Konkoly Observatory, Hungary. The measurements were made either with a Princeton Instruments VersArray:1300B back- illuminated CCD camera or with an Andor iXon+888 EMCDD in white light. We used either 10 or 30 s exposure times, depending on the weather conditions. The read-out time was∼3 s for the Ver- sArray:1300B camera, while it was negligible thanks to the frame transfer mode in the case of the iXon+888 EMCDD. In the case of GD 154, we utilized additional data from other observatories, described in Section 4.
Raw data frames were treated as the standard way utilizingIRAF1
tasks: we performed bias, dark and flat corrections before the aper- ture photometry of field stars. After photometry, we fitted low-order (second- or third-order) polynomials to the resulting light curves, correcting for long-period atmospheric and instrumental effects.
This procedure did not affect the known frequency domain of pul- sating ZZ Ceti stars; however, this detrending could make the de- tection of any possible outburst events difficult or even impossible.
The comparison stars for the differential photometry were checked for variability and instrumental effects. Then, we converted the ob- servational times of every data point to barycentric Julian dates in barycentric dynamical time (BJDTDB) using the applet of Eastman, Siverd & Gaudi (2010).2
We analysed the daily measurements with the command-line light-curve fitting program LCFIT(S´odor2012). LCFIThas linear (amplitudes and phases) and nonlinear (amplitudes, phases and fre- quencies) least-squares fitting capabilities, utilizing an implemen- tation of the Levenberg–Marquardt least-squares fitting algorithm.
The program can handle unequally spaced and gapped data sets and is easily scriptable.
We performed standard Fourier analyses on the weekly–monthly and whole data sets with the photometry modules of the Frequency Analysis and Mode Identification for Asteroseismology (FAMIAS) software package (Zima2008). We accepted a frequency peak as significant if its amplitude reached the four signal-to-noise ratio (S/N), where noise level was determined by the average Fourier amplitude in a 1700μHz radius vicinity of the peak in question. We chose this smoothing radius somewhat arbitrarily, but taking into account the structure of the central peak of the window function, the spectral resolution, and the rate of the background spectral-noise variation.
3 H S 0 7 3 3 +4 1 1 9
HS 0733 + 4119 (g = 15.8 mag, α2000 = 07h37m08s, δ2000= +41d12m28s) is a known pulsator. Its light variations were detected by Voss et al. (2007). They determined three pulsation peri- ods at 747.4, 656.2, and 468.8 s. No further time-series observations of the star can be found in the literature.
We observed HS 0733+4119 on 12 nights between 2017 January and April. Table1shows the journal of observations.
We analysed independently both the daily data sets and the weekly data. Finally, we performed the Fourier analysis of the whole
1IRAFis distributed by the National Optical Astronomy Observatories, which are operated by the Association of Universities for Research in Astronomy, Inc., under cooperative agreement with the National Science Foundation.
2http://astroutils.astronomy.ohio-state.edu/time/utc2bjd.html
Downloaded from https://academic.oup.com/mnras/article-abstract/482/3/4018/5144232 by guest on 10 September 2019
Table 1. Log of observations on HS 0733+4119. ‘Exp’ is the integration time used,Nis the number of data points, andδTis the length of the data sets including gaps. Weekly observations are denoted by ‘a,b,c,d’ letters in parentheses.
Run UT date Start time Exp. N δT
(2017) (BJD-2 450 000) (s) (h)
01(a) Jan 19 7773.305 10 3026 8.58
02(a) Jan 22 7776.411 10 2352 6.68
03(b) Jan 26 7780.235 10 3358 10.60
04(b) Jan 27 7781.213 10 6181 11.22
05(b) Jan 28 7782.214 10 7203 11.02
06(c) Feb 19 7804.415 30 274 2.31
07(c) Feb 21 7806.358 10 1759 6.04
08(c) Feb 23 7808.338 10 486 1.51
09(c) Feb 25 7810.226 10 2703 8.21
10(c) Feb 26 7811.473 10 1250 3.79
11(d) Apr 01 7845.277 10 1282 3.69
12(d) Apr 02 7846.264 10 858 2.77
Total: 30 732 76.42
Table 2. HS 0733+4119: list of finally accepted frequencies by the whole data set. The frequencies are listed in the order of the pre-whitening proce- dure. The errors are formal uncertainties, and are estimated to be∼0.3 mmag in amplitudes. We discuss the influence of the 1 d−1aliasing on the frequency determination in Section 6.
f P Ampl. Phase Comment
[μHz] [s] [mmag] [2π]
f1 2111.580(2) 473.6 15.6 0.66
f2 1541.240(2) 648.8 13.1 0.45
f3 1153.553(2) 866.9 12.4 0.24
f4 1421.949(3) 703.3 7.5 0.32
f5 1235.346(5) 809.5 4.9 0.92
f6 2131.800(6) 469.1 4.7 0.65
f7 1265.321(8) 790.3 3.3 0.58
f8 1585.624(7) 630.7 3.9 0.01
f9 570.690(7) 1752.3 3.4 0.45 f1−f2
f10 954.179(7) 1048.0 3.8 0.79 ∼f1−f3
f11 379.830(9) 2632.8 2.8 0.67 ∼f2−f3
f12 2705.945(21) 369.6 2.7 0.24 ∼f2+f3
f13 2316.714(10) 431.6 2.7 0.57 ∼2f3
f14 3652.825(10) 273.8 2.6 0.22 f1+f2
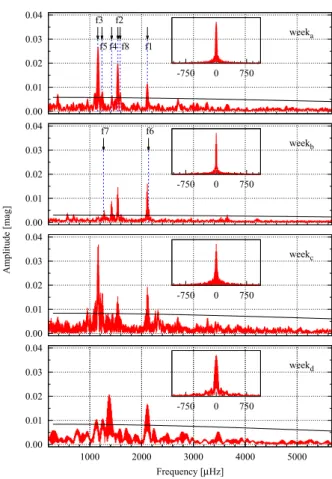
data set. To be rigorous in our frequency determination, we accepted a frequency if it was found to be significant at least on one night, in one weekly data set and in the whole data as well. We summarized the finally accepted 14 frequencies in Table2. Note that there are ad- ditional significant peaks in the Fourier transform of the whole data set, mostly closely spaced ones to the frequencies listed in Table2, but these most likely emerge as results of short-term amplitude or phase variations. Fig.1clearly presents the remarkable amplitude variations from one week to another.
We also checked the closely spaced peaks to any kind of reg- ularities (e.g. doublets, triplets), which may emerge as results of rotational splitting of frequencies, but we found no convincing re- curring frequency spacings.
As Table2shows, we identified six combination peaks out of the 14 frequencies. The remaining eight peaks seem to be independent pulsation modes. Comparing our period list with the one presented by Voss et al. (2007),f6is a common period (469.1 versus 468.8 s), but the status of the other two periods of Voss et al. (2007) at 656.2 and 747.4 s is questionable. These either emerge in our data
0.00 0.01 0.02 0.03 0.04
weeka f1
f2 f3
f4 f5 f8
-750 0 750
0.00 0.01 0.02 0.03 0.04
weekb f6
f7
-750 0 750
0.00 0.01 0.02 0.03 0.04
weekc
-750 0 750
0.00 0.01 0.02 0.03 0.04
weekd
-750 0 750
1000 2000 3000 4000 5000
Frequency [μHz]
Amplitude [mag]
Figure 1. Fourier transforms of the weekly data sets obtained on HS 0733 +4119. Note the remarkable amplitude variations from week to week. The longest observational runs were performed during the second week. The window functions are given in the insets. We also denote the 4A significance levels (black lines), and mark the frequenciesf1−f8of Table2 (cf. Fig.2), respectively.
set at 648.8 and 703.3 s (f2 and f4), respectively, or considering the relatively large separations between our and the Voss et al.
(2007) measurements, these two periods published in 2007 are also independent ones, and were not excited to an observable level at the time of our measurements.
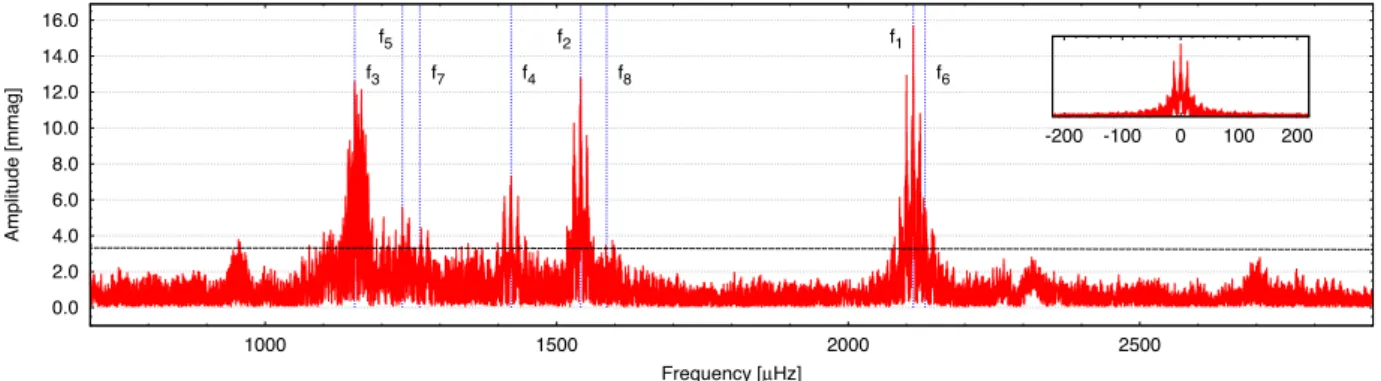
Appendices A1 and B1show the daily light curves and their Fourier transforms, respectively. We plotted the Fourier transform of the whole data set in Fig.2and denoted the eight independent frequencies.
4 G D 1 5 4
GD 154 (V=15.3 mag,α2000=13h09m58s,δ2000= +35d09m47s) is a well-studied ZZ Ceti star; it was the target of both multisite cam- paigns and single-site observations. It was found to be a variable in 1977, with one dominant frequency at 843μHz and its harmonic and near-subharmonic peaks (Robinson et al.1978). Many years later, in 1991, it was selected to be a target of a Whole Earth Tele- scope (WET; Nather et al.1990) campaign. At that time, it showed three independent modes at 842.8, 918.6, and 2484.1μHz with their rotationally split components and combination frequencies, but peaks were not found around subharmonic frequencies (Pfeiffer et al.1996). During a two-site campaign organized in 2004, new ex- cited modes were detected at 786.5, 885.4, and 1677.7μHz (H¨urkal et al.2005). At last, results of extended single-site observations from
Downloaded from https://academic.oup.com/mnras/article-abstract/482/3/4018/5144232 by guest on 10 September 2019
0.0 2.0 4.0 6.0 8.0 10.0 12.0 14.0 16.0
1000 1500 2000 2500
Amplitude [mmag]
Frequency [μHz]
f1 f2
f3 f4
f5
f6
f7 f8
-200 -100 0 100 200
Figure 2. Fourier transform of the whole data set obtained on HS 0733+4119. The frequencies which can be regarded as independent pulsation frequencies are marked with blue dashed lines (cf. Table2). The window function is given in the inset, while black line denotes the 4Asignificance level.
Table 3. Log of observations on GD 154. ‘Exp’ is the integration time used, Nis the number of data points andδTis the length of the data sets including gaps.
Run UT date Start time Exp. N δT
(BJD-2 450 000) (s) (h)
Konkoly Obs. (2012)
01 Jan 27 5953.509 30 517 4.67
02 Jan 28 5954.619 30 249 2.24
03 Jan 30 5956.509 30 542 4.91
04 Jan 31 5957.624 30 237 2.15
05 Feb 01 5958.505 30 549 4.92
06 Feb 20 5978.445 30 344 3.16
07 Feb 21 5979.450 30 593 5.82
08 Feb 22 5980.449 30 598 5.34
Total: 3 629 33.21
McDonald Obs. (2005)
01 May 10 3500.620 10 733 2.03
02 May 12 3502.611 10 393 1.10
03 May 13 3503.756 10 948 2.64
Total: 2 074 5.77
McDonald Obs. (2007)
01 Apr 20 4210.671 15 1083 4.61
02 Apr 21 4211.597 15 2243 9.40
03 Apr 22 4212.729 15 2380 6.22
04 Apr 24 4214.597 15 2165 9.36
05 Apr 25 4215.610 10 915 3.04
06 Apr 26 4216.595 10 1003 2.81
07 Apr 28 4218.611 10 906 2.51
Total: 10 695 37.96
Guillermo Haro Astrophysical Obs. (2011)
01 Mar 09 5629.925 70 115 2.41
02 Mar 10 5630.921 70 119 2.67
03 Mar 11 5631.914 70 128 2.98
Total: 362 8.06
2006 were published by Papar´o et al. (2013). They determined six normal modes, two of which, at 807.62 and 861.56μHz, were new detections.
We continued the observations of this star and obtained data on eight nights in 2012. Table3shows the journal of these observations, while AppendicesC1andD1present the daily light curves and their Fourier spectra, respectively.
As the frequency analyses of both the daily and the whole data sets show, we observed a pulsation behaviour very similar to what was seen in 1977. We list the frequencies obtained by the whole
Table 4. GD 154: frequencies determined by the whole data set obtained in 2012. The frequencies are listed in the order of the pre-whitening procedure.
The errors are formal uncertainties, and are estimated to be∼0.2 mmag in amplitudes. We discuss the influence of the 1 d−1aliasing on the frequency determination in Section 6.
f P Ampl. Phase Comment
[μHz] [s] [mmag] [2π]
f1 843.565(1) 1185.4 27.5 0.10 Indep. mode
f2 1687.127(4) 592.7 8.9 0.02 2f1
f3 1300.112(4) 769.2 7.0 0.55 1.54f1
f4 2530.697(6) 395.1 4.5 0.58 3f1
f5 2143.691(9) 466.5 3.2 0.93 2.54f1
f6 3374.273(9) 296.4 3.0 0.16 4f1
f7 2483.949(10) 402.6 2.7 0.52 Indep. mode
f8 2987.270(11) 334.8 2.5 0.37 3.54f1
f9 819.564(15) 1220.2 2.1 0.74 Indep. mode?
f10 3830.358(16) 261.1 1.7 0.13 4.54f1
f11 4217.868(16) 237.1 1.7 0.02 5f1
f12 1663.104(16) 601.3 2.0 0.19 f1+f9?
f13 456.481(19) 2190.7 1.5 0.22 0.54f1
f14 1130.461(19) 884.6 1.4 0.24 Indep. mode
f15 4673.908(22) 214.0 1.3 0.66 5.54f1
f16 3327.549(23) 300.5 1.2 0.63 f1+f7
f17 5061.389(30) 197.6 0.9 0.90 6f1
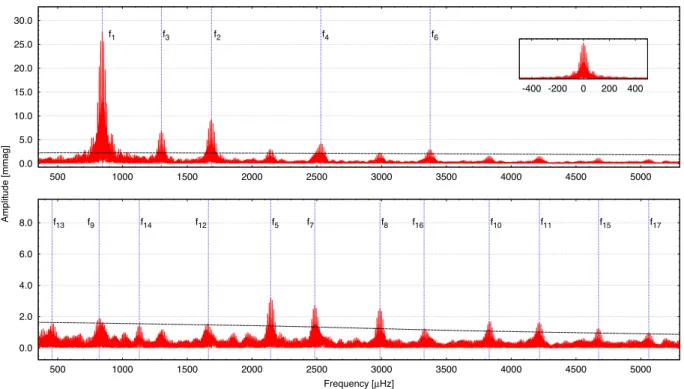
data set in Table 4. One frequency (f1=843.6μHz) dominates the Fourier transforms, while a series of harmonic (n×f1, where n = 2, 3, 4, 5, 6) and near-subharmonic peaks (m×f1, where m=0.54, 1.54, 2.54, 3.54, 4.54, 5.54) are clearly visible. How- ever, the light variations are not monoperiodic, that is, at least two more independent modes can be determined (f7=2483.9μHz and f14=1130.5μHz). The status of two peaks,f9=819.6μHz and f12=1663.1μHz, is questionable. Bothf9and f12 are similarly close (δf∼2d−1) to another peak,f1andf2, respectively, whilef2
(at 1687.1μHz) is the first harmonic off1. We see two possibilities here: (1)f9is an independent mode andf12=f1+f9, (2) the pres- ence off9is due to some kind of amplitude or phase modulation off1and it is reflected atf2as the peak off12. We plot the Fourier transform of the whole data set in Fig.3.
We also had the chance to follow the changes in the pulsation behaviour of this star examining measurements from three addi- tional epochs (2005, 2007, and 2011). We obtained data on GD 154 at the McDonald Observatory (McDO) with the 2.1-m Otto Struve Telescope through a BG40 filter in 2005 and 2007, respectively. The star was observed on three nights in 2005, and on seven nights in 2007, respectively. We also collected additional observations from
Downloaded from https://academic.oup.com/mnras/article-abstract/482/3/4018/5144232 by guest on 10 September 2019
0.0 5.0 10.0 15.0 20.0 25.0 30.0
500 1000 1500 2000 2500 3000 3500 4000 4500 5000
f1 f3 f2 f4 f6
0.0 2.0 4.0 6.0 8.0
500 1000 1500 2000 2500 3000 3500 4000 4500 5000
Amplitude [mmag]
Frequency [μHz]
f5 f7 f8
f9 f14 f12 f10 f11
f13 f16 f15 f17
-400 -200 0 200 400
Figure 3. Fourier transform of the whole 2012 data set obtained on GD 154. The frequencies of Table4are denoted by blue dashed lines. For the better visibility of the frequencies, we plot the Fourier spectrum after pre-whitening withf1,f2,f3,f4 andf6in the bottom panel. Black lines denote the 4A significance levels. The window function is given in the inset.
Table 5. GD 154: amplitudes and relative amplitudes of the dominant frequency, its first harmonic and the 1.54f1 peak, fitting the light curves with these frequencies only. Large variation in the amplitude of the near- subharmonic frequency can be detected.
Af1 A1.54f1 A2f1 A1.54f1/Af1 A1.54f1/A2f1 A2f1/Af1
[mmag] [%]
2005 23.1 – 8.6 – – 37.2
2007 25.0 2.6 9.1 10.4 28.6 36.4
2011 28.1 19.2 8.2 68.3 234.1 29.2
2012 27.7 7.1 9.3 25.6 76.3 33.6
2011 with the 2.1-m telescope at the Guillermo Haro Astrophysical Observatory (OAGH), Mexico, utilizing aBfilter. The star was ob- served on three consecutive nights. We included the journal of these observations in Table3, while the figures of AppendixE1show the corresponding light curves. We used frame transfer mode in the case of the McDO observations, while the read-out times were 7 s for the OAGH measurements.
The raw data frames of the OAGH observations were reduced the same way as the Konkoly measurements (see Section 2). The obser- vations performed at McDonald Observatory were treated similarly, the difference is that in this case we utilized the flux values instead of the magnitudes. Thus, the resulting normalized light curves show light variations represented as fractional intensity in modulation in- tensity (mi) units (see the top panels of AppendixE1). To convert the corresponding milli-modulation amplitudes (mma) of the Fourier transforms of the McDO light curves to milli-magnitude (mmag) values used in all the other cases, we applied the relationship as follows: 1 mma=1/1.086 mmag.
We summarized the eigenmodes of the data sets from 1977 to 2012 in Table6. We detected two new normal modes at 798.3 (2007) and 1130.5μHz (2012), respectively.
4.1 Near-subharmonics in the data sets
The star’s pulsation behaviour was similar to what was observed in 1977 and what we measured in 2007, 2011, and 2012, that is, one dominant mode and its harmonic and near-subharmonic peaks dominated the light variations. However, we note a remarkable difference: in 2011, the second highest amplitude peak was at∼1.5f1
and not at the first harmonic of the dominant peak. Furthermore, there are no detectable peaks at the near-subharmonic frequency domains in the 2005 data set, leastways at∼5 mmag detection limit.
That is, the star does not only vary its pulsational behaviour between a ‘simple’ multiperiodic (see Pfeiffer et al. 1996, H¨urkal et al.
2005and Papar´o et al.2013) and a quasi-monoperiodic phase with harmonic and near-subharmonic peaks, but there are differences between the visibility of the near-subharmonics in this latter phase, too (see the relative amplitudes listed in Table5). This reminds us of the finding of Robinson et al. (1978), when the authors reported that the ∼1.5f1 peak became the dominant on the last night of their observations. This pulsational-behaviour change of GD 154 raises the question: what physical mechanism can cause such rapid nonlinear response in the star?
Similarly to the 2012 observations, both in the 2007 and 2011 data sets the near-subharmonic peaks appeared atm×f1, where m = 1.54, 2.54, 3.54 (2007) orm= 1.54, 2.54 (2011). Robin- son et al. (1978) reported 1.52, 2.53, and 3.53Ffrequencies. This means that there is a clear and consistent shift from the real sub- harmonic frequencies expected at n/2 × fx, where n is an odd integer.
The near-subharmonic frequencies resemble the pulsational be- haviour observed in other white dwarf variables, e.g. in the DBV star PG 1351+489 (Goupil, Auvergne & Baglin1988) and in the ZZ Cetis G191-16 (Vauclair et al.1989) and BPM 31594 (O’Donoghue, Warner & Cropper1992). In BPM 31594, a similar (1.54 ± n)f near-subharmonic frequency set was detected. However, the
Downloaded from https://academic.oup.com/mnras/article-abstract/482/3/4018/5144232 by guest on 10 September 2019
Table 6. GD 154: normal modes from different epochs. ‘H’, ‘SH’, ‘C’ and ‘R’ refer to that harmonic, near-subharmonic, combination (including harmonic) or rotationally split peaks were reported at the given data set.
Year Frequency Comm. Reference
(μHz)
1977 843.1 H,SH Robinson et al. (1978)
1991 842.8 918.6 2484.1 C,R Pfeiffer et al. (1996)
2004 786.5 885.4 1677.7 2484.3 C,R H¨urkal et al. (2005)
2005 843.2 888.6 2480.1 H This work: McDO
2006 807.6 839.1 861.6 883.6 918.7 2484.1 C,R Papar´o et al. (2013)
2007 798.3 843.3 2483.8 H,SH This work: McDO
2011 844.0 H,SH This work: OAGH,
Mexico
2012 843.6 1130.5 2483.9 C,SH This work: Konkoly Obs.
0 10 20 30
2005
0 10 20 30
f=798.3 2007
0 10 20 30
2011
0 10 20 30
2012
f=1130.5
1000 2000 3000 4000 5000
Frequency [μHz]
f=1130.5
-750 0 750
-750 0 750
-750 0 750
-750 0 750
Amplitude [mmag]
Figure 4. Fourier transforms of the whole data sets of the 2005, 2007, 2011 and 2012 measurements of GD 154. Note the remarkable amplitude variations of the near-subharmonic peaks from one epoch to another (cf.
Table5). Black lines denote the 4Asignificance levels, while the window functions are given in the insets. We also mark the two newly detected eigenmodes (cf. Table6). Note that these peaks are clearly visible and significant after pre-whitening with the larger-amplitude peaks.
authors emphasized that considering the observations of these near- subharmonics as signs of period doubling is wrong: there is a clear frequency shift between the expected real (1.5±n)fsubharmonic and the observed (1.54±n)fnear-subharmonic peaks. Nevertheless, this phenomenon could still indicate some non-linear interaction or coupling between certain modes in the star.
Fig. 4 shows the Fourier transforms of the 2005, 2007, and 2011 observations together with the 2012 measurement at Konkoly Observatory.
5 R O S S 8 0 8
The light variations of Ross 808 (hereafter R 808;V=14.4 mag, α2000=16h01m23s,δ2000= +36d48m34s) was discovered in 1975.
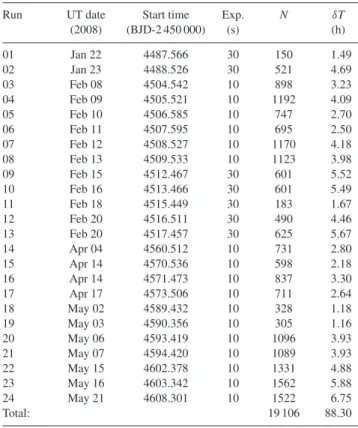
Table 7. Log of observations on R 808. ‘Exp’ is the integration time used, Nis the number of data points andδTis the length of the data sets including gaps.
Run UT date Start time Exp. N δT
(2008) (BJD-2 450 000) (s) (h)
01 Jan 22 4487.566 30 150 1.49
02 Jan 23 4488.526 30 521 4.69
03 Feb 08 4504.542 10 898 3.23
04 Feb 09 4505.521 10 1192 4.09
05 Feb 10 4506.585 10 747 2.70
06 Feb 11 4507.595 10 695 2.50
07 Feb 12 4508.527 10 1170 4.18
08 Feb 13 4509.533 10 1123 3.98
09 Feb 15 4512.467 30 601 5.52
10 Feb 16 4513.466 30 601 5.49
11 Feb 18 4515.449 30 183 1.67
12 Feb 20 4516.511 30 490 4.46
13 Feb 20 4517.457 30 625 5.67
14 Apr 04 4560.512 10 731 2.80
15 Apr 14 4570.536 10 598 2.18
16 Apr 14 4571.473 10 837 3.30
17 Apr 17 4573.506 10 711 2.64
18 May 02 4589.432 10 328 1.18
19 May 03 4590.356 10 305 1.16
20 May 06 4593.419 10 1096 3.93
21 May 07 4594.420 10 1089 3.93
22 May 15 4602.378 10 1331 4.88
23 May 16 4603.342 10 1562 5.88
24 May 21 4608.301 10 1522 6.75
Total: 19 106 88.30
At that time, one stable frequency was determined at around 1200μHz, while the authors mentioned a complex, variable power spectrum of this star (McGraw & Robinson1976). Decades later, Castanheira & Kepler (2009) presented new observations of R 808.
They identified eight frequencies at 926.7, 1045.5, 1101.8, 1139.1, 1255.8, 1342.1, 1955.8, and 2472.2μHz. In the meantime, R 808 was selected to be a target of a WET campaign performed in 2008 (Thompson et al. 2009). This resulted in the detection of 28 fre- quencies, including linear combinations and closely spaced peaks, which may emerge as the results of rotational splitting of frequen- cies (Bischoff-Kim2009).
We observed R 808 on 24 nights also in 2008. We joined the WET campaign mentioned above and observed in the frame of this multisite collaboration on four nights in April. Otherwise, most of our data were collected before (in January and in February) and after the WET observations (in May), see the details in Table7.
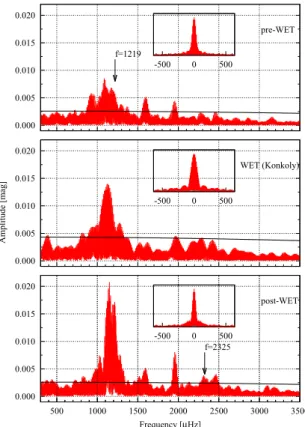
The Fourier transforms of the pre- and post-WET observations,
Downloaded from https://academic.oup.com/mnras/article-abstract/482/3/4018/5144232 by guest on 10 September 2019
0.000 0.005 0.010 0.015 0.020
pre-WET f=1219
0.000 0.005 0.010 0.015 0.020
WET (Konkoly)
0.000 0.005 0.010 0.015 0.020
post-WET
f=2325
500 1000 1500 2000 2500 3000 3500
Frequency [μHz]
-500 0 500
-500 0 500
-500 0 500
Amplitude [mag]
Figure 5. R 808: Fourier transforms of the pre- and post-WET measure- ments, and the observations obtained during the WET campaign. Black lines denote the 4Asignificance levels, while the window functions are given in the insets. We also mark the two newly detected frequencies at 1219 and 2325μHz.
and the ones obtained during the WET campaign, are plotted in Fig.5. Changes in the observed amplitudes and the complexity of the frequency structure in the∼900–1400μHz domain are clearly visible.
As the frequency content of R 808 has become known for the duration of the WET campaign, it made us wonder how this may vary compared to the pre- and post-WET observations; did any new frequencies emerge with which we can complete the WET list of frequencies? For this purpose, we linearly fitted the pre- and post-WET data sets with the frequencies determined by the whole WET data presented by Thompson et al. (2009), and checked the frequency content of the residual Fourier spectra, searching for any new eigenmodes for R 808. We also performed the independent Fourier analyses of the pre- and post-WET observations. Our strat- egy was to accept a significant frequency in the Fourier transform as a newly detected one if it was at least 1 d−1far from the WET frequencies. Applying this criterion, we tried to avoid accepting a closely spaced peak to a WET mode, which may emerge as the re- sult of non-stationary amplitudes and phases, or just the 1 d−1alias ambiguity of our single-site observations. Then we compared the results we obtained with these two methods, and searched for the common frequency solutions.
This way we identified two more frequencies using the pre- and post-WET data sets. These represent new findings addition- ally to the WET frequencies presented by Thompson et al. (2009).
These are at 1218.64(2)μHz – 821 s (pre-WET observations) and at 2325.22(2)μHz – 430 s (post-WET observations). Note that this latter peak is close to the first harmonic of F18 of Thompson et al.
(2009) (1162.48μHz); however, we did not find this parent fre- quency analysing of our post-WET observations. Thus, there is a
chance that this is only a coincidence caused by the large number of excited frequencies. The frequency values and their formal uncer- tainties are calculated from the averages of the frequencies derived by the two methods.
6 S U M M A RY A N D C O N C L U S I O N S
In this paper, we presented our findings on three cool ZZ Ceti stars observed mainly at Konkoly Observatory. We focused on the frequency analyses of the targets and put these into context of the previous publications on the targets.
In the rarely observed HS 0733+4119, we detected eight inde- pendent modes. With one exception, these modes seem to be new findings.
In the relatively well-studied GD 154, we detected two new eigenmodes at 798.3 and 1130.5μHz (cf. Table6). We also ob- served the recurrence of the pulsational behaviour first reported in 1977. Similarly to that found with this previous observation, one mode and its harmonic and near-subharmonic peaks dominated the light variations of the star in 2007, 2011 and 2012. We dis- cussed the differences between its pulsational behaviour observed in different epochs; we found that the star does not simply alter- nate its pulsation behaviour between a multiperiodic and a quasi- monoperiodic fashion with harmonic and near-subharmonic peaks, but there are also differences between the relative amplitudes of the near-subharmonics in this latter phase at different times. The phenomenon that harmonic and near-subharmonic peaks dominate the Fourier spectrum from time-to-time, while there are ‘simple’
multiperiodic intervals when they disappear, shows the importance of nonlinear effects in the star’s pulsation.
In Ross 808, which is a pulsator rich in frequencies and which shows complex light variations, we compared the pre- and post- Whole-Earth-Telescope campaign measurements, and determined two new frequencies besides the ones observed during the campaign.
Considering the reliability of the frequency determinations of the presented ground-based observations, we concluded the fol- lowing points. The largest uncertainties come from the presence of the 1 d−1 alias peaks in the Fourier spectra, that is, the real uncertainties can be±1 d−1 for the frequencies. However, in the case of HS 0733 +4119, we tested our frequency determination by the analyses of different data subsets (see Section 3), identi- fied combination terms, and found one common frequency with the previous observations. In GD 154, we analysed data sets from different epochs and found the parent modes and their harmonic and near-subharmonic peaks at very similar frequencies. In the case of R 808, we accepted the new frequencies by the analyses of data subsets with two different methods. These efforts and findings sig- nificantly lower the possibility that we confused a real pulsation frequency with a±1 d−1alias.
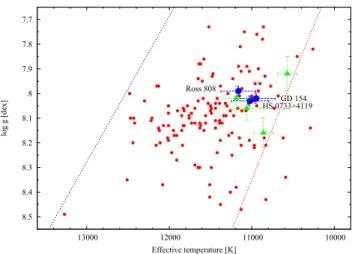
Fig.6shows the classical ZZ Ceti instability strip with all the known ZZ Ceti stars plotted (red filled dots) including the stars presented in this paper (blue dots with error bars). The atmospheric parameters of the ZZ Cetis are from the database of Bogn´ar & S´odor (2016) and from the Montreal White Dwarf Database (MWDD;
Dufour et al. 2017).3The pulsation properties of the three stars discussed in this paper are in good agreement with their location on the ZZ Ceti instability strip: they show complex temporal light variations and also relatively large amplitudes, which all correspond to stars evolving from the middle of the instability domain towards the red edge of the instability strip.
3http://dev.montrealwhitedwarfdatabase.org/home.html
Downloaded from https://academic.oup.com/mnras/article-abstract/482/3/4018/5144232 by guest on 10 September 2019
7.7
7.8 7.9
8
8.1 8.2
8.3
8.4
8.5
10000 11000
12000 13000
log g [dex]
Effective temperature [K]
GD 154 Ross 808
HS 0733+4119
Figure 6. The classical ZZ Ceti instability strip with plots of the known ZZ Ceti stars (red filled dots) including the stars presented in this paper (blue dots with error bars) and the four outbursting ZZ Cetis with published atmospheric parameters by Bell et al. (2017) (green triangles). Blue and red dashed lines denote the hot and cool boundaries of the instability strip, according to Tremblay et al. (2015).
However, considering the results ofKeplerobservations of cool ZZ Ceti stars, we can raise the question: do we see any signs of out- bursts in the light curves? As Bell et al. (2016,2017) have already indicated, it is possible that we smooth the average brightness in- creases of the outburst events out with the polynomial fitting method used to correct for the long-period extinction and instrumental ef- fects. However, we have the possibility to search for signs of changes in the stars’ pulsational behaviour, for example, the amplitudes of the excited modes change during an outburst.
The best candidate for an outbursting star seems to be GD 154, which shows remarkable features in its light curve. First, as we have mentioned already, it has two pulsational states: a quasi- monoperiodic one with one dominant frequency and its harmonic and near-subharmonic peaks, and a ‘simple’ multiperiodic state.
This is definitely a dramatic change in the star’s pulsational be- haviour. However, note that considering the time-scales, the star remains in the quasi-monoperiodic or the multiperiodic state much longer than the average duration of the outbursts (hours to about one day).
Another possibility that we consider is the light-curve features presented by Papar´o et al. (2013), section 3.2.3. One conspicu- ous feature that we cannot fit adequately with the frequency so- lutions derived for the data set at some high-amplitude, strongly non-sinusoidal intervals. These are about 0.1 d long parts of the light curve. The conclusion in Papar´o et al. (2013) was that it is possible that ‘some additional physical process is superimposed on the pulsation creating high-amplitude phases’.
Nevertheless, GD 154 and the other two stars are all in the do- main of the instability strip where outbursts were detected by the Keplerspace telescope – see Fig.6, where we plotted our three stars together with the four outburstingKeplerobjects with pub- lished effective temperatures and surface gravities. Fortunately, all three objects are on the list of short cadence targets proposed for TESS(Transiting Exoplanet Survey Satellite; Ricker et al.2015) observations. With those observations, we will have the opportu- nity to observe possible outburst phenomena by the uninterrupted measurements of the all-sky space project.
AC K N OW L E D G E M E N T S
The authors thank the anonymous referee for the constructive comments and recommendations on the manuscript. ´AS was sup- ported by the J´anos Bolyai Research Scholarship of the Hungarian Academy of Sciences, and he also acknowledges the financial sup- port of the Hungarian National Research, Development and Inno- vation Office (NKFIH) Grant K-113117. ´AS and ZsB acknowledge the financial support of the Hungarian NKFIH Grants K-115709 and K-119517. ZsB acknowledges the support provided from the National Research, Development and Innovation Fund of Hungary, financed under the PD 17 funding scheme, project no. PD-123910.
CsK acknowledges the financial support of the GINOP-2.3.2-15- 2016-00033 grant of the Hungarian National Research, Develop- ment and Innovation Office. MC and EB would like to thank finan- cial support from CONACyT through grants CB-2015-256961 and CB-2011-169554. LM and EP acknowledge the financial support of the Hungarian National Research, Development, and Innova- tion Office through the NKFIH Grants K-115709, PD-116175, and PD-121203; the LP2014-17, and LP2018-7/2018 Programs of the Hungarian Academy of Sciences, and they were also supported by the J´anos Bolyai Research Scholarship of the Hungarian Academy of Sciences. This project has been supported by the Lend¨ulet grant LP2012-31 of the Hungarian Academy of Sciences.
R E F E R E N C E S
Bell K. J. et al., 2016,ApJ, 829, 82
Bell K. J., Hermes J. J., Montgomery M. H., Winget D. E., Gentile Fusillo N. P., Raddi R., G¨ansicke B. T., 2017, in Tremblay P.-E., Gaensicke B., Marsh T., eds, ASP Conf. Ser. Vol. 509, 20th European White Dwarf Workshop, Astron. Soc. Pac. , San Francisc, p. 303
Bischoff-Kim A., 2009, in Guzik J. A., Bradley P. A., Stellar Pulsation:
Challenges for Theory and Observations, eds, AIP Conf. Ser. Vol. 1170, Am. Inst. Phys., New York, p. 621
Bogn´ar Z., S´odor A., 2016, Information Bull. Variable Stars, 62, 6184 Castanheira B. G., Kepler S. O., 2009,MNRAS, 396, 1709
Clemens J. C., 1993,Balt. Astron., 2, 407
Dufour P., Blouin S., Coutu S., Fortin-Archambault M., Thibeault C., Berg- eron P., Fontaine G., 2017, in Tremblay P.-E., Gaensicke B., Marsh T., eds, ASP Conf. Ser. Vol. 509, 20th European White Dwarf Workshop, Astron. Soc. Pac., San Francisco, p. 3
Eastman J., Siverd R., Gaudi B. S., 2010,PASP, 122, 935 Goldreich P., Wu Y., 1999,ApJ, 511, 904
Goupil M. J., Auvergne M., Baglin A., 1988, A&A, 196, L13 Hermes J. J. et al., 2015,ApJ, 810, L5
Hermes J. J. et al., 2017,ApJS, 232, 23
H¨urkal D. ¨O., Handler G., Steininger B. A., Reed M. D., 2005, in Koester D., Moehler S., eds, ASP Conf. Ser. Vol. 334, 14th European Workshop on White Dwarfs. Astron. Soc. Pac., San Francisco, p. 577
McGraw J. T., Robinson E. L., 1976,ApJ, 205, L155 Montgomery M. H. et al., 2010,ApJ, 716, 84
Nather R. E., Winget D. E., Clemens J. C., Hansen C. J., Hine B. P., 1990, ApJ, 361, 309
O’Donoghue D., Warner B., Cropper M., 1992,MNRAS, 258, 415 Papar´o M., Bogn´ar Z., Plachy E., Moln´ar L., Bradley P. A., 2013,MNRAS,
432, 598
Pfeiffer B. et al., 1996, A&A, 314, 182
Ricker G. R. et al., 2015, J. Astron. Telescopes, Instrum. Syst., 1, 014003
Robinson E. L., Stover R. J., Nather R. E., McGraw J. T., 1978,ApJ, 220, 614
S´odor ´A., 2012, Konkoly Observatory Occasional Technical Notes, 15
Downloaded from https://academic.oup.com/mnras/article-abstract/482/3/4018/5144232 by guest on 10 September 2019
Thompson S. E., Provenc¸al J. L., Kanaan A., Montgomery M. H., Bishoff- Kim A., Shipman H. Wet Team, 2009,J. Phys. Conf. Ser., 172, id.
012067
Tremblay P.-E., Gianninas A., Kilic M., Ludwig H.-G., Steffen M., Freytag B., Hermes J. J., 2015,ApJ, 809, 148
Vauclair G., Goupil M. J., Baglin A., Auvergne M. ., Chevreton M., 1989, A&A, 215, L17
Voss B., Koester D., Østensen R., Napiwotzki R., Homeier D., Reimers D., 2007, in Napiwotzki R., Burleigh M. R., eds, ASP Conf. Ser. Vol.
372, 15th European Workshop on White Dwarfs, Astron. Soc. Pac., San Francisco, p. 583
Zima W., 2008,Commun. Asteroseismol., 155, 17
Zong W., Charpinet S., Vauclair G., Giammichele N., Van Grootel V., 2016, A&A, 585, A22
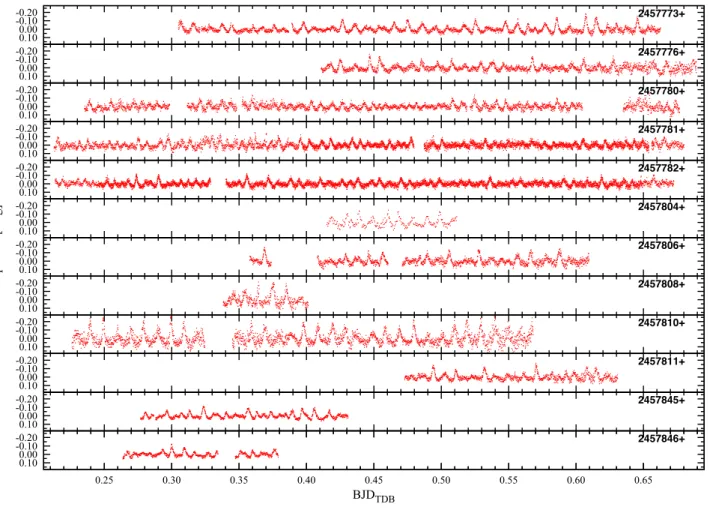
A P P E N D I X A :
Fig.A1: Normalized differential light curves of the observations of HS 0733+4119.
-0.20 -0.10 0.000.10
2457773+
-0.20 -0.10 0.000.10
2457776+
-0.20 -0.10 0.000.10
2457780+
-0.20 -0.10 0.000.10
2457781+
-0.20 -0.10 0.000.10
2457782+
-0.20 -0.10 0.000.10
2457804+
-0.20 -0.10 0.000.10
2457806+
-0.20 -0.10 0.000.10
2457808+
-0.20 -0.10 0.000.10
2457810+
-0.20 -0.10 0.000.10
2457811+
-0.20 -0.10 0.000.10
2457845+
-0.20 -0.10 0.000.10
2457846+
0.25 0.30 0.35 0.40 0.45 0.50 0.55 0.60 0.65
BJDTDB
Amplitude [mag]
Figure A1. Normalized differential light curves of the observations of HS 0733+4119.
Downloaded from https://academic.oup.com/mnras/article-abstract/482/3/4018/5144232 by guest on 10 September 2019
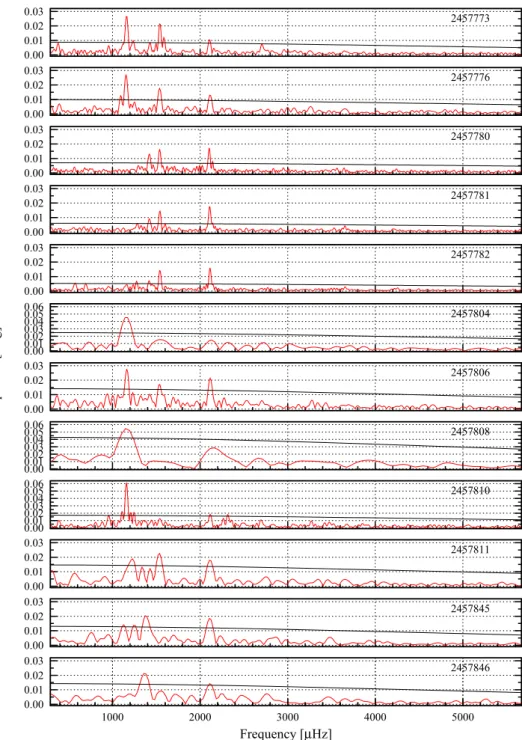
A P P E N D I X B :
Fig. B1: Fourier transforms of the nightly observations of HS 0733+4119.
0.00 0.01 0.02
0.03 2457773
0.00 0.01 0.02
0.03 2457776
0.00 0.01 0.02
0.03 2457780
0.00 0.01 0.02
0.03 2457781
0.00 0.01 0.02
0.03 2457782
0.000.01 0.020.03 0.040.05
0.06 2457804
0.00 0.01 0.02
0.03 2457806
0.000.01 0.020.03 0.040.05
0.06 2457808
0.000.01 0.020.03 0.040.05
0.06 2457810
0.00 0.01 0.02
0.03 2457811
0.00 0.01 0.02
0.03 2457845
0.00 0.01 0.02
0.03 2457846
1000 2000 3000 4000 5000
Frequency [μHz]
Amplitude [mag]
Figure B1. Fourier transforms of the nightly observations of HS 0733+4119. Black lines denote the 4Asignificance levels.
Downloaded from https://academic.oup.com/mnras/article-abstract/482/3/4018/5144232 by guest on 10 September 2019
A P P E N D I X C :
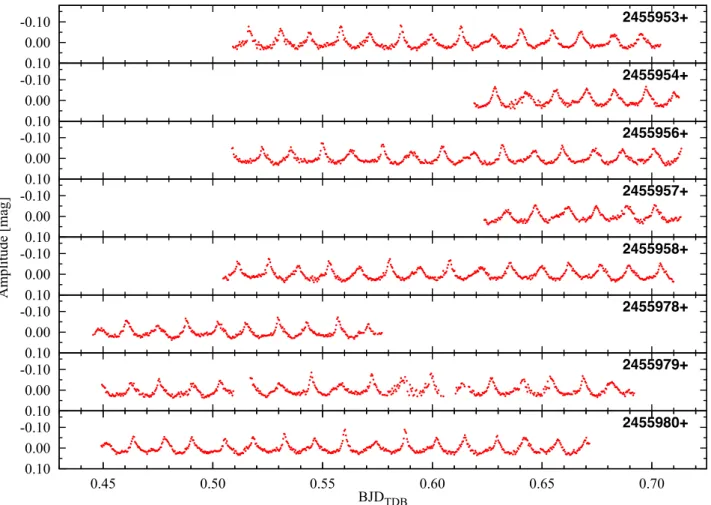
Fig.C1: Normalized differential light curves of the observations of GD 154 at Konkoly Observatory.
-0.10 0.00 0.10
2455953+
-0.10 0.00 0.10
2455954+
-0.10 0.00 0.10
2455956+
-0.10 0.00 0.10
2455957+
-0.10 0.00 0.10
2455958+
-0.10 0.00 0.10
2455978+
-0.10 0.00 0.10
2455979+
-0.10 0.00 0.10
2455980+
0.45 0.50 0.55 0.60 0.65 0.70
BJDTDB
Amplitude [mag]
Figure C1. Normalized differential light curves of the observations of GD 154 at Konkoly Observatory.
Downloaded from https://academic.oup.com/mnras/article-abstract/482/3/4018/5144232 by guest on 10 September 2019
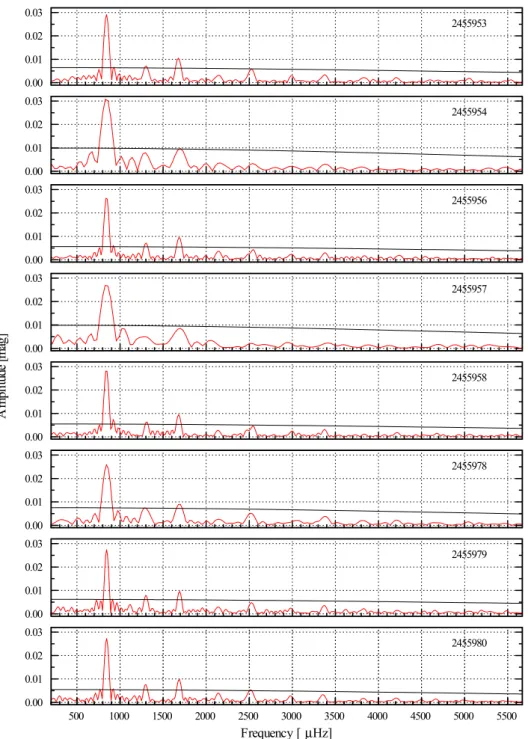
A P P E N D I X D :
Fig.D1: Fourier transforms of the nightly observations of GD 154 obtained at Konkoly Observatory.
0.00 0.01 0.02 0.03
2455953
0.00 0.01 0.02 0.03
2455954
0.00 0.01 0.02 0.03
2455956
0.00 0.01 0.02 0.03
2455957
0.00 0.01 0.02 0.03
2455958
0.00 0.01 0.02 0.03
2455978
0.00 0.01 0.02 0.03
2455979
0.00 0.01 0.02 0.03
2455980
500 1000 1500 2000 2500 3000 3500 4000 4500 5000 5500
Frequency [μHz]
Amplitude [mag]
Figure D1. Fourier transforms of the nightly observations of GD 154 obtained at Konkoly Observatory. Black lines denote the 4Asignificance levels.
Downloaded from https://academic.oup.com/mnras/article-abstract/482/3/4018/5144232 by guest on 10 September 2019