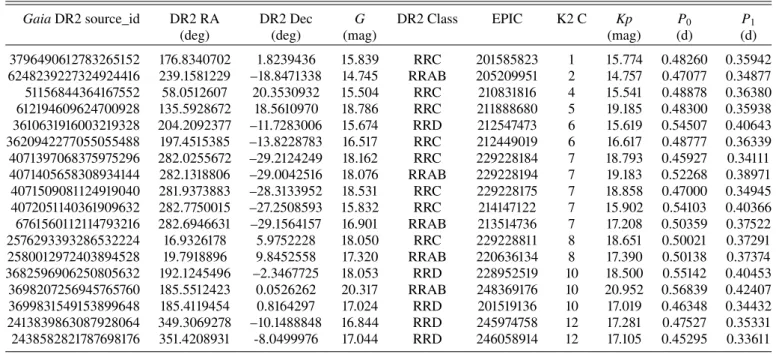
&
Astrophysics Special issue
https://doi.org/10.1051/0004-6361/201833514
© ESO 2018
Gaia Data Release 2
Gaia Data Release 2
Validating the classification of RR Lyrae and Cepheid variables with the Kepler and K2 missions ?
László Molnár1,2, Emese Plachy1,2, Áron L. Juhász1,3, and Lorenzo Rimoldini4
1Konkoly Observatory, MTA CSFK, 1121, Budapest, Konkoly Thege Miklós út 15-17, Hungary
2MTA CSFK Lendület Near-Field Cosmology Research Group, 1121, Budapest, Konkoly Thege Miklós út 15-17, Hungary e-mail:molnar.laszlo@csfk.mta.hu
3Department of Astronomy, Eötvös Loránd University, 1117, Budapest, Pázmány Péter sétány 1/a, Hungary
4Department of Astronomy, University of Geneva, Chemin d’Ecogia 16, 1290, Versoix, Switzerland Received 28 May 2018 / Accepted 22 October 2018
ABSTRACT
Context. The second data release of theGaiamission (DR2) includes an advance catalogue of variable stars. The classifications of these stars are based on sparse photometry from the first 22 months of the mission.
Aims. We set out to investigate the purity and completeness of the all-skyGaiaclassification results with the help of the continuous light curves of the observed targets from theKeplerand K2 missions, focusing specifically on RR Lyrae and Cepheid pulsators, outside the Galactic bulge region.
Methods. We cross-matched theGaiaidentifications with the observations collected by theKeplerspace telescope. We inspected the light curves visually, then calculated the relative Fourier coefficients and period ratios for the single- and double-mode K2 RR Lyrae stars to further classify them.
Results. We identified 1443 and 41 stars classified as RR Lyrae or Cepheid variables inGaiaDR2 in the targeted observations of the two missions and 263 more RR Lyre targets in the full-frame images (FFI) of the original mission. We provide the cross-match of these sources. We conclude that the RR Lyrae catalogue has a completeness between 70–78%, and provide a purity estimate of between 92 and 98% (targeted observations) with lower limits of 75% (FFI stars) and 51% (K2 worst-case scenario). The low number of Cepheids prevents us from drawing detailed conclusions, but the purity of the DR2 sample is estimated to be about 66%.
Key words. stars: variables: general – stars: variables: RR Lyrae – stars: variables: Cepheids
1. Introduction
RR Lyrae stars are large-amplitude pulsating stars with easily recognisable light-curve shapes. They can be used to measure distances, to trace structures in the Milky Way and other galax- ies, and to investigate stellar pulsation and evolution. Large sky surveys have mapped the distribution of RR Lyrae stars in par- ticular to large numbers and depths (see e.g.Drake et al. 2013;
Sesar et al. 2013; Beaton et al. 2016; Hernitschek et al. 2016;
Minniti et al. 2017, for some examples).
Cepheids, an umbrella term used to describe the classicalδ Cephei stars, the Type II Cepheids, and the anomalous Cepheids, are even more important tools for mapping the structure of the cosmos and individual galaxies: although they are less fre- quent than RR Lyrae stars, they are more luminous, and hence more easily detectable. The OGLE survey has very thoroughly searched both the Galactic bulge and the Magellanic Clouds for all members of the Cepheid and RR Lyrae families. According toSoszy´nski et al.(2017), their collection of classical Cepheids
?Full Tables A1, A4, and A5 are only available at the CDS via anonymous ftp to cdsarc.u-strasbg.fr (130.79.128.5) or via http://cdsarc.u-strasbg.fr/viz-bin/qcat?J/A+A/620/A127
is now nearly complete, concluding the work started a century ago byLeavitt(1908).
The GaiaData Release 2 (DR2;Gaia Collaboration 2018) represents a new step forward in mapping the distribution of RR Lyrae and Cepheid stars, as well as other variable stars in the Milky Way and its vicinity. However, these classifications are based on sparse photometry, and those classifications can be affected by poor phase coverage and/or confusion between variable types.
Space photometric missions, such as MOST, CoRoT,Kepler, or BRITE, provide dense, continuous photometry of variable stars that might in principle be used to validate the results from other surveys. However, most missions have either small aper- tures or very limited sample sizes or both, therefore their use for validation purposes is very limited. The only exception is the Keplerspace telescope, which observed hundreds of thousands of targets so far, including thousands of RR Lyrae and hundreds of Cepheid stars (Szabó et al. 2017;Molnár 2018). Our prelim- inary studies with the PanSTARRS PS1 survey byHernitschek et al.(2016) indicate that a comparison with data fromKepleris feasible, but the first results indicate that eclipsing binary stars may contaminate the RR Lyrae sample in the Galactic disc in that survey (Juhász & Molnár 2018).
These findings led us to use the observations ofKepler to provide an independent validation of the classifications of the various RR Lyrae and Cepheid-type variables in Gaia DR2.
Conversely, input fromGaiaDR2 will allow us in the future to correctly identify as RR Lyrae or Cepheid stars targets that hide in theKeplerand K2 databases.
The paper is structured as follows: in Sect. 2 we intro- duce the variable star observations made byGaia andKepler, respectively; in Sect. 3 we describe the classification of the Kepler light curves into the various subclasses; in Sect. 4 we present the results of the validation, and in Sect.5 we provide our conclusions.
2. Observations
2.1. Variable stars in Gaia DR2
Holl et al.(2018) summarized the results for the more than half a million variable stars published inGaiaDR2, which include candidates of RR Lyrae stars, Cepheids, long-period variables, rotation modulation (BY Draconis) stars,δScuti & SX Phoenicis stars, and short-timescale variables.
Different techniques were employed in the variability pipeline depending on the variability type. Here, we focus on the Cepheids and RR Lyrae stars identified by the all-sky classification (Rimoldini et al. 2018), available in the gaiadr2.vari_classifier_result table of the Gaia archive. Such classifications are normally verified by a subse- quent pipeline module dedicated to the RR Lyrae and Cepheid variables (Clementini et al. 2018), but only for sources with at least 12 field-of-view (FoV) transits in the G band. The variable classes that we use are the four RR Lyrae subtypes, RRAB, RRC, and RRD/ARRD (corresponding to fundamental- mode, first-overtone, and double-mode stars with either normal or anomalous period ratios), and various Cepheid types, CEP, T2CEP, and ACEP (corresponding to classical orδCephei stars, Type II Cepheids, and anomalous Cepheids). Throughout the paper, we refer to the variable classifications inGaiaDR2 in all capitals (RRAB, RRC, RRD), and use the regular RRab, RRc, RRd notations for our classifications based on the Kepler and K2 light curves.
Our goal is to provide an independent assessment of the com- pleteness and purity rates of the all-sky classification results of RR Lyrae and Cepheid candidates based on the fine light-curve sampling ofKeplerand K2 targets, regardless of the number of observations and other features or limitations related to theGaia data. We define completeness here as the fraction of sources with properly identified classes in Gaia DR2 against all RR Lyrae stars observed in theKeplerand K2 missions. Purity is defined here as the fraction of sources with properly identified variable classes compared to all sources in those classes inGaiaDR2.
Kepleris superior in terms of photometric precision and duty cycle to all ground-based surveys. The OGLE survey comes close as a result of the decade-long coverage, but it is lim- ited to the Galactic bulge, disc, and the Magellanic Clouds (Udalski et al. 2015), whereas Kepler observed several halo fields. We note thatHoll et al.(2018) presents some complete- ness and purity estimates based on the OGLE survey results for the RR Lyrae and Cepheid candidates. The only other program similar to Kepler is the Transiting Exoplanet Survey Satellite space telescope (TESS;Ricker et al. 2016): it has already started collecting continuous photometry from nearly the whole sky, but it will not reach the depth of either Gaia or Kepler or ground-based surveys.
In this study, we used the following information available in the Gaia DR2 archive (fields and table names specified in footnotes): celestial coordinates1, median G brightnesses2, the number of FoV transits in the Gband3, classification classes4 and scores5 ranging between 0 and 1, provided by the all-sky classification pipeline (Rimoldini et al. 2018).
2.2. Kepler and K2 missions
The Kepler space telescope was designed to detect transiting exoplanets and determine the occurrence of Earth-like, temper- ate rocky planets around Sun-like stars (Borucki et al. 2010;
Borucki 2016). To achieve this, it collected quasi-continuous photometry of approximately 170 000 stars in a field between Lyra and Cygnus, spanning about 115 deg2. The majority of stars were observed with a 29.4 min sampling, called long cadence (LC), and the telescope was rolled by 90 deg every quarter year. Not all stars were continuously observed: the target list was updated for every quarter. The prime mission lasted for four years, until the breakdown of two reaction wheels on board.
Afterwards,Keplerwas reoriented to observe in shorter, 60- to 80-day-long campaigns along the ecliptic, using only the two remaining reaction wheels. The new mission, named K2, had no core science program, and the space telescope has been uti- lized as a space photometric observatory instead, carrying out a very broad science program that extends beyond exoplanets and stellar physics (Howell et al. 2014). Coordination and target selection is managed by theKeplerGuest Observer Office6. Stel- lar physics studies are coordinated by theKeplerAsteroseismic Science Consortium (KASC), which has a dedicated RR Lyrae and Cepheids Working Group.
During the original mission, Kepler observed about 50 RR Lyrae stars, one classical Cepheid, V1154 Cyg, and a Type-II Cepheid of the RVb subtype, DF Cyg (see e.g. Benk˝o et al. 2010;Nemec et al. 2013;Bódi et al. 2016; Derekas et al.
2017;Vega et al. 2017, and references therein). The K2 mission greatly expanded the spatial coverage of the telescope, and pro- pelled the numbers of observed RR Lyrae and Cepheid stars into several thousands and hundreds, respectively, greatly exceeding the observations of previous space photometric missions (Szabó et al. 2017).
An important aspect of theKeplerspace telescope that sets it apart from other space photometric missions is the large opti- cal aperture (95 cm), allowing us to reach targets fainter thanKp
∼20 mag (whereKprefers to brightness in the wide passband of Kepler). In case of RR Lyrae stars, this translates into the dis- tance of the nearest dwarf galaxies (Molnár et al. 2015).Kepler is the only space telescope that is able to deliver continuous time-series photometry while matching the depth ofGaiaDR2.
Ground-based, deep, but sparse surveys such as Catalina (Drake et al. 2009) and PanSTARRS PS1 (e.g. Chambers et al. 2016) can also be useful to identify faint RR Lyrae candidates and have been used to select targets for the K2 mission. These surveys lack the potential of continuous light curves to unambiguously distin- guish pulsating stars from other sources, however, like eclipsing binaries that could be confused with them in sparse data sets
1 raanddecfromgaiadr2.gaia_source
2 median_mag_g_fovfromgaiadr2.vari_time_series_
statistics
3 num_selected_g_fovfromgaiadr2.vari_time_series_
statistics
4 best_class_namefromgaiadr2.vari_classifier_result
5 best_class_scorefromgaiadr2.vari_classifier_result
6 http://keplerscience.arc.nasa.gov
(Juhász & Molnár 2018). We exploit the properties of theKepler sample mentioned above (depth, coverage, and FoV size) to ver- ify and validate the classification of RR Lyrae and Cepheid variables inGaiaDR2.
It is important to note that only pre-selected targets have been observed in theKeplerand K2 missions. Data storage and down- load bandwidth limitations meant that only a low percentage of pixels were used to gather data in any given observing quarter or campaign. Full-frame images (FFI) were rarely stored, but a sparse sample is available for the original mission7. In the K2 mission, targets were exclusively proposed through the Guest Observer program. RR Lyrae candidates from large sky-surveys were revised and the weakest candidates were not proposed (Plachy et al. 2016). The target list was then cut by the Guest Observer Office, especially in the early campaigns. Therefore, the observed sample is neither a complete sample of the poten- tial RR Lyrae stars nor fully representative of the populations of stars within a FoV. However, these data still represent the largest sample of space-based photometry available to us. At the time of this study, data from Campaigns 0 to 13 were processed and released.
The resolution ofKepler at 4"/px is much poorer than that ofGaia. This could potentially lead to source confusion. How- ever, RR Lyrae and Cepheid light curves are easily recognisable even if a target is blended with another star nearby. Therefore, if photometric variation was detected at the target coordinates, we accepted it as a confirmed variable. Multiple stars of the same variable type could still be confused, but we found no such exam- ples. Given the limited angular resolution, we decided to avoid the Galactic bulge areas. The OGLE survey provides superior coverage for classification and validation purposes in the bulge, and was already used in this manner byHoll et al.(2018). The K2 Campaigns 9 and 11 (C9 and C11) targeted the Galactic bulge:
we omitted C9 entirely, and only used stars on C11 below –6 deg Galactic latitude, that is, excluding the region covered by the OGLE survey. Only a small fraction of the OGLE RR Lyrae targets were included in the K2 observations in C11, and their inclusion would not have been representative for the bulge popu- lation. We note that even with these cuts, blending and confusion hindered the detection and classification of some targets in C11 and C7; the latter targeted the Sagittarius (Sgr) stream and the outskirts of the bulge.
3. Target identification and classification
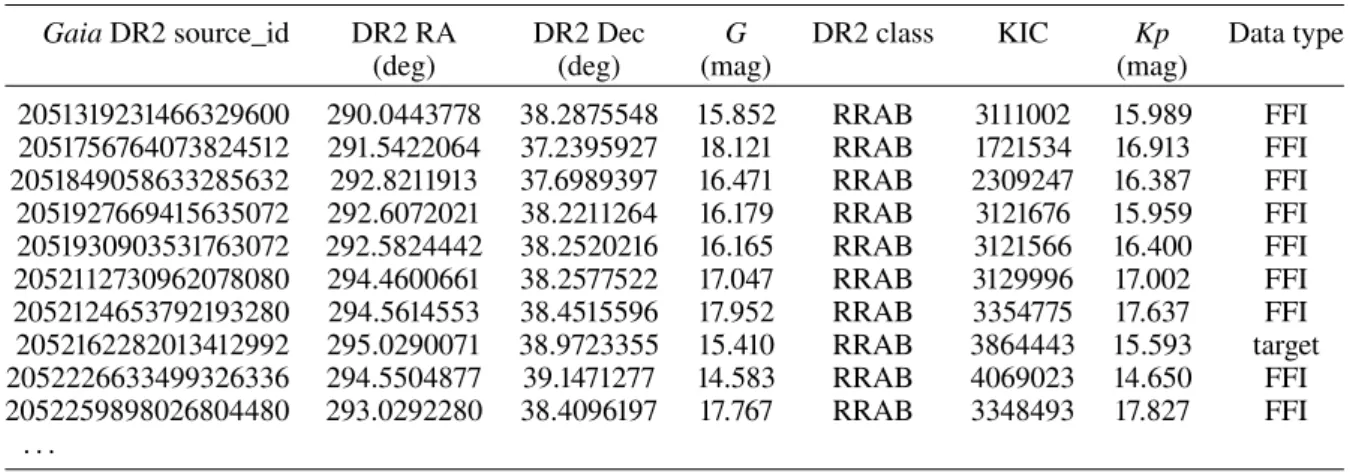
We cross-matched the Gaia DR2 sources that were classified as RR Lyrae or Cepheid variables around the original Kepler Lyra-Cygnus field with theKepler Input Catalog (KIC,Brown et al. 2011). The results of the cross-match are presented in AppendixA. We did not use the DR2 parallax andGBP−GRP
colour data for classification and relied only on the light-curve shape information provided byKepler. For the original mission, we searched for observed targets and classifications within the literature (Benk˝o et al. 2010,2014;Nemec et al. 2013;Moskalik et al. 2015) or visually inspected the light curves available at MAST8.
During the originalKeplermission, 52 FFIs were recorded: 8 during commissioning, and a further 44 during the mission, each taken before the monthly data downlink period. The integration
7 52 FFIs were recorded in the originalKeplermission, and one or two per campaign in the K2 mission.
8 Mikulski Archive for Space Telescopes,http://archive.stsci.
edu.
0.8 1 1.2 1.4 1.6
0 0.25 0.5 0.75 1
Rel. flux
Phase (PLC = 0.6207001 d)
0.8 1 1.2 1.4 1.6
0 0.25 0.5 0.75 1
Rel. flux
Phase (PFFI = 0.62072 d)
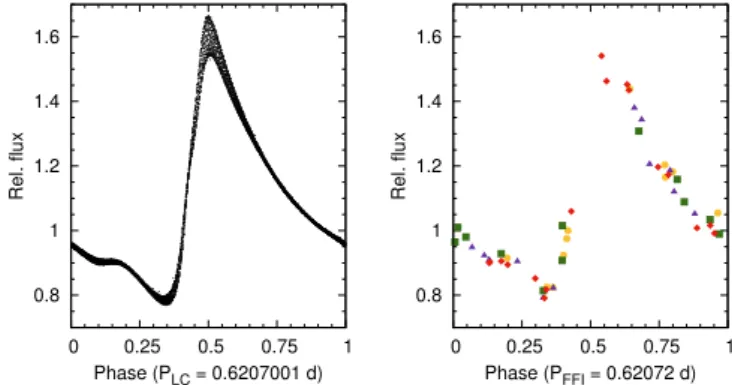
Fig. 1. Left panel: phased long-cadence light curve of a modulated RRab star, KIC 5559631, from the originalKepler mission, using the customised light curve ofBenk˝o et al.(2014).Right panel: light curve from the full-frame image of the same star, extracted by thef3code (Montet et al. 2017). Pulsation periods were determined independently for the two data sets. Different colours and symbols denote data from different CCD modules.
time was the same as for LC exposures. Although these images only provide sparse photometry, they were obtained at com- pletely different epochs with respect to theGaiaobservations, and are numerous enough to provide acceptable phase cover- age and a more representative stellar sample that is not affected by selection bias. We used the f3code developed by Montet et al.(2017) to extract the photometry of the stars, then folded the light curves with the most likely period based on the FFI data. A comparison of LC and FFI light curves of an RRab star is illustrated in Fig.1, which also shows the agreement of the periods recovered from the two light curves. We compared the FFI periods to the periods determined from normal light curves for all RR Lyrae-type stars thatKeplerobserved, and they agree in all cases. The low number of data points in FFI light curves effectively reduces the faint limit of this data set toG∼20 mag.
For the K2 observations, we selected the sources near the campaign fields from theGaiaDR2 RR Lyrae and Cepheid clas- sifications. The selection of RR Lyrae candidates is described in this section, while the one related to Cepheids is discussed in Sect. 4.4. Cross-match results for both groups are listed in AppendixA. We used theK2FoVtool to determine which stars fell on the CCD modules ofKeplerin each campaign (Mullally et al. 2016). Overall, 11 361 stars were potentially observable dur- ing the selected campaigns, that is, about 5% of the RR Lyrae variables identified in Gaia DR2. Most of these are near the bulge or the Sgr stream (9843 stars for Campaigns 2, 7, and 11), and only 1518 fell into the halo FoVs. We cross-matched these sources with the K2 Ecliptic Plane Input Catalog (EPIC) and with the list of targets selected for observation in the mission (Huber et al. 2016).
The K2 observations contain various systematics caused by the excess motion of the space telescope, and multiple solu- tions were developed to correct for these. We generated an initial classification list by selecting the best light curves created by the various photometric pipelines. For the majority of the stars, we used the official pipeline-produced pre-search data condi- tioned simple aperture photometry (PDCSAP) products (Stumpe et al. 2012). Where PDCSAP was not available or was of infe- rior quality, we used data from the K2 extracted light-curves (or K2SFF), the EPIC Variability Extraction and Removal for Exo- planet Science Targets (EVEREST), and, in a few cases, the K2 Planet candidates from OptimaL Aperture Reduction (POLAR) light curves (Vanderburg & Johnson 2014; Luger et al. 2016;
Barros et al. 2016). For a few stars, none of the light curve
0°
90°
180°
270°
360°
+36°
-36°
+90°
-90°
RA Dec
5 10 15 20 25 30 35 40 45 50
No. of data points
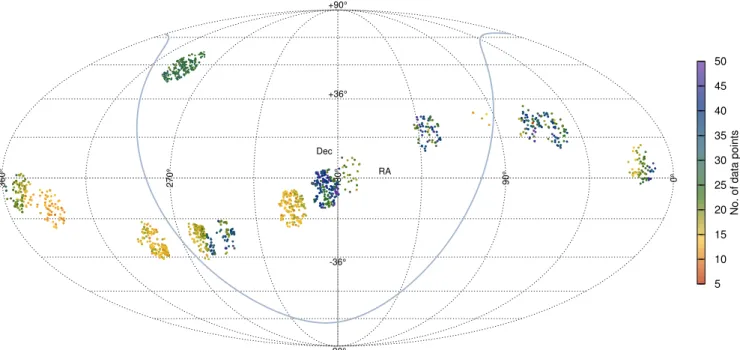
Fig. 2.Distribution of theGaiaDR2 RR Lyrae candidates confirmed by theKepler(targeted and FFI) and K2 measurements in the sky, mapped in a Mollweide projection of equatorial coordinates. The thick line in light blue marks the Galactic equator, and the colour-coding shows the number ofGaiaFoV transits in theGband per star. The originalKeplerfield is the northernmost group of stars at RA≈300 deg.
solutions provided by MAST were useful, and we applied the PyKE software to generate customised extended aperture pho- tometry to obtain better data (Still & Barclay 2012;Plachy et al.
2017;Vinícius et al. 2017). The distribution of the RR Lyrae stars from theKeplerand K2 missions cross-matched with theGaia DR2 candidates are plotted in Fig.2in equatorial coordinates.
For the K2 observations, our validation procedure was based on visual inspection and quantitative properties of the light-curve shapes. Our criteria for the visual inspection were the follow- ing. Fundamental-mode RR Lyrae and classical Cepheid stars have very distinct, almost sawtooth-like light curves with short, sharp rising branches and long descending branches that repeat (almost) regularly, or vary smoothly if they are modulated. Char- acteristic bumps or humps, generated by shockwaves appearing at the surface of the star, also show up at distinct pulsation phases. Hump- or bump-like features can also appear in rotat- ing variables, but in these cases, they drift in phase because of differential rotation.
Double-mode stars can be harder to identify as they have less asymmetric light curves. They usually still have steeper rising branches, often with prominent humps before maximum light. Scatter in the light curve extrema may indicate beating with additional modes. In contrast, regular or smoothly varying alternations in the minima or maxima can be attributed to dif- ferences in the components and/or appearance and evolution of spots in eclipsing binaries. Nevertheless, classification of nearly sinusoidal light curves can remain ambiguous.
Overtone stars show distinct beating patterns in the light curve, which unlike beating caused by spot patterns in rotating stars, repeat very regularly. Given the small number of double- mode stars, we examined all candidates in more detail before accepting them (see below).
3.1. Fourier parameters
For a quantitative analysis, we calculated the Fourier fits of the five strongest frequency components in the light curve using
the LCFitcode (Sódor 2012). Then we calculated the relative Fourier parameters, comparing theith and the first harmonics with amplitude ratiosRi1 =Ai/A1 and phase differencesΦci1 = Φci−iΦc1(wherecrefers to cosine-based Fourier fits), as defined bySimon & Lee(1981) andSimon & Teays(1982). These terms are frequently used to classify pulsating variables and to sepa- rate various subclasses. We plot them as a function of period fori =2,3 in Fig. 3. The stars clearly separate into the RRab and RRc loci, with very few outliers (for comparison, we refer toSoszy´nski et al. 2009). We discuss some of the outliers in Sect. 4.2.2. The low quality of light curves in the dense stel- lar field of the Sgr stream prevented us from calculating Fourier parameters in only six cases. Because hints of RRab variability can be visually confirmed in them, however, we included these stars as positive detections.
To validate double-mode candidates, we also computed the period ratios of the two main modes of the RRd stars: these give strong constraints if the star is a normal or anomalous RRd star (Soszy´nski et al. 2016). These values, along with the analysis of all RRd stars observed in the K2 mission, will be published in a separate paper (Nemec, priv. comm.).
3.2. Brightness comparison
We compared the GaiaDR2 median Gbrightnesses with the values obtained from the K2 data. The passbands of the two mis- sions are similar, withKeplerspanning a 420–900 nm andGaia a slightly wider 350–1000 nm wavelength range, both peaking around 600–700 nm (Van Cleve & Caldwell 2016;Evans et al.
2018).
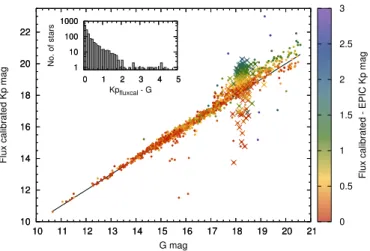
We computed the flux-calibrated brightnesses (Kpfc) of the K2 stars from the PDCSAP light curves, using the zero-point of 25.3 mag, as determined byLund et al.(2015). The two measure- ments generally agree well (see Fig. 4), with 60% of the stars below 0.1 mag difference, although it exceeds 1 mag for about 10% of the targets. The flux-calibrated magnitudes provide a bet- ter agreement withGaiathan the values found in EPIC (KpEPIC)
0 1 2 3 4 5 6
-0.6 -0.5 -0.4 -0.3 -0.2 -0.1 0
0.3 0.4 0.5 0.6 0.7 0.8 0.9 1
P (d)
φ21c
log P (d) 0
1 2 3 4 5 6
-0.6 -0.5 -0.4 -0.3 -0.2 -0.1 0
0.3 0.4 0.5 0.6 0.7 0.8 0.9 1
0 0.1 0.2 0.3 0.4 0.5 0.6
R21
0 1 2 3 4 5 6
-0.6 -0.5 -0.4 -0.3 -0.2 -0.1 0
0.3 0.4 0.5 0.6 0.7 0.8 0.9 1
P (d)
φ31c
log P (d) 0
1 2 3 4 5 6
-0.6 -0.5 -0.4 -0.3 -0.2 -0.1 0
0.3 0.4 0.5 0.6 0.7 0.8 0.9 1
0.1 0.2 0.3 0.4
R31
0 0.1 0.2 0.3 0.4 0.5 0.6 0.7
-0.6 -0.5 -0.4 -0.3 -0.2 -0.1 0
0.3 0.4 0.5 0.6 0.7 0.8 0.9 1
P (d)
R21
log P (d) 0
0.1 0.2 0.3 0.4 0.5 0.6 0.7
-0.6 -0.5 -0.4 -0.3 -0.2 -0.1 0
0.3 0.4 0.5 0.6 0.7 0.8 0.9 1
3 3.5 4 4.5 5 5.5
φ21c
0 0.1 0.2 0.3 0.4 0.5
-0.6 -0.5 -0.4 -0.3 -0.2 -0.1 0
0.3 0.4 0.5 0.6 0.7 0.8 0.9 1
P (d)
R31
log P (d) 0
0.1 0.2 0.3 0.4 0.5
-0.6 -0.5 -0.4 -0.3 -0.2 -0.1 0
0.3 0.4 0.5 0.6 0.7 0.8 0.9 1
0.5 1 1.5 2 2.5 3 3.5 4 4.5 5
φ31c
Fig. 3. Fourier parameters of the light curves of cross-matched K2–GaiaRR Lyrae-type sources. The ith and the first Fourier harmonics are compared by theΦc21,Φc31relative phase differences (in radians, using cosine-based Fourier fits) and theR21,R31amplitude ratios, as a function of the periods (P). The colour-coding shows the respectiveR21−Φc21andR31−Φc31pairs. Triangles show RRc stars, dots represent RRab stars, and crosses show potential anomalous Cepheid stars (see Sect.4.2.2).
10 12 14 16 18 20 22
10 11 12 13 14 15 16 17 18 19 20 21
Flux calibrated Kp mag
G mag 10
12 14 16 18 20 22
10 11 12 13 14 15 16 17 18 19 20 21 0 0.5 1 1.5 2 2.5 3
Flux calibrated - EPIC Kp mag
1 10 100 1000
0 1 2 3 4 5
No. of stars
Kpfluxcal - G 1
10 100 1000
0 1 2 3 4 5
Fig. 4.Comparisons of theGaiaDR2 medianGmagnitudes and the flux-calibrated Kp magnitudes from the K2 mission, with the inset showing the distribution of the absolute differences. Colour-coding marks the absolute differences between the flux-calibratedKpvalues and those found in EPIC: there is a clear systematic difference between the twoKpvalues towards, the faint end. Red outliers indicate agree- ment between theKpvalues, but difference from theGaiabrightnesses.
Crosses mark the Sgr stream stars in Field 7. The black line marks equality.
up to aboutG ≈18 mag. ForG >18, as the colour-coding in Fig.4illustrates, the flux-calibrated values appear to be system- atically fainter than the EPIC values. These issues probably come from the properties of the PDCSAP pipeline (poor background correction for dense fields and small pixel apertures for faint tar- gets). This is especially pronounced for the population of the Sgr stream stars, marked with crosses in Fig.4.
For about 1% of the stars, theGaiabrightness differs signifi- cantly from the two nearly identicalKpvalues (|Kpfc–KpEPIC|<
0.1 mag, while|G–Kpfc|>1.0 mag). The cause of discrepancy
in most of these cases is that the cross-matched EPIC refers to a close-by (within 1–3Keplerpixels) brighter star that is blended with the faint RR Lyrae variable. In these cases, the light curve also consists of the combined flux of the two stars. Many of these G-Kpdiscrepant stars are also members of the Sgr stream.
4. Results
The two quantities we are most interested in are the purity, defined as the fraction of bona fide variable stars of the appro- priate class in the sample, and the completeness, defined as the fraction of the sources that are (properly) identified inGaiaDR2 compared to all (known) RR Lyrae stars within the FoVs. We investigated the distribution of stars according to the classifica- tion score, the number ofGaiaFoV transits in theGband, and the medianGbrightness.
4.1. RR Lyrae stars in the original Kepler field
We identified 48GaiaDR2 targets that were observed byKepler, and we were able to confirm 44 of them as RR Lyrae variables, suggesting a purity of 92%. Beyond these 44 stars, 12 addi- tional RR Lyrae stars have been identified by the KASC Working Group in the Lyra-Cygnus field, not all of which are published yet, indicating a completeness of 78% (44/56). One of the stars that is missing from theGaiaDR2 RR Lyrae sample is RR Lyr itself (as explained inRimoldini et al. 2018), which was observed in the original FoV ofKepler(Kolenberg et al. 2011). (RR Lyr is present in DR2, but with an erroneous meanGbrightness and parallax values (Gaia Collaboration 2018).)
After checking the data from the targeted observations, we then generated FFI-based light curves for a further 267 stars.
We were able to classify 147 and 38 as (potential) RRab or RRc variables. The photometry of a further 10 targets was not suc- cessful as they were either near the edges of a CCD module or were blended with bright stars: we did not include them in our
0 10 20 30 40 50 60 70 80 90
0 0.2 0.4 0.6 0.8 1
DR2 RRAB stars
Classification score 0
10 20 30 40 50 60 70 80 90
0 0.2 0.4 0.6 0.8 1 0
5 10 15 20
0 0.2 0.4 0.6 0.8 1
DR2 RRC stars
Classification score 0
5 10 15 20
0 0.2 0.4 0.6 0.8 1
0 10 20 30 40 50
10 15 20 25 30 35
DR2 RRAB stars
Num. points 0
10 20 30 40 50
10 15 20 25 30 35 0 5 10 15 20
10 15 20 25 30 35
DR2 RRC stars
Num. points 0
5 10 15 20
10 15 20 25 30 35
0 10 20 30 40 50 60 70 80
12 14 16 18 20
DR2 RRAB stars
G mag 0
10 20 30 40 50 60 70 80
12 14 16 18 20 0
5 10 15 20
12 14 16 18 20
DR2 RRC stars
G mag 0
5 10 15 20
12 14 16 18 20
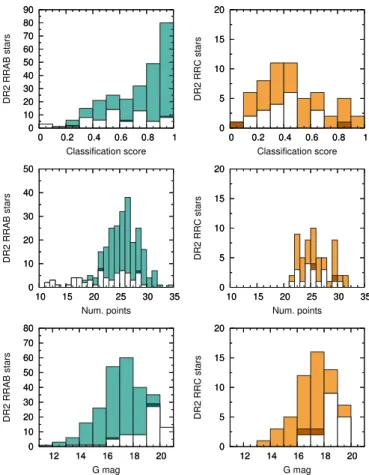
Fig. 5. Histograms for the Gaia DR2 RRAB- and RRC-classified objects in the original Kepler field. The light hues (light green and orange) mark stars that were confirmed as RRab or RRc variables based on theKeplerlight curves. Dark hues are RR Lyrae stars that we reclas- sified into the other group (dark green: RRc variables found in the RRAB class; brown: RRab stars in the RRC class). White indicates stars that we could not confirm as RR Lyrae variables.
statistics. Combined with the LC targets discussed above, we can provide a lower-limit estimate of at least 75% for the purity of the GaiaDR2 RR Lyrae candidates within the originalKeplerfield, although the low value can partially be attributed to the sparse FFI data we used. The completeness of the sample rises to 96%
when we include the stars confirmed by the FFI light curves.
A more detailed analysis of the FFI sample will be published elsewhere (Molnár & Hanyecz, in prep.).
The distribution of the stars in the original Kepler field against the classification scores, the number of Gaia G-band FoV transits, and the medianGbrightnesses are shown in Fig.5.
There is very little cross-contamination between the RRAB and RRC classes (stars that we classified into a different type). Con- tamination from sources that we could not confirm as RR Lyrae variables is significant among stars that have low coverage and/or are faint (G>18 mag). However, this can be partially attributed to the FFI photometry pipeline that was not developed to handle very faintKepler targets. The purity of the FFI sample is 90%
or 85% when we limit the targets toG <18 orG <19 mag, respectively.
4.2. RR Lyrae stars in the K2 fields
Overall, we were able to inspect the light curves of 1395 cross-matched K2 targets from Campaigns 0–8 and 10–13. The
��
���
����
����
����
��� ��� ��� ��� ��� ��� ���
��������������������
������
��
���
����
����
����
��� ��� ��� ��� ��� ��� ���
Fig. 6.Brightness distributions of the K2 targets stars that are classi- fied as RR Lyrae variables both inGaiaDR2 and based on their K2 light curves (blue), vs. those that were missed as variable candidates in GaiaDR2, but their K2 light curves show RR Lyrae variation (grey).
The blue solid and black dashed lines indicate the median values. These histograms are overlaid, not stacked.
distribution of theGaiaDR2 candidates observed in the K2 mis- sion is not uniform: the 601 stars from Campaigns 2, 7, and 11 represent only 6% of the 9843 observable targets in those fields, whereas for the rest, the halo fields the ratio is 52% (787/1518).
Of these 1395 stars, we confirmed the RR Lyrae-type vari- ability of 1371 stars (1243 RRAB, 141 RRC, and 10 RRD sources). No data were available for the five ARRD-type stars that were within the K2 FoVs. The remaining 24 observed stars turned out to be different types of variables. These numbers lead to a GaiaDR2 purity of 98%, in agreement with those of the targeted observations of the original Lyra-Cygnus field, and the findings ofHoll et al.(2018). However, we emphasize again that the observed stellar samples of the K2 campaigns are not neces- sarily representative of the true stellar populations within those fields, therefore we treat the purity value as an upper limit. We discuss the range of possible purity values in Sect.4.3in more detail.
Although the K2 photometric data are superior to data from other surveys, the observed sample is not exhaustive, so we can only provide an estimate for the completeness of theGaia DR2 classifications. Targets proposed for observation in the K2 campaigns were cross-matched from various surveys, and vetted based on the available photometry in the literature, and they are therefore more complete than any single catalogue (Plachy et al.
2016). Light curves gathered byKepler based on these propos- als were also checked visually, and they revealed very low level of contamination by other variables. Therefore, we considered the number of proposed and observed stars to be a good esti- mate for the number of true RR Lyrae stars in the FoVs. We then collected all stars that were proposed and observed during the mission, but had no counterparts inGaiaDR2 RR Lyrae classifi- cations. We ended up with 445 targets, leading to a completeness estimate of 75% for the K2 fields. This is somewhat higher than the values computed for the OGLE fields (Holl et al. 2018), but agrees with our estimate for targeted observations in the original Keplerfield. We plot the brightness distribution of the confirmed and missed RR Lyrae stars from the K2 mission in Fig.6. The two distributions are fairly similar, but the maximum is shifted towards fainter magnitudes for the stars that are not classified as RR Lyrae in theGaiaDR2 classification table, by about 0.6 mag (the medians of the two groups are 16.6 and 17.2 mag).
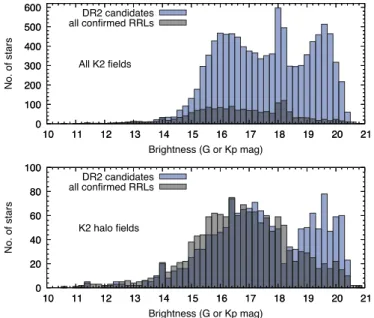
We also compared the brightness distributions of all Gaia DR2 candidates falling into the K2 fields to all confirmed RR Lyrae stars therein (including the missed 445 stars) in Fig. 7
��
����
����
����
����
����
����
��� ��� ��� ��� ��� ��� ��� ��� ��� ��� ��� ���
������������
������������
������������������������
��������������
�����������������
��
����
����
����
����
����
����
��� ��� ��� ��� ��� ��� ��� ��� ��� ��� ��� ���
��
���
���
���
���
����
��� ��� ��� ��� ��� ��� ��� ��� ��� ��� ��� ���
�������������
������������
������������������������
��������������
�����������������
��
���
���
���
���
����
��� ��� ��� ��� ��� ��� ��� ��� ��� ��� ��� ���
Fig. 7.Brightness distributions of theGaiaDR2 candidates (blue) by Holl et al.(2018) in the K2 fields vs. all known confirmed RR Lyrae stars within in the same fields, including stars not in the DR2 variability catalogue. Theupper panelshows all fields; the spike at 18 mag is the Sgr stream. Thelower panelshows the halo fields only.
to see how different the selection function of the two missions are. Based on their capabilities alone,Kepleris only limited by source confusion, but it is able to observe stars below the faint limit ofGaia(see e.g. the RR Lyrae stars in Leo IV;Molnár et al.
2015). However, the sample observed byKeplerwas limited by the input catalogues used for target selection. The large differ- ence in the upper panel of Fig.7comes from the large number of bulge stars that were not observed in the K2 mission. The comparison of the halo fields only (i.e. excluding Campaigns 2, 7, and 11) shows a much better agreement in the lower panel. For stars brighter than 16.5 mag (here we used eitherGorKpmagni- tudes for stars, given the good agreement between the two), the K2 observations and the input catalogues we used provide a sam- ple more complete than that ofHoll et al.(2018). Interestingly, the GaiaDR2 sample shows another excess below 18.5 mag.
Since most of these stars have no K2 light curves, we cannot decide if these stars are contaminants or bona fide RR Lyrae stars that were not detected by other surveys before. Unfortu- nately, this brightness range will not be accessible to the TESS space telescope either.
4.2.1. RR Lyrae subclass statistics
Based on their K2 light curves, we identified 1371 objects as RR Lyrae stars, 1211 (88%) RRab, 142 (10%) RRc, and 17+1 RRd and anomalous RRd stars (1%). Our classifications do not always agree with those ofGaiaDR2. We found theGaiaDR2 RRAB class to be nearly pure, with only 1% (14/1243) of contamina- tion from the other classes (stars that turned out to be RRc- or RRd-type pulsators instead). The contamination in the RRC and RRD classes was 8% (12/142) and 50% (5/10), respectively.
While contamination rises significantly for these classes, they are much less numerous, therefore the overall rate is only about 2% for the RR Lyrae stars in general.
Moreover, of the 24 stars that we could not confirm as RR Lyrae variables, K2 light curves of 5 RRAB candidates revealed Cepheid variations (1 anomalous and 4 Type II Cepheids).
This indicates a low level of cross-contamination between the
Table 1.Confusion matrix of theGaiaand K2 results.
GaiaDR2 GaiaDR2 GaiaDR2 Sum
RRAB RRC RRD
RRab 99.6% (1206) 2.8% (4) 0.1% (1) 1211 RRc 6.3% (9) 90.8% (129) 2.8% (4) 142 RRd 27.8% (5) 44.4% (8) 27.8% (5) 10 Neither 95.8% (23) 4.2% (1) 0% (0) 24 Contam. 3.0% (37) 9.1% (13) 50% (5)
Notes. TheGaiaclassifications are compared to our findings. Contam- ination of eachGaiaclass is presented in the bottom row.
RR Lyrae and Cepheid classes. We reclassify two of these, V1637 Oph (EPIC 234649037,PK2=1.327 d), previously clas- sified as an RR Lyrae, and FZ Oph (EPIC 251248334, PK2 = 1.500 d), an under-observed variable, as short-period Type II Cepheids, also known as BL Her-type stars, based on their K2 light curves. The results are summarised in the confusion matrix in Table1.
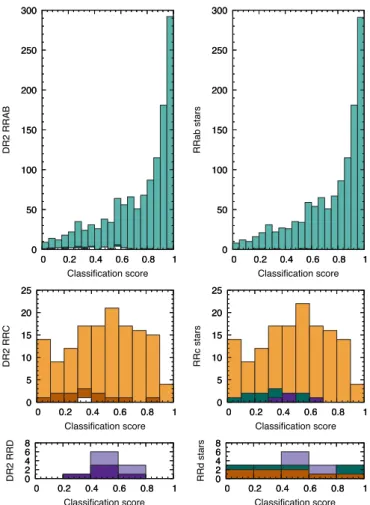
Figure8shows the distribution of the classification scores for the various RR Lyrae subclasses. The left panels group the stars according to theirGaiaDR2 classification types. We indicate the portion of stars that we reclassified into different classes with darker hues. The right panels show the variability types based on the K2 light curves, with the same colours denoting the num- ber of stars that we reassigned a different RR Lyrae subclass.
The difference between the classification score distributions of RRab and RRc/RRd stars is striking: half of the RRab stars have scores above 0.8, while the distribution of the RRc and RRd stars is essentially flat, and for RRc stars the score falls off near 1.0.
The flat distribution suggests that the RRC and RRD classes were harder to identify, likely because of the competition with the dominant RRAB class. Figure8also confirms that the RRab sample is nearly pure (almost all stars are from the RRAB class), while the RRd sample includesGaiaclassifications of all three subclasses. For the RRc stars, the sample appears to be nearly pure above classification score 0.6, and about 15% of RRc stars with scores<0.6 ended up in the RRAB or RRD classes of the GaiaDR2 classification.
The distributions of the median brightnesses in theGband of the three RR Lyrae subclasses are shown in Fig.9. In con- trast to the distribution from the original Kepler field, we do not see an increase of unconfirmed variables toward the faint end, as they appear rather evenly spread. Interestingly, RRc stars brighter thanG∼15 mag seem to be missing from our partic- ular selection of Gaia DR2 classifications (centre left panel), although we reclassified a few of them from the other sub- classes (centre right panel). However, the number of RRab stars also decreases rapidly from 14–15 mag towards the bright end.
Therefore, the apparent lack of a few RRc stars most certainly stems from small number statistics here.
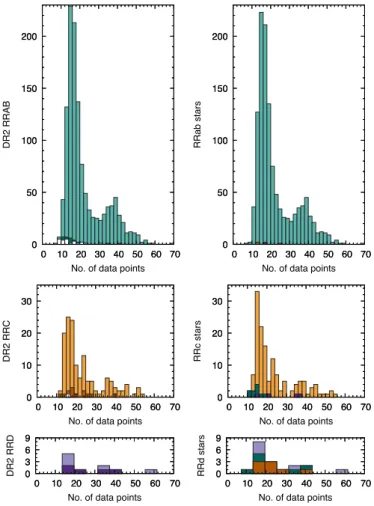
Finally, Fig.10shows the distribution of stars according to the number ofG-band observations per RR Lyrae subclass. Here, the unconfirmed variables are clearly grouped at the low end, especially for the RRAB class. For stars with 20 or fewer FoV transits, the contamination is about 3%, and for the few stars with fewer than 12 FoV transits, it rises to 8%. These numbers indicate that theGaiaDR2 sample of RR Lyrae classifications is relatively pure even for stars with only a few observations.
These estimates illustrate that the classifications of Gaia DR2 are already well suited to identifying single-mode pulsators,
��
���
����
����
����
����
����
�� ���� ���� ���� ���� ��
��������
�������������������
��
���
����
����
����
����
����
�� ���� ���� ���� ���� �� ��
���
����
����
����
����
����
�� ���� ���� ���� ���� ��
����������
�������������������
��
���
����
����
����
����
����
�� ���� ���� ���� ���� ��
��
��
���
���
���
���
�� ���� ���� ���� ���� ��
�������
�������������������
��
��
���
���
���
���
�� ���� ���� ���� ���� �� ��
��
���
���
���
���
�� ���� ���� ���� ���� ��
���������
�������������������
��
��
���
���
���
���
�� ���� ���� ���� ���� ��
����
����
��
�� ���� ���� ���� ���� ��
�������
�������������������
����
����
��
�� ���� ���� ���� ���� �� ����������
�� ���� ���� ���� ���� ��
���������
�������������������
����
����
��
�� ���� ���� ���� ���� ��
Fig. 8.Distribution of the various classification scores of the RR Lyrae subtypes. Left panels:GaiaDR2 classification type;right panels: as classified based on the K2 data. The distribution is skewed towards score values of 1.0 for RRab stars but is flat for RRc and RRd stars.
Light green, orange, and pale violet mark bona fide RRab, RRc, RRd stars, respectively. Dark green, brown, and dark lilac denote stars that we classified into a different subclass (which are distributed in different panels on the right-hand side). White bars refer to the counts of stars for which the RR Lyrae variability was not confirmed or was rejected.
even at low numbers of FoV transits, but multiperiodic objects like RRd stars will need more extended observations.
4.2.2. Ambiguous identifications
As mentioned in Sect.3, the Fourier parameters in Fig.3mostly separate the stars into two groups corresponding to RRab- and RRc-type stars, but we found a few stars that we could not classify unambiguously. We flagged four stars as potentially anomalous Cepheids: three fundamental-mode candidates and one first-overtone candidate. We must emphasize, however, that the Fourier parameters of anomalous Cepheids overlap with those of RRab stars for certain period ranges, and therefore we could not rule out that these four objects are RRab stars based on their light-curve shapes alone. These four stars are identified in K2 as EPIC 206010651, 206175324, 212459957, and 234523936 (the last is the overtone candidate), corre- sponding to Gaia DR2 source_id 2600030303142307968, 2614960399737036672, 3606980678405498368, and 4134356134978875904, respectively.
Some outliers of the distribution of Φc21 in Fig. 3 can be attributed to a peculiar group of modulated RRab stars that
��
���
���
���
���
����
����
����
����
��� ��� ��� ��� ��� ���
��������
�����
��
���
���
���
���
����
����
����
����
��� ��� ��� ��� ��� ��� ��
���
���
���
���
����
����
����
����
��� ��� ��� ��� ��� ���
����������
�����
��
���
���
���
���
����
����
����
����
��� ��� ��� ��� ��� ���
��
��
���
���
���
���
���
���
��� ��� ��� ��� ��� ���
�������
�����
��
��
���
���
���
���
���
���
��� ��� ��� ��� ��� ��� ��
��
���
���
���
���
���
���
��� ��� ��� ��� ��� ���
���������
�����
��
��
���
���
���
���
���
���
��� ��� ��� ��� ��� ���
����
����
��
��� ��� ��� ��� ��� ���
�������
�����
����
����
��
��� ��� ��� ��� ��� ��� ����������
��� ��� ��� ��� ��� ���
���������
�����
����
����
��
��� ��� ��� ��� ��� ���
Fig. 9.Distribution of the medianGmagnitudes per RR Lyrae subtype.
The colour-coding is the same as in Fig.8.
exhibit a strong Blazhko effect, with a full rotation in the Φci1 parameters during the minimum-amplitude cycle (Guggenberger et al. 2012;Bódi et al. 2018). This phenomenon could shift the average value of the parameters when the duration of the light curve is comparable to the modulation period. This is the case, for example, for EPIC 245954410, with logP/d =−0.29 and Φc21 =6.16 rad, and for EPIC 212545143, an extremely modu- lated RRab star with logP/d =−0.27 andΦc21 =0.99 rad. We note that two other stars at low Φc21 but with shorter periods are not flagged as outliers. Although most RRc stars appear in a tight group, others spread out from 0 to 2π, and these two stars represent that subgroup of RRc stars.
4.3. RR Lyrae completeness and purity ranges
The observations of the two missions ofKeplerprovide different samples that are not straightforward to combine. Here we discuss the various samples and statistics obtained. We can focus on the originalKeplerfield where the combination of the targeted, con- tinuous light curves and the FFI photometry provides a sample that is not biased by prior selection of targets, but hindered by the sparse nature of the FFI light curves. Alternatively, we can gather all targeted observations from the two missions, resulting in a larger sample that is based on the same data acquisition method.
Finally, we can calculate purity and completeness values for all three samples (Kepler,KeplerFFI, and K2) combined. Through these combinations we provide a range of estimates, which are summarised in Table2.