May 30, 2018
Gaia Data Release 2: Validation of the classification of RR Lyrae and Cepheid variables with the Kepler and K2 missions
László Molnár1, Emese Plachy1, Áron L. Juhász1,2, and Lorenzo Rimoldini3
1 Konkoly Observatory, MTA CSFK, H-1121, Budapest, Konkoly Thege Miklós út 15-17., Hungary
2 Department of Astronomy, Eötvös Loránd University, H-1117, Budapest, Pázmány Péter sétány 1/a, Hungary
3 Department of Astronomy, University of Geneva, Chemin d’Ecogia 16, CH-1290, Versoix, Switzerland Received .../accepted ...
ABSTRACT
Context.The second data release of theGaiamission includes an advance catalog of variable stars. The classification of these stars are based on sparse photometry from the first 22 months of the mission.
Aims.We set out to investigate the purity and completeness of the all-skyGaiaclassification results with the help of the continuous light curves of the observed targets from theKeplerand K2missions, focusing specifically on RR Lyrae and Cepheid pulsators, outside the Galactic Bulge region.
Methods.We crossmatched theGaiaidentifications with the observations collected by theKeplerspace telescope. We inspected the light curves visually, then calculated the relative Fourier coefficients and period ratios for the single- and double-modeK2RR Lyrae stars to further classify them.
Results.We identified 1443 and 41 stars classified as RR Lyrae or Cepheid variables in DR2 in the targeted observations of the two missions and 263 more RR Lyre targets in the Full-Frame Images (FFI) of the original mission. We provide the crossmatch of these sources. We conclude that the RR Lyrae catalog has a completeness between 70–78%, and provide a purity estimate between 92–98%
(targeted observations) with lower limits of 75% (FFI stars) and 51% (K2worst-case scenario). The low number of Cepheids prevents us from drawing detailed conclusions but the purity of the DR2 sample is estimated to be around 66%.
Key words. Stars: variables: general – Stars: variables: Cepheids – Stars: variables: RR Lyrae
1. Introduction
RR Lyrae and Cepheid-type stars are large-amplitude pulsating stars with easily recognizable light curve shapes. They can be used both to measure distances and to trace structures in the Milky Way and other galaxies, and to investigate stellar pulsa- tion and evolution. Large sky surveys mapped the distribution of RR Lyrae stars in particular to large numbers and depths (see, e.g., Drake et al. 2013; Sesar et al. 2013; Beaton et al. 2016;
Hernitschek et al. 2016; Minniti et al. 2017, for some examples).
Cepheids, an umbrella term used to describe both the clas- sical δCephei stars, the Type II Cepheids, and the anomalous Cepheids, are even more important tools to map the structure of the cosmos and individual galaxies: although they are less fre- quent stars than RR Lyrae stars, they are more luminous, so they are more easily detectable. The OGLE survey had, for example, very thoroughly searched both the Galactic bulge and the Mag- ellanic Clouds for all members of the Cepheid and RR Lyrae families. According to Soszy´nski et al. (2017), their collection of classical Cepheids is now near-complete, concluding the work started a century ago by Leavitt (1908).
The GaiaData Release 2 (DR2; Gaia Collaboration et al.
2018) represents a new step forward in mapping the distribution of RR Lyrae and Cepheid stars, as well as other variable stars in the Milky Way and its vicinity. However, these classifications are based on sparse photometry, and those classifications can be affected by poor phase coverage and/or confusion between vari- able types.
Space photometric missions, such as MOST, CoRoT, Ke- plerorBRITE, provide dense, continuous photometry of variable stars that could be, in principle, used to validate the results from other surveys. However, most missions have either small aper- tures or very limited sample sizes, or both, therefore their use for validation purposes is very limited. The only exception is the Keplerspace telescope that observed hundreds of thousands of targets so far, including thousands of RR Lyrae and hundreds of Cepheid stars (Szabó et al. 2017; Molnár 2018). Our preliminary studies with the PanSTARRS PS1 survey by Hernitschek et al.
(2016), indicate that a comparison with data fromKepleris fea- sible, and the first results indicate that eclipsing binary stars may contaminate the RR Lyrae sample in the Galactic disk in that survey (Juhász & Molnár 2018). These findings led us to use the observations ofKeplerto provide an independent validation of the classifications of the various RR Lyrae and Cepheid-type variables in DR2.
The paper is structured as follows: in Sect. 2 we introduce the variable star observations made byGaiaandKepler, respec- tively; in Sect. 3 we describe the classification of theKeplerlight curves into the various subclasses; in Sect. 4 we present the re- sults of the validation, and in Sect. 5 we provide our conclusions.
2. Observations
2.1. Variable stars in Gaia DR2
Holl et al. (2018) summarize the results related to the over half a million variable stars published inGaiaDR2, which include
arXiv:1805.11395v1 [astro-ph.SR] 29 May 2018
candidates of RR Lyrae stars, Cepheids, long period variables, rotation modulation (BY Draconis) stars,δScuti & SX Phoeni- cis stars, and short-timescale variables. Different techniques are employed in the variability pipeline depending on the variabil- ity type. Herein, we focus on the Cepheids and RR Lyrae stars identified by the all-sky classification (Rimoldini et al., in prepa- ration), available in the gaiadr2.vari_classifier_result table of theGaiaarchive. Such classifications are normally veri- fied by a subsequent pipeline module dedicated to the RR Lyrae and Cepheid variables (Clementini et al. 2018), but only for sources with at least 12 field-of-view (FoV) transits in the G band. The variable classes that we use are the four RR Lyrae subtypes, RRAB, RRC, and RRD/ARRD (corresponding to fundamental-mode, first-overtone, and double-mode stars with either normal or anomalous period ratios) and various Cepheid types, CEP, T2CEP, and ACEP (corresponding to classical or δ Cephei stars, Type II Cepheids, and anomalous Cepheids).
Throughout the paper, we refer to the variable classifications in DR2 in all capitals (RRAB, RRC, RRD), and use the regular RRab, RRc, RRd notations for our classifications based on the KeplerandK2light curves.
Our goal is to provide an independent assessment of the com- pleteness (fraction of sources with properly identified classes in GaiaDR2 compared to known classifications) and purity rates (fraction of sources with properly identified classes compared to all sources classified as such classes inGaiaDR2) of the all-sky classification results of RR Lyrae and Cepheid variables with the fine light-curve sampling ofKeplerandK2targets, regard- less of the number of observations and other features or limita- tions related to theGaiadata.Kepleris superior in terms of pho- tometric precision and duty cycle to all ground–based surveys.
The OGLE survey comes close due to the decade-long coverage, but it is limited to the Galactic Bulge, disk, and the Magellanic Clouds, whereasKeplerobserved several halo fields. The Tran- siting Exoplanet Survey Satellite space telescope (TESS, Ricker et al. 2016) will soon collect continuous photometry from nearly the whole sky, but it will not reach the depth of eitherGaiaor other ground-based surveys.
In this study, we used the following information available in the Gaia DR2 archive (fields and table names specified in footnotes): celestial coordinates,1 median Gbrightnesses,2 the number of field-of-view transits in the Gband,3 classification classes4and scores5 ranging between 0–1, provided by the all- sky classification pipeline (Rimoldini et al., in preparation).
2.2. The Kepler and K2 missions
TheKeplerspace telescope was designed to detect transiting ex- oplanets and determine the occurrence of Earth-like, temperate rocky planets around Sun-like stars (Borucki et al. 2010; Borucki 2016). To achieve that, it collected quasi-continuous photome- try of approximately 170 000 stars in a field between Lyra and Cygnus, spanning about 115 deg2. The majority of stars were observed with a 29.4 min sampling, called long cadence (LC), and the telescope was rolled by 90 deg every quarter year. Not all stars were continuously observed: the target list was updated for every quarter. The prime mission lasted for 4 years, until the breakdown of two reaction wheels on board.
1 raanddecfromgaiadr2.gaia_source
2 median_mag_g_fovfromgaiadr2.vari_time_series_statistics
3 num_selected_g_fovfromgaiadr2.vari_time_series_statistics
4 best_class_namefromgaiadr2.vari_classifier_result
5 best_class_scorefromgaiadr2.vari_classifier_result
0.8 1 1.2 1.4 1.6
0 0.25 0.5 0.75 1
Rel. flux
Phase (PLC = 0.6207001 d)
0.8 1 1.2 1.4 1.6
0 0.25 0.5 0.75 1
Rel. flux
Phase (PFFI = 0.62072 d)
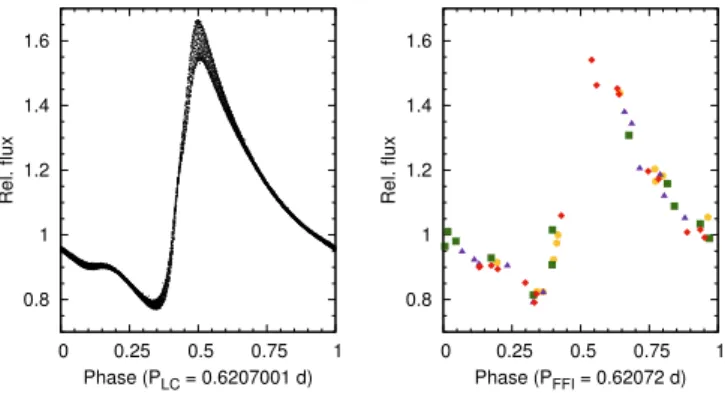
Fig. 1.Left: phased long cadence light curve of a modulated RRab star, KIC 5559631, from the originalKeplermission, using the tailor-made light curve of Benk˝o et al. (2014). Right: the light curve from the full- frame image of the same star, extracted by thef3code (Montet et al.
2017). Pulsation periods were determined for the two data sets indepen- dently. Different colours and symbols denote data from different CCD modules.
Afterwards,Keplerwas reoriented to observe in shorter, 60- 80 day long campaigns along the Ecliptic, using only the two remaining reaction wheels. The new mission, namedK2, had no core science program, and the space telescope has been utilised as a space photometric observatory instead, carrying out a very broad science program that extends beyond exoplanets and stel- lar physics (Howell et al. 2014). Coordination and target selec- tion is managed by the Kepler Guest Observer Program6. Stellar physics studies are coordinated by theKeplerAsteroseismic Sci- ence Consortium (KASC), which has a dedicated RR Lyraes and Cepheids Working Group.
During the original mission, Kepler observed about 50 RR Lyrae stars, as well as one classical Cepheid, V1154 Cyg, and a Type-II Cepheid of the RVb subtype, DF Cyg (see, e.g.
Benk˝o et al. 2010; Nemec et al. 2013; Derekas et al. 2017; Bódi et al. 2016; Vega et al. 2017, and references therein). TheK2 mission greatly expanded the spatial coverage of the telescope, and propelled the numbers of observed RR Lyrae and Cepheid stars into several thousands and hundreds, respectively, greatly exceeding the observations of previous space photometric mis- sions (Szabó et al. 2017).
An important aspect of theKeplerspace telescope that sets it apart from other space photometric missions, is the large op- tical aperture (95 cm), allowing us to reach targets fainter than Kp∼ 20 mag (whereKprefers to brightness in the wide pass- band ofKepler). In case of RR Lyrae stars, this translates to the distance of the nearest dwarf galaxies (Molnár et al. 2015).Ke- pleris the only space telescope that is able to deliver continu- ous time series photometry while matching the depth of Gaia DR2. Ground-based deep surveys such as Catalina (Drake et al.
2009) and PanSTARRS (e.g., Chambers et al. 2016) can also be useful in this context and have been used to select targets for theK2mission, but they miss the potential of continuous light curves to unambiguously differentiate pulsating stars from other sources, like eclipsing binaries that could be confused with them in sparse data sets (Juhász & Molnár 2018). We exploited the properties mentioned above—depth, coverage, and field-of-view size—of theKeplersample to verify and validate the classifica- tion of RR Lyrae and Cepheid variables inGaiaDR2.
It is important to note that only pre-selected targets are ob- served in bothKeplerandK2missions. Data storage and down-
6 http://keplerscience.arc.nasa.gov
0°
90°
180°
270°
360°
+36°
-36°
+90°
-90°
RA Dec
5 10 15 20 25 30 35 40 45 50
No. of data points
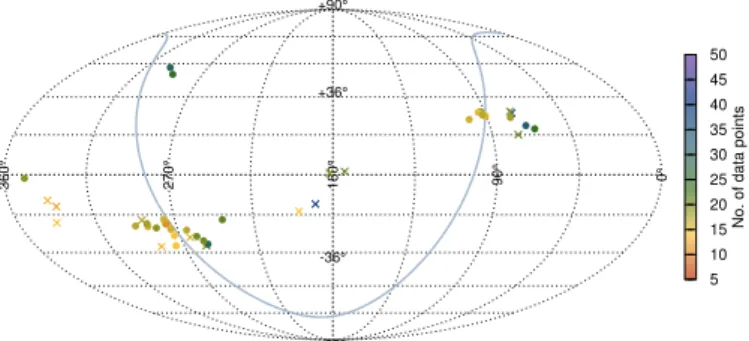
Fig. 2.The distribution in the sky of theGaiaDR2 RR Lyrae classifications confirmed by theKepler(targeted and FFI) andK2measurements, mapped by the Mollweide projection of equatorial coordinates. The thick line in light blue marks the Galactic equator and the colour coding shows the number ofGaiafield-of-view transits in theGband per star. The originalKeplerfield is the northernmost group of stars at RA≈300 deg.
load bandwidth limitations meant that only a low percentage of pixels were used to gather data in any given observing quar- ter or campaign. Full-frame images (FFI) were rarely stored, but a sparse sample is available for the original mission.7 In the K2mission, targets were exclusively proposed through the Guest Observer program. RR Lyrae candidates from large sky- surveys were revised and the weakest candidates were not pro- posed (Plachy et al. 2016). The target list was then cut by the Guest Observer Office, especially in the early campaigns. There- fore the observed sample is neither a complete sample of the po- tential RR Lyrae stars nor fully representative of the populations of stars within a field of view. However, these data still represent the largest sample of space-based photometry available to us.
The resolution ofKepler at 4"/px is much poorer than that ofGaia. This could potentially lead to source confusion. How- ever, RR Lyrae and Cepheid light curves are easily recognizable even if a target is blended with another star nearby. Therefore, if photometric variation was detected at the target coordinates, we accepted it as a confirmed variable. Multiple stars of the same variable type could still be confused but we found no such exam- ples. Given the poor angular resolution, we decided to avoid the K2Campaign 9 that targeted the Galactic Bulge entirely. Here, the OGLE survey provides superior coverage for classification and validation purposes. We used observations from Campaigns 0–8 and 10–13 for this work. We note that blending and confu- sion was hindering the detection and classification of some tar- gets even in Fields 7 and 11, which targeted the Sagittarius (Sgr) stream and the outskirts of the bulge. We decided to cut Field 11 at Galactic latitudes greater than 6 deg, i.e., excluding the region covered by the OGLE survey. Here only a small fraction of the OGLE RR Lyrae targets were included in theK2observations, and their inclusion would not have been representative for the Bulge population.
7 52 FFIs were recorded in the originalKeplermission, and one or two per campaign in theK2mission.
3. Target identification and classification
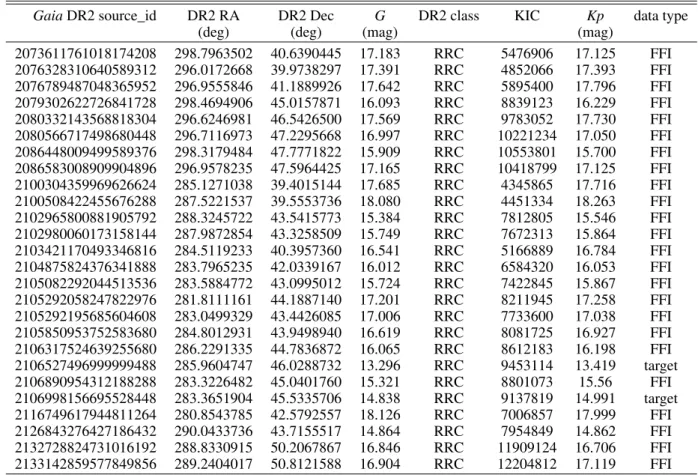
We did not use the DR2 parallax andGBP−GRPcolour data for classification and relied only on the light curve shape informa- tion provided byKepler. We crossmatched theGaiaDR2 sources that were classified as RR Lyrae or Cepheid variables around the originalKeplerLyra-Cygnus field with theKeplerInput Catalog (KIC, Brown et al. 2011). The results of the crossmatch are pre- sented in Appendix A. For the original mission, we searched for observed targets and classifications within the literature (Benk˝o et al. 2010; Nemec et al. 2013; Benk˝o et al. 2014; Moskalik et al.
2015) or visually inspected the light curves available at MAST8. During the originalKeplermission, 52 FFIs were recorded:
8 during commissioning, and a further 44 during the mission, each taken before the monthly data downlink period. The inte- gration time was the same as for LC exposures. Although these images only provide sparse photometry, they were obtained at completely different epochs with respect to theGaia observa- tions, and are numerous enough to provide acceptable phase coverage, and a more representative stellar sample that is not affected by selection bias. We used the f3code developed by Montet et al. (2017) to extract the photometry of the stars, then folded the light curves with the most likely period based on the FFI data. A comparison of LC and FFI light curves of an RRab star is illustrated in Fig. 1, which also shows the agreement of the periods recovered from the two light curves. We compared the FFI periods to the periods determined from normal light curves for all RR Lyrae-type stars thatKeplerobserved and they agree in all cases. The low number of data points in FFI light curves effectively reduces the faint limit of this data set toG∼20 mag.
For the K2 observations, we selected the sources near the campaign fields from theGaiaDR2 RR Lyrae and Cepheid clas- sifications. The selection of RR Lyrae candidates is described in this section, while the one related to Cepheids is discussed in
8 Mikulski Archive for Space Telescopes,http://archive.stsci.
edu
0 1 2 3 4 5 6
-0.6 -0.5 -0.4 -0.3 -0.2 -0.1 0
0.3 0.4 0.5 0.6 0.7 0.8 0.9 1
φ21c
log P (d) P (d)
0 1 2 3 4 5 6
-0.6 -0.5 -0.4 -0.3 -0.2 -0.1 0
0.3 0.4 0.5 0.6 0.7 0.8 0.9 1
0 0.1 0.2 0.3 0.4 0.5 0.6
R21
0 1 2 3 4 5 6
-0.6 -0.5 -0.4 -0.3 -0.2 -0.1 0
0.3 0.4 0.5 0.6 0.7 0.8 0.9 1
φ31c
log P (d) P (d)
0 1 2 3 4 5 6
-0.6 -0.5 -0.4 -0.3 -0.2 -0.1 0
0.3 0.4 0.5 0.6 0.7 0.8 0.9 1
0.1 0.2 0.3 0.4
R31
0 0.1 0.2 0.3 0.4 0.5 0.6 0.7
-0.6 -0.5 -0.4 -0.3 -0.2 -0.1 0
0.3 0.4 0.5 0.6 0.7 0.8 0.9 1
R21
log P (d) P (d)
0 0.1 0.2 0.3 0.4 0.5 0.6 0.7
-0.6 -0.5 -0.4 -0.3 -0.2 -0.1 0
0.3 0.4 0.5 0.6 0.7 0.8 0.9 1
3 3.5 4 4.5 5 5.5
φ21c
0 0.1 0.2 0.3 0.4 0.5
-0.6 -0.5 -0.4 -0.3 -0.2 -0.1 0
0.3 0.4 0.5 0.6 0.7 0.8 0.9 1
R31
log P (d) P (d)
0 0.1 0.2 0.3 0.4 0.5
-0.6 -0.5 -0.4 -0.3 -0.2 -0.1 0
0.3 0.4 0.5 0.6 0.7 0.8 0.9 1
0.5 1 1.5 2 2.5 3 3.5 4 4.5 5
φ31c
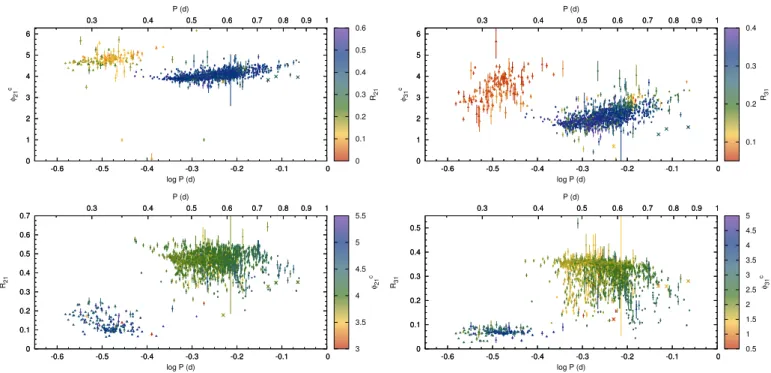
Fig. 3.Fourier parameters of the light curves of crossmatchedK2–Gaia RR Lyrae-type sources. Theith and the first Fourier harmonics are compared by theΦc21,Φc31relative phase differences (in radians, using cosine-based Fourier fits) and theR21,R31amplitude ratios, as a function of the periods (P). The colour coding shows the respectiveR21−Φc21andR31−Φc31pairs. Triangles: RRc stars, dots: RRab stars, crosses: potential anomalous Cepheid stars (see Sect. 4.2.2).
Sect. 4.4. Crossmatch results for both groups are listed in Ap- pendix A. We used theK2FoVtool to determine which stars fell on the CCD modules ofKeplerin each campaign (Mullally et al.
2016). Overall, 11 361 stars were observable during the selected campaigns, i.e. about 5% of the RR Lyrae variables identified in GaiaDR2. Most these are near the Bulge or the Sgr stream (9843 stars for Campaigns 2, 7, and 11) and only 1518 fell into the halo FoVs. We crossmatched these sources with theK2Ecliptic Plane Input Catalog (EPIC) and with the list of observed targets of the mission (Huber et al. 2016). TheK2observations contain various systematics caused by the excess motion of the space telescope, and multiple solutions were developed to correct for these. For the majority of the stars we used the official pipeline-produced Pre-Search Data Conditioned Simple Aperture Photometry (PD- CSAP) products (Stumpe et al. 2012). Where PDCSAP was not available or was of inferior quality, we used data from theK2Ex- tracted Lightcurves (or K2SFF), the EPIC Variability Extraction and Removal for Exoplanet Science Targets (EVEREST), and, in a few cases, theK2Planet candidates from OptimaL Aperture Reduction (POLAR) light curves (Vanderburg & Johnson 2014;
Luger et al. 2016; Barros et al. 2016). In a few cases, when none of the light curve solutions provided by MAST were useful, we applied thePyKEsoftware to generate Extended Aperture Pho- tometry to obtain better data (Plachy et al. 2017; Still & Barclay 2012; Vinícius et al. 2017). After selecting the best light curves for the stars from these sources, we generated an initial classifi- cation list.
The distribution of the RR Lyrae stars from theKeplerand K2 missions crossmatched with the Gaia DR2 candidates are plotted in Fig. 2, in equatorial coordinates.
For theK2observations, our validation procedure was based on both visual inspection and quantitative properties of the light curve shapes. We calculated the Fourier fits of the 5 strongest frequency components in the light curve using the codeLCFit (Sódor 2012). Then we calculated the relative Fourier parame-
ters, comparing theith and the first harmonics with amplitude ratiosRi1=Ai/A1and phase differencesΦci1 = Φci −iΦc1(where crefers to cosine-based Fourier fits), as defined by Simon & Lee (1981); Simon & Teays (1982). These terms are frequently used to classify pulsating variables and to separate various subclasses.
We plotted them as a function of period fori=2,3 in Fig. 3. The stars clearly separate into the RRab and RRc loci, with very few outliers (for comparison, we refer to Soszy´nski et al. 2009). We discuss some of the outliers in Sect. 4.2.2. The low quality of light curves in the dense stellar field of the Sgr stream prevented us to calculate Fourier parameters only in 6 cases. But because hints of RRab variability can be visually confirmed in them, we included these stars as positive detections.
To validate double-mode candidates, we also computed the period ratios of the two main modes of the RRd stars: these give strong constraints if the star is a normal or anomalous RRd star (Soszy´nski et al. 2016). These values, along with the analysis of all RRd stars observed in theK2mission, will be published in a separate paper (Nemec, priv. comm.).
3.1. Brightness comparison
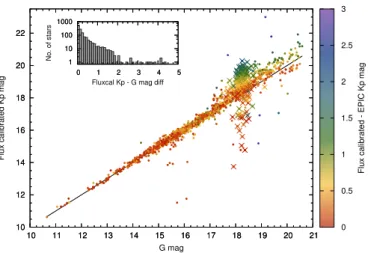
We compared theGaiaDR2 medianGbrightnesses provided in DR2 with the values obtained from theK2 data in Fig. 4. The passbands of the two missions are rather similar, withKepler spanning a 420–900 nm andGaiaa slightly wider 350–1000 nm wavelength range, both peaking around 600–700 nm (Van Cleve
& Caldwell 2016; Evans et al. 2018).
We computed the flux-calibrated brightnesses (Kpfc) of the K2stars from the PDCSAP light curves, using the zero point of 25.3 mag, as determined by Lund et al. (2015). The two measure- ments generally agree well, with 60% of the stars below 0.1 mag difference, although it exceeds 1 mag for about 10% of the tar- gets. The flux-calibrated magnitudes provide a better agreement withGaiathan the values found in EPIC (KpEPIC) up to about
10 12 14 16 18 20 22
10 11 12 13 14 15 16 17 18 19 20 21
Flux calibrated Kp mag
G mag 10
12 14 16 18 20 22
10 11 12 13 14 15 16 17 18 19 20 21 0
0.5 1 1.5 2 2.5 3
Flux calibrated - EPIC Kp mag
1 10 100 1000
0 1 2 3 4 5
No. of stars
Fluxcal Kp - G mag diff 1
10 100 1000
0 1 2 3 4 5
Fig. 4.Comparisons of theGaiaDR2 medianGmagnitudes and the flux-calibrated Kpmagnitudes from the K2 mission, with the insert showing the distribution of the absolute differences. Colour coding marks the absolute differences between the flux-calibratedKpvalues and those found in EPIC: there is a clear systematic difference between the twoKpvalues towards the faint end. Red outliers indicate agree- ment between theKpvalues but difference from theGaiabrightnesses.
Crosses mark the Sgr stream stars in Field 7. The black line marks equality.
G ≈ 18 mag. ForG > 18, as the colour coding in Fig. 4 il- lustrates, the flux-calibrated values appear to be systematically fainter than the EPIC values. These issues probably come from the properties of the PDCSAP pipeline (poor background cor- rection for dense fields and small pixel apertures for faint tar- gets). This is especially pronounced for the population of the Sgr stream stars, marked with crosses in Fig. 4.
For about 1% of the stars, theGaiabrightness differs signifi- cantly from the two nearly identicalKpvalues (|Kpfc–KpEPIC|<
0.1 mag, while|G–Kpfc|>1.0 mag). The cause of discrepancy in most of these cases is that the crossmatched EPIC actually refers to a close-by (within 1-3Keplerpixels), brighter star that is blended with the faint RR Lyrae variable. In these cases, the light curve also consists of the combined flux of the two stars.
Many of these G-Kp discrepant stars are also members of the Sgr stream.
4. Results
The two quantities we are most interested in are the purity, de- fined as the fraction of bona-fide variable stars of the appropri- ate class in the sample, and the completeness, defined as frac- tion of the sources (properly) identified inGaiaDR2 compared to all (known) RR Lyrae stars within the fields of view. We in- vestigated the distribution of stars according to the classification score, the number of GaiaFoV transits in theG band and the medianGbrightness.
4.1. RR Lyrae stars in the original Kepler field
We identified 48Gaiatargets that were observed byKeplerand we were able to confirm 44 of them as RR Lyrae variables, suggesting a purity of 92%. Beyond these 44 stars, 12 addi- tional RR Lyrae stars have been identified by the KASC Working Group in the Lyra-Cygnus field, not all of which are published yet, indicating a completeness of 78%. One of the stars that is missing from the DR2 RR Lyrae sample is RR Lyr itself (as ex- plained in Rimoldini et al., in preparation), which was observed
in the original FoV ofKepler(Kolenberg et al. 2011). (RR Lyr is present in DR2, but with an erroneous meanGbrightness and parallax values (Gaia Collaboration et al. 2018).)
After checking the targeted observations, we created FFI light curves for a further 267 stars. We were able to classify 147 and 38 of them as (potential) RRab or RRc variables. The pho- tometry of some 10 further targets was not successful as they were either near the edges of a CCD module or were blended with bright stars: we did not include these in our statistics. Com- bined with the LC targets discussed above, we can provide a lower-limit estimate of at least 75% for the purity of theKepler field, although the low value can partially be attributed to the sparse FFI data we used. The completeness of the sample rises to 96%, if we include the stars confirmed by the FFI light curves.
A more detailed analysis of the FFI sample will be published elsewhere (Molnár & Hanyecz, in prep.).
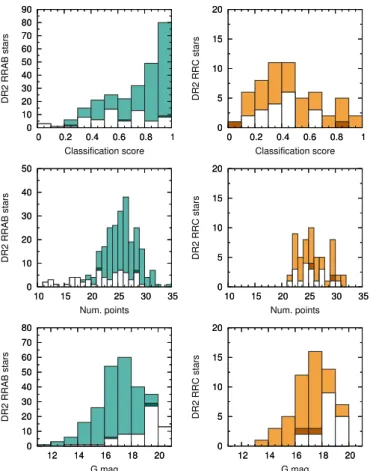
The distribution of the stars in the original Kepler field against the classification scores, the number of Gaia G-band FoV transits, and the medianGbrightnesses are shown in Fig. 5.
There is very little cross-contamination between the RRAB and RRC classes (stars that we classified into a different type). Con- tamination from sources that we could not confirm as RR Lyrae variables is significant among stars that have low coverage and/or are faint (G > 18 mag). However, this can be partially attributed to the FFI photometry that was not developed to han- dle very faintKeplertargets. Purity of the FFI sample is 90% or 85% if we limit the targets toG < 18 orG < 19 mag, respec- tively.
4.2. RR Lyrae stars in the K2 fields
Overall, we were able to inspect the light curves of 1395 K2 targets. The distribution of the observed stars is not uniform: the 601 stars from Campaigns 2, 7, and 11 represent only 6% of the 9843 observable targets, whereas for the halo fields the ratio is 52% (790/1518).
Of these 1395 stars, we confirmed the RR Lyrae-type vari- ability of 1371 stars (1243 RRAB, 141 RRC, and 10 RRD sources). No data was available for the 5 ARRD-type stars that were within theK2fields of view. The remaining 24 observed stars turned out to be different types of variables. These num- bers lead to a DR2 purity of 98%, in agreement with those of the targeted observations of the original Lyra-Cygnus field, and the findings of Holl et al. (2018). However, we emphasize again that the stellar sample of theK2campaigns are not necessarily repre- sentative of the population in the FoV, therefore the we treat the purity value as an upper limit. We discuss the range of possible purity values in Sect. 4.3 in more detail.
Although theK2photometric data are superior to other sur- veys, the observed sample is not exhaustive, so we can only pro- vide an estimate for the completeness of theGaiaDR2 classi- fications. Targets proposed for observation in theK2campaigns were crossmatched from various surveys, and vetted based on the available photometry in the literature, and as such, are more complete than any single catalog we could use (Plachy et al.
2016). Light curves gathered byKeplerbased on those proposals were also checked visually, and they revealed very low level of contamination by other variables. Therefore we considered the number of proposed and observed stars to be a good estimate for true RR Lyrae in the fields of view. We then collected all stars that were proposed and observed during the mission but had no counterparts inGaiaDR2 RR Lyrae classifications. We ended up with 445 targets, leading to a completeness estimate of 75% for theK2fields. This is somewhat higher than the values computed
0 10 20 30 40 50 60 70 80 90
0 0.2 0.4 0.6 0.8 1
DR2 RRAB stars
Classification score 0
10 20 30 40 50 60 70 80 90
0 0.2 0.4 0.6 0.8 1 0
5 10 15 20
0 0.2 0.4 0.6 0.8 1
DR2 RRC stars
Classification score 0
5 10 15 20
0 0.2 0.4 0.6 0.8 1
0 10 20 30 40 50
10 15 20 25 30 35
DR2 RRAB stars
Num. points 0
10 20 30 40 50
10 15 20 25 30 35 0
5 10 15 20
10 15 20 25 30 35
DR2 RRC stars
Num. points 0
5 10 15 20
10 15 20 25 30 35
0 10 20 30 40 50 60 70 80
12 14 16 18 20
DR2 RRAB stars
G mag 0
10 20 30 40 50 60 70 80
12 14 16 18 20 0
5 10 15 20
12 14 16 18 20
DR2 RRC stars
G mag 0
5 10 15 20
12 14 16 18 20
Fig. 5. Historgrams of the RRAB- and RRC-classified objects (in light/dark green and brown/orange, respectively) in the originalKepler field. The light hues mark stars that were confirmed as RRab or RRc variables, while dark hues are RR Lyrae stars in an incorrect RR Lyrae subclass in DR2 (e.g., RRc variables in the RRAB class). White indi- cates stars that we could not confirm as RR Lyrae variables.
0 50 100 150 200
10 12 14 16 18 20 22
K2-Gaia common stars
Kp mag 0
50 100 150 200
10 12 14 16 18 20 22 0 50 100 150 200
10 12 14 16 18 20 22
K2-only stars
Kp mag 0
50 100 150 200
10 12 14 16 18 20 22
Fig. 6.Brightness distribution of the stars that we identified as RR Lyrae variables in the K2measurements, in theKpband. The distributions of these RR Lyrae stars that are classified as RR Lyrae or not in the GaiaDR2 classification table are shown in the left- or right-hand panels, respectively.
for the OGLE fields (Holl et al. 2018), but agrees with our es- timate for targeted observations in the originalKeplerfield. We plotted the brightness distribution of the confirmed and missed RR Lyrae stars in Fig. 6: the two distributions are fairly similar, but the maximum is shifted towards fainter magnitudes for the stars that are not classified as RR Lyrae in theGaiaDR2 classi- fication table.
4.2.1. RR Lyrae subclass statistics
Of the 1371 identified RR Lyrae stars, 1211 (88%) were found to be RRab, 142 (10%) to be RRc, 17+1 to be to be RRd and anomalous RRd stars (1%), based on theirK2light curves. Our classifications do not always agree with those of Gaia DR2, so we crossmatched the Gaia DR2 RR Lyrae subclasses with the ones we assigned to the stars. The GaiaDR2 RRAB class was found to be nearly pure, with only 1% (14/1243) of con- tamination from the other classes (stars that turned out to be RRc- or RRd-type pulsators instead). The cross-contamination in the RRC and RRD classes was found to be at the levels of 8% (12/142) and 50% (5/10), respectively. While the cross- contamination rises significantly for these classes, they are much less numerous, therefore the overall rate is only about 2% for the RR Lyrae stars in general.
Finally, out of the 24 stars we could not confirm as RR Lyrae variables,K2light curves of 5 RRAB members revealed Cepheid variations (1 anomalous and 4 Type II Cepheids). This indicates a low level of cross-contamination between the RR Lyrae and Cepheid classes as well. We reclassify two of these, V1637 Oph (EPIC 234649037, PK2 =1.327 d), previously classified as an RR Lyrae, and FZ Oph (EPIC 251248334,PK2 =1.500 d), an under-observed variable, as short-period Type II Cepheids, also known as BL Her-type stars, based on theirK2light curves.
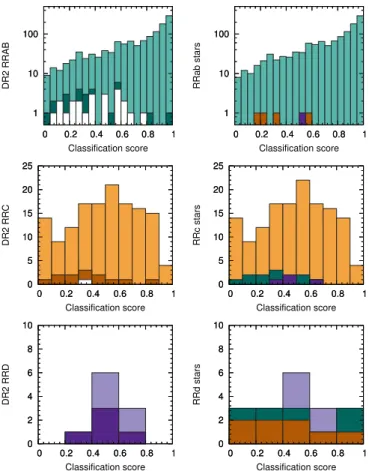
Fig. 7 shows the distribution of the classification scores for the various RR Lyrae subclasses. The left panels group the stars according to theirGaiaDR2 classification types. We indicated the portion of stars we reclassifiedfromthese classes with darker hues. The right panels show the variability types based on the K2light curves, with the same colours denoting the number of stars that we reassignedtoa different RR Lyrae subclass. The difference between the classification score distributions of RRab and RRc/RRd stars is striking: half of the RRab stars have scores above 0.8, while the distribution of the RRc and RRd stars is essentially flat, and for RRc stars it falls offnear 1.0. Figure 7 also confirms that the RRab sample is nearly pure (almost all stars are from the RRAB class), while the RRd sample includes Gaiaclassifications of all three subclasses. For the RRc stars, the sample appears to be nearly pure above classification score 0.6, and about 15% of RRc stars with scores<0.6 ended up in the RRAB or RRD classes of theGaiaDR2 classification.
The distributions of the median brightnesses in theGband of the three RR Lyrae subclasses are shown in Fig. 8. Con- trary to the distribution from the original Kepler field, we do not see an increase of unconfirmed variables towards the faint end, as they appear rather evenly spread. Interestingly, RRc stars brighter thanG ∼ 15 mag seem to be missing from our par- ticular selection ofGaiaDR2 classifications (centre-left panel), although we reclassified a few of them from the other subclasses (centre-right panel).
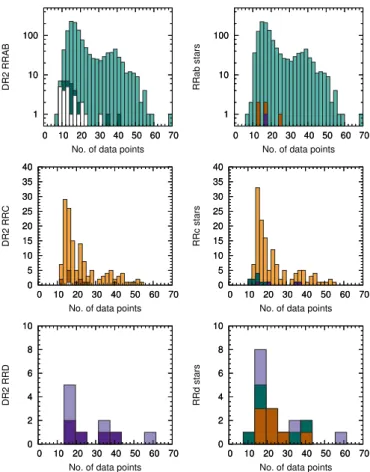
Finally, Fig. 9 shows the distribution of stars according to the number ofG-band observations, per RR Lyrae subclass. Here, the unconfirmed variables clearly group at the low end, espe- cially for the RRAB class. For stars with 20 FoV transits or less, the contamination is about 3%, and for the few stars be- low 12 FoV transits, it rises to 8%. These numbers indicate that the GaiaDR2 sample of RR Lyrae classifications is relatively pure even for stars with few observations.
These estimates illustrate that the classifications of Gaia DR2 are already well-suited to identify single-mode pulsators, even at low numbers of FoV transits, but multiperiodic objects like RRd stars will need more extended observations.
1 10 100
0 0.2 0.4 0.6 0.8 1
DR2 RRAB
Classification score 1
10 100
0 0.2 0.4 0.6 0.8 1
1 10 100
0 0.2 0.4 0.6 0.8 1
RRab stars
Classification score 1
10 100
0 0.2 0.4 0.6 0.8 1
0 5 10 15 20 25
0 0.2 0.4 0.6 0.8 1
DR2 RRC
Classification score 0
5 10 15 20 25
0 0.2 0.4 0.6 0.8 1 0 5 10 15 20 25
0 0.2 0.4 0.6 0.8 1
RRc stars
Classification score 0
5 10 15 20 25
0 0.2 0.4 0.6 0.8 1
0 2 4 6 8 10
0 0.2 0.4 0.6 0.8 1
DR2 RRD
Classification score 0
2 4 6 8 10
0 0.2 0.4 0.6 0.8 1 0 2 4 6 8 10
0 0.2 0.4 0.6 0.8 1
RRd stars
Classification score 0
2 4 6 8 10
0 0.2 0.4 0.6 0.8 1
Fig. 7.Distribution of the various classification scores of the RR Lyrae subtypes. Left: according to theGaiaDR2 classification type; right: as classified by theK2data. The distribution is skewed towards score val- ues of 1.0 for RRab stars but is flat for RRc and RRd stars. Light green, orange and light lilac colours mark bona-fide RRab, RRc, RRd stars, respectively. Dark green, brown and dark lilac colours denote stars that we classified into a different subclass (which are distributed in different panels on the right-hand side). White bars refers to the counts of stars for which the RR Lyrae variability was not confirmed nor rejected. The scale of counts is logarithmic for the RRAB/RRab stars.
4.2.2. Ambiguous identifications
As mentioned in Sect. 3, the Fourier parameters in Fig. 3 mostly separate the stars into two groups corresponding to RRab- and RRc-type stars, but we found a few stars that we could not classify unambiguously. We flagged four stars as potential anomalous Cepheids: three fundamental-mode and one first-overtone candidates. However, the Fourier parame- ters of anomalous Cepheids overlap with those of RRab stars for certain period ranges, and therefore we could not rule out that these four objects are RRab stars based on their light curve shapes alone. These four stars are identified in K2 as EPIC 206010651, 206175324, 212459957, and 234523936 (the last one is the overtone candidate), corresponding toGaiaDR2 source_id 2600030303142307968, 2614960399737036672, 3606980678405498368, and 4134356134978875904, respec- tively.
Some outliers of the distribution ofΦc21 in Fig. 3 can be at- tributed to a peculiar group of modulated RRab stars that exhibit a strong Blazhko effect, with a full rotation in theΦci1parameters during the minimum-amplitude cycle (Guggenberger et al. 2012;
Bódi et al. 2018). This phenomenon could shift the average value of the parameters when the duration of the light curve is compa- rable to the modulation period. This is the case, for example, for
1 10 100
10 12 14 16 18 20
DR2 RRAB
G mag 1
10 100
10 12 14 16 18 20
1 10 100
10 12 14 16 18 20
RRab stars
G mag 1
10 100
10 12 14 16 18 20
0 5 10 15 20 25 30 35
10 12 14 16 18 20
DR2 RRC
G mag 0
5 10 15 20 25 30 35
10 12 14 16 18 20 0
5 10 15 20 25 30 35
10 12 14 16 18 20
RRc stars
G mag 0
5 10 15 20 25 30 35
10 12 14 16 18 20
0 2 4 6 8 10
10 12 14 16 18 20
DR2 RRD
G mag 0
2 4 6 8 10
10 12 14 16 18 20 0
2 4 6 8 10
10 12 14 16 18 20
RRd stars
G mag 0
2 4 6 8 10
10 12 14 16 18 20
Fig. 8.Distribution of the medianGmagnitudes per RR Lyrae subtype.
The colour coding is the same as in Fig. 7.
EPIC 245954410, with logP/d = −0.29 andΦc21 = 6.16 rad, and for EPIC 212545143, an extremely modulated RRab star with logP/d = −0.27 andΦc21 = 0.99 rad. We note that two other stars at lowΦc21but with shorter periods are not flagged as outliers. Although most RRc stars appear in a tight group, oth- ers spread out from 0 to 2π, and these two stars represent that subgroup of RRc stars.
4.3. RR Lyrae completeness and purity ranges
The observations of the two missions ofKeplerprovide differ- ent samples that are not straightforward to combine, and provide diverse results. Herein we go through the various samples and statistics obtained, and their relation to each other. One can fo- cus on the originalKeplerfield where the combination of the tar- geted, continuous light curves and the FFI photometry provides a sample that is not biased by prior selection of targets, but hin- dered by the sparse nature of the FFI light curves. Alternatively, one can gather all targeted observations from the two missions that provide a larger sample, and are based on the same data acquisition method. Finally, we can calculate purity and com- pleteness values for all three samples (Kepler,KeplerFFI, and K2) combined. Through these combinations we provide a range of estimates, which are summarized in Table 1.
Overall, we were able to identify 0.9% of the RR Lyrae vari- ables classified by Rimoldini et al. (in preparation) in the ob- servations of the two missions of Kepler, outside the Bulge, and 15% of the observable sources within the fields of view.
(1706 stars out of 11 702 potential, observable targets from the two missions.) But, as stated above, the actual coverage is much
1 10 100
0 10 20 30 40 50 60 70
DR2 RRAB
No. of data points 1
10 100
0 10 20 30 40 50 60 70
1 10 100
0 10 20 30 40 50 60 70
RRab stars
No. of data points 1
10 100
0 10 20 30 40 50 60 70
0 5 10 15 20 25 30 35 40
0 10 20 30 40 50 60 70
DR2 RRC
No. of data points 0
5 10 15 20 25 30 35 40
0 10 20 30 40 50 60 70 0 5 10 15 20 25 30 35 40
0 10 20 30 40 50 60 70
RRc stars
No. of data points 0
5 10 15 20 25 30 35 40
0 10 20 30 40 50 60 70
0 2 4 6 8 10
0 10 20 30 40 50 60 70
DR2 RRD
No. of data points 0
2 4 6 8 10
0 10 20 30 40 50 60 70 0 2 4 6 8 10
0 10 20 30 40 50 60 70
RRd stars
No. of data points 0
2 4 6 8 10
0 10 20 30 40 50 60 70
Fig. 9.Distribution of the number of field-of-view transits in theGband per RR Lyrae subtype. The colour coding is the same as in Fig. 7.
higher for the originalKeplerFoV (near-complete) and the halo fields in theK2mission (52%).
For theKeplerand/orK2targeted observations, we derived a purity rate between 92–98% (with lower limits at 51% and 75%), and a completeness in the range of 70−78%. The com- pleteness is estimated by simply comparing the number of cross- matched and confirmedGaiasources to those also in the fields but not classified as RR Lyrae variables inGaiaDR2. The low- est completeness value of 70% here is reached if we only use the targeted observations but count the FFI stars among the missed ones (even though they were not known before DR2). The K2 fields themselves have a completeness of 75%, while the com- bination of all data sets leads to an overall completeness rate of 78%.
We obtained a very high completeness ratio of 96% for the original Keplerfield, if the FFI stars are included. The lack of further sources here can be attributed to the fact that the field is at low Galactic latitudes and thus was largely avoided by deep sur- veys that could have identified faint RR Lyraes there. Therefore, the high completeness in this field reflects our limited knowledge that has now been expanded by theGaiaDR2 identifications, so we consider this value as an upper limit.
Even more diverse limits can be derived for the purity. The estimate of 92% originates from the targeted Kepler observa- tions, but that sample alone is much smaller than the rest. Both theK2and combinedKepler+K2observations show 98% purity.
This is in broad agreement with the findings of Holl et al. (2018).
We concluded that the single-mode group RRAB is nearly pure whereas the RRC group suffers from some contamination, but most of the confusing sources are RRd stars, and not eclipsing
Table 1.Completeness and purity values for the RR Lyrae and Cepheid stars inGaiaDR2, based on theKeplerandK2light curves. Absolute lower limits of purity rates (from the worst-case scenario in the haloK2 fields) are indicated in brackets.
Type Data Gaiamatches Compl. Purity
RRL Kepler 48 78% 92%
RRL Kepler+FFI 311 <96% >75%
RRL K2 1395 75% (51–)98%
RRL Kepler+K2 1443 70–76% (51–)98%
RRL All 1706 78% (55–)94%
CEP All 41 ∼66%
binaries.GaiaDR2 all-sky classifications are not well-suited yet to identify double-mode (RRd) stars, but as those are intrinsi- cally rare, they have little effect on the overall population statis- tics.
The inclusion of the FFI stars, however, warns us that the Kepler and K2 samples might include some bias against con- taminating sources in GaiaDR2 that have not been proposed for observation in theKepler andK2 missions. The combined statistics from the original field gives us a lower limit of 75% for purity, although this value is likely affected by faint RR Lyrae sources whose FFI photometry was of insufficient quality.
Of course, the Kepler+FFI sample is disjunct from theK2 FoVs, but it is the only one without prior selection bias. Nev- ertheless, a simple lower limit can be estimated forK2as well, considering that in halo fields 52% of theGaiasources were ob- served with 98% purity. Even if all the remaining 48% were false positives, this sets an absolute lower limit of 51% for the purity in the Galactic halo. The combination of halo and original-field stars raises that limit slightly to 55%.
4.4. Cepheids in the Kepler and K2 data
All types of Cepheids are much less numerous than RR Lyrae stars, and many of them populate the Galactic Bulge, the Mag- ellanic Clouds, and the disk of the Milky Way. TheKeplerand K2missions largely avoided these areas to prevent source con- fusion and blending, therefore the overlap between these mis- sions and the Cepheids inGaiaDR2 is much more limited than it was for the RR Lyrae stars. Because of the low number of targets, we decided to include the Bulge stars in our statistics.
Since Cepheids are intrinsically luminous, their variations can be recognized even when blended with other stars in theKepler observations.
In the Lyra-Cygnus field of the originalKeplermission,Gaia DR2 classifications correctly include V1154 Cyg as CEP and HP Lyr as T2CEP (which is a potential RV Tau star, Graczyk et al. 2002), while it missed DF Cyg and misclassified V677 Lyr as T2CEP (known to be a longer-period semiregular variable, Gorlova et al. 2015).
In theK2fields, 73 stars classified as Cepheids inGaiaDR2 were observable. Of these, we found data for 38 from the three subclasses (3 ACEP, 13 CEP, and 22 T2CEP stars), of which we were able to confirm 20 as a members of the Cepheid family, and 5 more as likely Cepheid stars. Given the small sample size, we did not separate the stars further into subclasses. With the inclusion of the stars from the RRAB class that we classified as Cepheids, the number of Cepheid variables common between Kepler/K2andGaiais 32 stars (2 from Keplerand 25+5 from K2).
0°
90°
180°
270°
360°
+36°
-36°
+90°
-90°
5 10 15 20 25 30 35 40 45 50
No. of data points
Fig. 10.The distribution in the sky of various Cepheid-type stars from theGaiaDR2 classifications crossmatched withKeplerand K2mea- surements. Crosses mark stars the we rejected or were not able to con- firm: half of these are at high Galactic latitudes. The notation is the same as in Fig. 2.
The stars we were not able to confirm as Cepheids include 4 eclipsing binaries and/or rotational variables, 5 long-period variables, and 4 stars with unidentified variations. We classified 1 star as an RRab variable, further confirming a low level of cross-identification between Cepheids and RR Lyrae stars. This star was included in a K2proposal as an RR Lyrae target, and thus it has been accounted for in our completeness estimate.
We were able to inspect the light curves of 54% (41/76) of the stars that fell into the fields of view of the two missions. The stars identified in the twoKeplermissions account for only 0.9%
(observable) and 0.5% (observed) of the 8550 Cepheid variables identified by Rimoldini et al. (in preparation). However, most of the DR2 detections concentrate in the Magellanic Clouds, there- fore our results are more relevant for the Cepheid population in the Milky Way. The findings indicate a purity in the order of 66% for this size-limited sample. Considering the very low num- ber of sources available to us, and the limited temporal coverage of theK2data, this result is more or less in agreement with the 15% contamination in the sky-uniform test results of Holl et al.
(2018).
5. Conclusions
TheGaiaData Release 2 features a large collection of variable star identifications, but many of these are based on a low number of observations only. RR Lyrae and Cepheid stars, in particular, are used for many studies, such as mapping the substructures and populations of the Milky Way and the Magellanic Clouds.
TheKeplerspace telescope observed a selection of these targets in great detail within theKeplerandK2missions, matching the depth ofGaiaDR2, and the continuous light curves provide a great opportunity to validate the classifications. We investigated the targets in common between the two space telescopes that include 0.9% of variable stars from the all-sky classification of DR2 (Rimoldini et al., in preparation) for both groups of stars, and 15% and 54% of the variables from the catalog that fell into theKepler andK2fields of view (between Campaigns 0-8 and 11-13) for RR Lyrae and Cepheid stars, respectively. We also extracted sparse photometry from the Full Field Images of the original field of view.
We found that the photometry inGaiaDR2 is already suit- able to properly identify single-mode pulsators. The RRAB class was found to be nearly pure, with very few contaminants. The RRC class and the various Cepheid classes are somewhat more contaminated. The few RRD (double-mode) stars we found in- cluded single-mode pulsators as well, and bona-fide RRd stars
haveGaiaDR2 classifications from all RR Lyrae subclasses, in- dicating that reliable identification of multimode pulsators will require more observations. Overall, we found the purity to be in the 92–98% range, based on the targeted observations of theKe- plerspace telescope, with lower limits of 75% (FFI stars) and 51% (worst-case scenario for the haloK2fields). For the classi- fication of Cepheids inGaiaDR2, we provide a purity estimate in the order of 66%.
Based on the visual examination of the contaminating sources (stars that were not found to be RR Lyrae or Cepheid stars), we concluded that contaminants were more likely to be pulsators or rotational variables than eclipsing binaries.
We estimated the completeness of theGaiaDR2 RR Lyrae classifications in theKeplerandK2fields to be around 70-78%
for the targeted observations with an upper limit of 96% for the original field, if we included the FFI stars as well.
All of the estimates presented here are summarized in Ta- ble 1 and they are in agreement with the limited validation tests presented in Holl et al. (2018), indicating that the observations of theKeplerspace telescope can indeed be used to validate sur- veys that collect sparse photometry.
Acknowledgements. This research received funding from the Hungarian Academy of Sciences through the Lendület Programme LP2014-17 and the János Bolyai Research Scholarship (L.M. and E.P.); the Hungarian National Research, Development, and Innovation Office through the NKFIH grants K- 115709, PD-116175, and PD-121203; and the ÚNKP-17-3 program of the Min- istry of Human Capacities of Hungary (Á.L.J.). This work has made use of data from the European Space Agency (ESA) missionGaia(https://www.
cosmos.esa.int/gaia), processed by theGaiaData Processing and Anal- ysis Consortium (DPAC,https://www.cosmos.esa.int/web/gaia/dpac/
consortium). Funding for the DPAC has been provided by national institutions, some of which participate in the Gaia Multilateral Agreement, which include, for Switzerland, the Swiss State Secretariat for Education, Research and Inno- vation through the ESA Prodex program, the “Mesures d’accompagnement", the
“Activités Nationales Complémentaires", and the Swiss National Science Foun- dation. This paper includes data collected by theKeplermission. Funding for the KeplerandK2missions are provided by the NASA Science Mission Directorate.
TheKepler/K2data presented in this paper were obtained from the Mikulski Archive for Space Telescopes (MAST). STScI is operated by the Association of Universities for Research in Astronomy, Inc., under NASA contract NAS5- 26555. Support for MAST for non-HST data is provided by the NASA Office of Space Science via grant NNX09AF08G and by other grants and contracts. We thank Benjamin Montet the fruitful discussions about thef3code.
References
Barros, S. C. C., Demangeon, O., & Deleuil, M. 2016, A&A, 594, A100 Beaton, R. L., Freedman, W. L., Madore, B. F., et al. 2016, ApJ, 832, 210 Benk˝o, J. M., Kolenberg, K., Szabó, R., et al. 2010, MNRAS, 409, 1585 Benk˝o, J. M., Plachy, E., Szabó, R., Molnár, L., & Kolláth, Z. 2014, ApJS, 213,
31
Bódi, A., Molnár, L., Plachy, E., & Szabó, R. 2018, in The RR Lyrae 2017 Con- ference, Proc. Polish Academy of Sciences
Bódi, A., Szatmáry, K., & Kiss, L. L. 2016, A&A, 596, A24 Borucki, W. J. 2016, Reports on Progress in Physics, 79, 036901 Borucki, W. J., Koch, D., Basri, G., et al. 2010, Science, 327, 977
Brown, T. M., Latham, D. W., Everett, M. E., & Esquerdo, G. A. 2011, AJ, 142, 112
Chambers, K. C., Magnier, E. A., Metcalfe, N., et al. 2016, ArXiv e-prints [arXiv:1612.05560]
Clementini, G., Ripepi, V., Molinaro, R., et al. 2018, ArXiv e-prints [arXiv:1805.02079]
Derekas, A., Plachy, E., Molnár, L., et al. 2017, MNRAS, 464, 1553 Drake, A. J., Catelan, M., Djorgovski, S. G., et al. 2013, ApJ, 763, 32 Drake, A. J., Djorgovski, S. G., Mahabal, A., et al. 2009, ApJ, 696, 870 Evans, D. W., Riello, M., De Angeli, F., et al. 2018, A&A [arXiv:1804.09368]
Gaia Collaboration, Brown, A. G. A., Vallenari, A., et al. 2018, ArXiv e-prints [arXiv:1804.09365]
Gorlova, N., Van Winckel, H., Ikonnikova, N. P., et al. 2015, MNRAS, 451, 2462 Graczyk, D., Mikolajewski, M., Leedjarv, L., et al. 2002, Acta Astron., 52, 293 Guggenberger, E., Kolenberg, K., Nemec, J. M., et al. 2012, MNRAS, 424, 649
Hernitschek, N., Schlafly, E. F., Sesar, B., et al. 2016, ApJ, 817, 73
Holl, B., Audard, M., Nienartowicz, K., et al. 2018, ArXiv e-prints [arXiv:1804.09373]
Howell, S. B., Sobeck, C., Haas, M., et al. 2014, PASP, 126, 398 Huber, D., Bryson, S. T., Haas, M. R., et al. 2016, ApJS, 224, 2
Juhász, A. L. & Molnár, L. 2018, in The RR Lyrae 2017 Conference, Proc. Polish Academy of Sciences
Kolenberg, K., Bryson, S., Szabó, R., et al. 2011, MNRAS, 411, 878 Leavitt, H. S. 1908, Annals of Harvard College Observatory, 60, 87 Luger, R., Agol, E., Kruse, E., et al. 2016, AJ, 152, 100
Lund, M. N., Handberg, R., Davies, G. R., Chaplin, W. J., & Jones, C. D. 2015, ApJ, 806, 30
Minniti, D., Dékány, I., Majaess, D., et al. 2017, AJ, 153, 179
Molnár, L. 2018, Proc. Polish Academy of Sciences [arXiv:1803.10026]
Molnár, L., Pál, A., Plachy, E., et al. 2015, ApJ, 812, 2
Montet, B. T., Tovar, G., & Foreman-Mackey, D. 2017, ApJ, 851, 116 Moskalik, P., Smolec, R., Kolenberg, K., et al. 2015, MNRAS, 447, 2348 Mullally, F., Barclay, T., & Barentsen, G. 2016, K2fov: Field of view software
for NASA’s K2 mission, Astrophysics Source Code Library Nemec, J. M., Cohen, J. G., Ripepi, V., et al. 2013, ApJ, 773, 181
Plachy, E., Klagyivik, P., Molnár, L., Sódor, Á., & Szabó, R. 2017, in European Physical Journal Web of Conferences, Vol. 160, TASC2–KASC9 Workshop
& SPACEINN–HELAS8 Conference, 04009
Plachy, E., Molnar, L., Szabo, R., Kolenberg, K., & Banyai, E. 2016, in Comm.
Konkoly Obs., Vol. 105, RRL2015: High-Precision Studies of RR Lyrae Stars, ed. L. Szabados, R. Szabó, & K. Kinemuchi, 19–22
Ricker, G. R., Vanderspek, R., Winn, J., et al. 2016, in Proc. SPIE, Vol. 9904, Space Telescopes and Instrumentation 2016: Optical, Infrared, and Millimeter Wave, 99042B
Sesar, B., Ivezi´c, Ž., Stuart, J. S., et al. 2013, AJ, 146, 21 Simon, N. R. & Lee, A. S. 1981, ApJ, 248, 291 Simon, N. R. & Teays, T. J. 1982, ApJ, 261, 586 Sódor, A. 2012, Konkoly Obs. Occ. Techn. Notes, 15, 1
Soszy´nski, I., Smolec, R., Dziembowski, W. A., et al. 2016, MNRAS, 463, 1332 Soszy´nski, I., Udalski, A., Szyma´nski, M. K., et al. 2009, Acta Astron., 59, 1 Soszy´nski, I., Udalski, A., Szyma´nski, M. K., et al. 2017, Acta Astron., 67, 103 Still, M. & Barclay, T. 2012, PyKE: Reduction and analysis of Kepler Simple
Aperture Photometry data, Astrophysics Source Code Library Stumpe, M. C., Smith, J. C., Van Cleve, J. E., et al. 2012, PASP, 124, 985 Szabó, R., Kolenberg, K., Molnár, L., et al. 2017, in European Phys. Journal
Web of Conf., Vol. 160, TASC2–KASC9 Workshop & SPACEINN–HELAS8 Conference, 04004
Van Cleve, J. E. & Caldwell, D. A. 2016, Kepler Instrument Handbook, Tech.
rep.
Vanderburg, A. & Johnson, J. A. 2014, PASP, 126, 948
Vega, L. D., Stassun, K. G., Montez, Jr., R., Boyd, P. T., & Somers, G. 2017, ApJ, 839, 48
Vinícius, Z., Barentsen, G., Gully-Santiago, M., et al. 2017, KeplerGO/PyKE
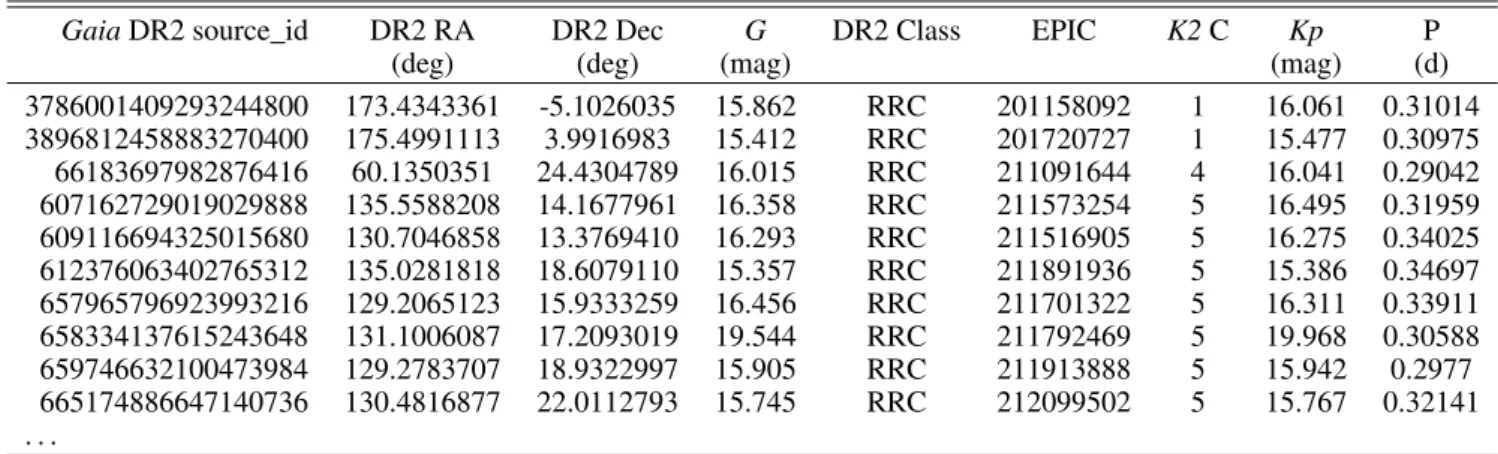
Appendix A:GaiaDR2 and KIC/EPIC crossmatch In the following tables, we provide the crossmatch of the sources in common between GaiaDR2 classifications and the Kepler andK2observations. Tables A.1, A.2, and A.3 list stars from the originalKepler FoV that we classified as RRab, RRc, or likely RRab/RRc variables. Tables A.4, A.5, and A.6 include the RRab, RRc, and RRd stars identified in the K2 observations, respec- tively. Longer tables are available online in full length. Table A.7 lists the crossmathed Cepheid-type stars. Finally, stars that we rejected as RR Lyrae or Cepheid stars based on theirK2data are presented in Tables A.8 and A.9.