Revisiting the Kepler non-Blazhko RR Lyrae sample:
Cycle-to-cyle variations and additional modes
J´ ozsef M. Benk˝ o
1?, Johanna Jurcsik
1, Aliz Derekas
2,11Konkoly Observatory, MTA CSFK, Konkoly Thege M. u. 15-17., H-1121 Budapest, Hungary
2ELTE E¨otv¨os Lor´and University, Gothard Astrophysical Observatory, Szent Imre herceg u. 112., H-9704 Szombathely, Hungary
Accepted 2019 March 18. Received 2019 March 9; in original form 2019 February 14
ABSTRACT
We analyzed the long and short cadence light curves of theKepler non-Blazhko RRab stars. We prepared the Fourier spectra, the Fourier amplitude and phase variation functions, time-frequency representation, the O−C diagrams and their Fourier con- tents. Our main findings are: (i) All stars which are brighter a certain magnitude limit show significant cycle-to-cycle light curve variations. (ii) We found permanently ex- cited additional modes for at least one third of the sample and some other stars show temporarily excited additional modes. (iii) The presence of the Blazhko effect was carefully checked and identified one new Blazhko candidate but for at least 16 stars the effect can be excluded. This fact has important consequences. Either the cycle-to- cycle variation phenomenon is independent from the Blazhko effect and the Blazhko incidence ratio is still much lower (51%-55%) than the extremely large (>90%) ratio published recently. The connection between the extra modes and the cycle-to-cycle variations is marginal.
Key words: stars: oscillations – stars: variables: RR Lyrae – methods: data analysis – space vehicles
1 INTRODUCTION
When the first pulsating variable stars were discovered at the end of the 19th century, seeing their accurately repeti- tive light curves, it was even suggested that they could be the basis of the time measurement as standard oscillators.
The discovery of incredible accuracy of the atomic vibra- tion frequencies made all such suggestions of the past. With the development of stellar pulsation and evolution theories it became evident that the periods of pulsating variables are changing during their evolution. This type of variation was intensively searched in the first half of the past cen- tury. The main tool of this work was the O−C diagram (see Sterken 2005 and references therein). The decades or century-long diagrams of RR Lyrae stars, however, yielded rather controversial results. Only the smaller part of the in- vestigated stars showed evolution origin period change, the larger part showed irregular large amplitude period varia- tions (e.g.Szeidl 1965,1973;Barlai 1989).
A possible explanation of this finding was the sum up of the small random changes of the pulsation cycles. In other words: we see random walk in O−C diagrams (Bal´azs-Detre
& Detre 1965;Koen 2006). Later, several authors suggested
? E-mail: benko@konkoly.hu
possible irregular changes in the period of the classic radi- ally pulsating variables (Cepheids and RR Lyrae type) on various theoretical bases (Sweigart & Renzini 1979;Deasy &
Wayman 1985;Cox 1998). These ideas, however, have never been included into any standard pulsation codes.
The more recent and more extended period change stud- ies of RR Lyrae stars in the Galactic field and globular clus- ters (Le Borgne et al. 2007;Jurcsik et al. 2001,2012;Szeidl et al. 2011) came to the conclusion that most of the non- Blazhko stars show smooth evolution origin period changes while Blazhko stars have large amplitude short time-scale ir- regular period fluctuations. The possibility of cycle-to-cycle variation of the non-Blazhko stars has been removed from the agenda.
The first direct detection of a random period jitter of V1154 Cyg, the only classical Cepheid of the originalKepler field (Derekas et al. 2012,2017), however, changed the sit- uation. A similar phenomenon was suspected for CM Ori a mono-periodic (non-Blazhko) RR Lyrae star observed by the CoRoTspace telescope (Benk˝o et al. 2016). In both cases the detected period variations were about some thousandths or ten thousandths of the pulsation periods. The earth-based observation typically neither precise nor well-covered enough to discover such a small random period fluctuations. They need to be not only precise and uninterrupted but high ca-
arXiv:1903.08427v1 [astro-ph.SR] 20 Mar 2019
dence data as well. Might be, this is the reason whyNemec et al.(2011) systematic stability analysis on the non-Blazhko stars of the Keplerfield resulted in a null result: the used long cadence (LC, ∼29 min sampled) Kepler observations were too sparse to detect such tiny variations. While the CoRoTandK2Cepheids’ light curves are too short (Poretti et al. 2015)Keplershort cadence RR Lyrae data are promis- ing for searching the effect. This paper presents the investi- gations of RR Lyrae stars in theKeplerfield based on the short cadence observations completed with some connecting analysis using the long cadence data.
2 THE SAMPLE AND ITS DATA
We used the non-Blazhko sample observed in the original Keplerfield. The latest detailed work on this sample wasNe- mec et al.(2013) who listed 21 non-Blazhko RRab stars. In the meanwhile the Blazhko behaviour of two stars (V350 Lyr and KIC 7021124) has been identified (Benk˝o & Szab´o 2015) so these two stars were omitted from the present sample. The investigated stars are listed in Table1.
The Kepler mission was introduced in Borucki et al.
(2010) and all the technical details are discussed in the handbooks of Van Cleve & Caldwell (2016); Fanelli et al.
(2011), and Van Cleve et al. (2016). This work used two light curves for each star: the total four-years-long normally
∼29 min sampled so-called long cadence (LC) light curve, and the ∼1min (over)sampled short cadence (SC) data of the same stars. Tipically, a given star was observed in SC mode in a few quarters (see column 3 in Table 1). In both cases the light curves have been produced by using our own tailor-mode aperture photometry carried out on the pub- licly available original CCD frame parts (‘pixel data’)1. The data handling and the photometric process are described in Benk˝o et al.(2014). Here we mention only that for the sake of uniform handling the same parameters (apertures, zero point shifts and scaling ratios) were used for both the SC and the LC data.
3 THE SC LIGHT CURVES
3.1 Cycle-to-cycle variation of the light curves First we examined the SC time series. We used the raw flux data obtained from our tailor-made aperture photometry, which is practically a simple pixel flux value summation without any further processing.
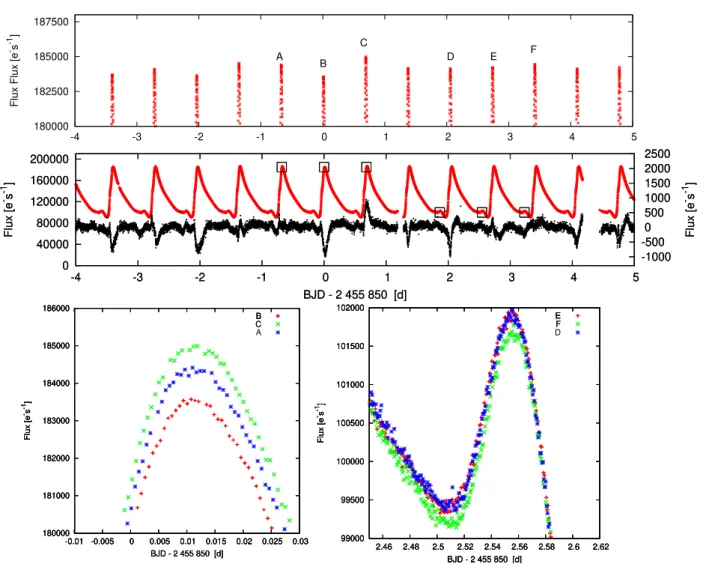
While checking the flux curves we realised that the pul- sation cycles are different to each other. As an example we show a part of the SC light curve of NR Lyr in Fig1. The top panel shows the light curve around maxima of 13 con- secutive pulsation cycles. The most striking feature is the different height of maxima. We marked three consecutive pulsation cycles with the letters ‘A’, ‘B’ and ‘C’. In the bot- tom left panel, the same three cycles are plotted by shifting
1 Kepler pixel data can be downloaded from the web page of MAST: http://archive.stsci.edu/kepler/, while the light curves used this work from our web site:http://www.konkoly.
hu/KIK/
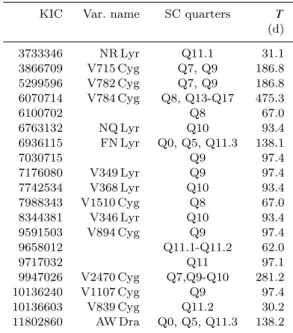
Table 1.The usedKeplerRR Lyrae sample. The columns show the star’s KIC ID; variable name, if exits; the observed SC quar- ters; and the total observed SC time
KIC Var. name SC quarters T (d)
3733346 NR Lyr Q11.1 31.1
3866709 V715 Cyg Q7, Q9 186.8
5299596 V782 Cyg Q7, Q9 186.8
6070714 V784 Cyg Q8, Q13-Q17 475.3
6100702 Q8 67.0
6763132 NQ Lyr Q10 93.4
6936115 FN Lyr Q0, Q5, Q11.3 138.1
7030715 Q9 97.4
7176080 V349 Lyr Q9 97.4
7742534 V368 Lyr Q10 93.4
7988343 V1510 Cyg Q8 67.0
8344381 V346 Lyr Q10 93.4
9591503 V894 Cyg Q9 97.4
9658012 Q11.1-Q11.2 62.0
9717032 Q11 97.1
9947026 V2470 Cyg Q7,Q9-Q10 281.2
10136240 V1107 Cyg Q9 97.4
10136603 V839 Cyg Q11.2 30.2
11802860 AW Dra Q0, Q5, Q11.3 138.2
‘A’ and ‘C’ cycles to the position of ‘B’ (red plus), i.e. ‘A’
is shifted in the positive direction (blue asterisk) and ‘C’ is shifted in the negative direction (green x). As we can see, all the maxima are well-covered by observations and differ to each other significantly. The difference between maxima
‘B’ and ‘C’ is ∼1500e−s−1 (in magnitude scale is around 0.008 mag) which is huge compared to the observational er- ror of individual data points (∼2×10⁻⁵ mag).
Although the most striking feature is the different max- ima, other parts of the light curves are also different. Looking at the three consecutive cycles marked with ‘D’, ‘E’ and ‘F’
in the top panel of Fig 1. The height of maxima of these cycles are almost the same, while cycle ‘F’ is a bit higher.
Shifting the cycles ‘D’ (blue asterisk) and ‘F’ (green x) with plus or minus one pulsation cycle to the position of the cycle
‘E’ (red plus) and crop around the bumps (pulsation phase φ ∼0.6−0.8), we get the bottom right panel of Fig1. We see that the light curves of cycles ‘D’ and ‘E’ are overlapped but cycle ‘F’ goes bellow these two. The difference is abut 300 e−s−1 (0.003 mag). Since cycle ‘F’ has the largest max- imum amongst these three cycles there is no vertical shift which could eliminate both the maximum and the minimum differences simultaneously.
The complex structure of the light curve changes can be studied in detail by preparing the residual flux curve. A 55-element harmonic fit was removed from the data. The resulted curve is shown in the middle panel of Fig.1(black dots) with the original flux curve (red dots). The residual shows sharp spikes at around the light curve maxima. These spikes are positive or negative according to that the certain cycle flux curve is above or below the fit, respectively. Spikes can also be found at different phases than maxima (φ=0).
These phases are φ ∼0.92,0.95,0.7,0.75, and 0.1. The first two phases are the beginning and the end of the light curve feature of the ascending branch often called ‘hump’ whileφ∼ 0.75is the position of the ‘bump’. The light curve of NR Lyr
180000 182500 185000 187500
-4 -3 -2 -1 0 1 2 3 4 5
Flux Flux [e-s-1]
A B
C
D E F
0 40000 80000 120000 160000 200000
-4 -3 -2 -1 0 1 2 3 4 5
-1000 -500 0 500 1000 1500 2000 2500
Flux [e- s-1 ] Flux [e- s-1 ]
BJD - 2 455 850 [d]
0 40000 80000 120000 160000 200000
-4 -3 -2 -1 0 1 2 3 4 5
-1000 -500 0 500 1000 1500 2000 2500
Flux [e- s-1 ] Flux [e- s-1 ]
BJD - 2 455 850 [d]
180000 181000 182000 183000 184000 185000 186000
-0.01 -0.005 0 0.005 0.01 0.015 0.02 0.025 0.03 Flux [e-s-1]
BJD - 2 455 850 [d]
B
180000 181000 182000 183000 184000 185000 186000
-0.01 -0.005 0 0.005 0.01 0.015 0.02 0.025 0.03 Flux [e-s-1]
BJD - 2 455 850 [d]
B C
180000 181000 182000 183000 184000 185000 186000
-0.01 -0.005 0 0.005 0.01 0.015 0.02 0.025 0.03 Flux [e-s-1]
BJD - 2 455 850 [d]
B C A
99000 99500 100000 100500 101000 101500 102000
2.46 2.48 2.5 2.52 2.54 2.56 2.58 2.6 2.62 Flux [e-s-1]
BJD - 2 455 850 [d]
E
99000 99500 100000 100500 101000 101500 102000
2.46 2.48 2.5 2.52 2.54 2.56 2.58 2.6 2.62 Flux [e-s-1]
BJD - 2 455 850 [d]
E F
99000 99500 100000 100500 101000 101500 102000
2.46 2.48 2.5 2.52 2.54 2.56 2.58 2.6 2.62 Flux [e-s-1]
BJD - 2 455 850 [d]
E F D
Figure 1.Cycle-to-cyle variation of the SC flux curve of NR Lyr. Top panel: a part of the flux curve around the pulsation maxima;
middle panel: residual curve after we pre-whitened the data with 55 significant harmonics of the main pulsation frequency (right scale, black points) and for comparison the original flux curve (left scale, red points); bottom panels: three consecutive cycles from the flux curve signed by different colours and symbols folded to the cycle ‘B’ and ‘E’, respectively. The small boxes in the middle panel indicate the positions of these flux curve parts.
shows no evident features at the positions ofφ∼0.7and 0.1 but these phases are the same that were defined byChadid et al.(2014) as the positions of ‘rump’ and ‘jump’ recently.
Maxima and these phases are those parts of the light curves where the most prominent shock waves are generated (Simon
& Aikawa 1986;Fokin 1992;Chadid et al. 2008;Chadid &
Preston 2013).
We found similar cycle-to-cycle (hereafter C2C) varia- tions for all stars which are brighter than Kp ∼15.4 mag (see ’yes’ sign in the fourth column of Table2). The KICKp
magnitudes given in Column 2 of Table2were determined by ground-based photometry by Brown et al. (2011), who observed each star in three different epochs. This observing strategy is well-suited to constant stars but it could result in inaccurate average magnitudes for large amplitude variable stars as RR Lyrae. The brightness of our stars are, therefore, better characterized by the measured average flux (Col. 3 in Table2) than the KIC magnitudes.
The maximal brightness deviations is similar for all stars: the difference between the highest and lowest max- ima is about 0.006-0.008 mag. This general value might be
responsible for the lack of C2C variation of fainter stars: the higher observation noise make the effect to be undetectable.
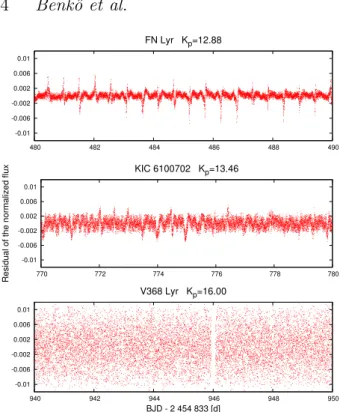
The situation is illustrated with Fig.2where we plotted the residual of the normalized flux (F/hFi, where F means the flux in e−s−1andhFiis the average flux) curves of three stars with different brightness in the same scale. While the C2C variations of FN Lyr (Kp=12.88mag) in top panel of Fig.2 is very similar to NR Lyr, the spikes are less detectable for the fainter KIC 6100702 (Kp=13.46mag, middle panel). Fi- nally, no structure can be recognized within the higher noise level of the faintest star V368 Lyr (Kp=16.00mag, bottom panel).
The C2C behaviour of NR Lyr showed in Fig.1is typi- cal not just in its amplitude but in its other characteristics as well. The difference in maxima are generally higher than the minima (or other parts of the light curves). The maxima (and minima) value variation seems to be random. Some- times increasing or decreasing amplitude cycles follow each other but in many other cases a small amplitude cycle fol- lows a large amplitude one or vice versa (see also top panels of Fig1and Fig2).
-0.01 -0.006 -0.002 0.002 0.006 0.01
480 482 484 486 488 490
FN Lyr Kp=12.88
-0.01 -0.006 -0.002 0.002 0.006 0.01
770 772 774 776 778 780
Residual of the normalized flux
KIC 6100702 Kp=13.46
-0.01 -0.006 -0.002 0.002 0.006 0.01
940 942 944 946 948 950
BJD - 2 454 833 [d]
V368 Lyr Kp=16.00
Figure 2.Ten-days-long parts of residual flux curves. The three different brightness stars are shown in the same relative scale.
The apparent brightness of the stars are decreasing from top to bottom. The detectability of the C2C variation features are highly depends on the brightness. The fainter of the star the hardest to detect the effect.
Table 2. Detection of the C2C variation. Name; Kepler Kp brightness from the KIC catalogue (Brown et al. 2011); C2C vari- ation detection by eye; Detection index D(see the text for the details).
Name Kp hFi C2C D5
(mag) e−s−1
NR Lyr 12.684 128717 yes 69.8
V715 Cyg 16.265 4731 14.5
V782 Cyg 15.392 12892 yes 35.7 V784 Cyg 15.370 10129 ? 76.2 KIC 6100702 13.458 48145 yes 92.9 NQ Lyr 13.075 63394 yes 98.7 FN Lyr 12.876 115746 yes 96.6 KIC 7030715 13.452 76707 yes 112.8
V349 Lyr 17.433 1638 21.0
V368 Lyr 16.002 3772 21.6
V1510 Cyg 14.494 19762 yes 28.2
V346 Lyr 16.421 2404 ? 28.2
V894 Cyg 13.293 91854 yes 109.8 KIC 9658012 16.001 6692 yes 26.8
KIC 9717032 17.194 2521 11.6
V2470 Cyg 13.300 64935 yes 114.3 V1107 Cyg 15.648 6293 yes 34.0 V839 Cyg 14.066 25339 yes 32.0 AW Dra 13.053 108385 yes 95.4
3.2 Origin of the C2C variations
AlthoughChadid(2000) and Chadid & Preston (2013) re- ported spectroscopic C2C variations of RR Lyrae stars, on ground-based photometric basis only marginal signs of such an effect were published (e.g. Barcza 2002; Jurcsik et al.
2008). On space photometric basis no similar C2C variation of non-Blazhko RRab stars have been reported ever before, so we checked our finding carefully.
(i) It is known that disruptions such as safe modes, the regular monthly downloads of data or quarterly rolls could cause abrupt changes in the rowKeplerfluxes (Fanelli et al.
2011). We indeed detected small flux curve changes for many stars after such events but the C2C variations are appeared continuously over the entire data sets and are not concen- trated around the discontinuity events. This rules out that the C2C variations would result from this technical problem.
(ii) To avoid possible data handling problems which may cause such an effect we used the raw tailor-made aperture photometric fluxes. The local instrumental trends were han- dled in three different ways. (1) For 13 stars the SC data show no serious instrumental trends so we used these data without any further processing. (2) The raw data of six stars, however, show noticeable trends which were removed by sub- traction of fitted polinomials. (3) As an independent check we applied a method to all SC data sets in which we adjust each pulsation cycle to a common zero point. For a given star a Fourier sum was fitted to each cycle separately, the determined zero points were connected with a smooth con- tinuous curve which was then subtracted from the data. This algorithm works well and removes the tiniest instrumental trends but it has an assumption that zero point variations can only be caused by instrumental effects. Although no systematic amplitude changes connected to this small zero point corrections were detected in any of the studied stars, it is known that, for example, the Blazhko effect also causes zero point variations (Jurcsik et al. 2005,2006,2008). In this respect, we know nothing about the C2C variations, so we did not use these zero point corrected data except for this test.
We compared the C2C variations of the raw (1) or the globally corrected (2) data to the zero point corrected (3) data. These comparisons resulted in qualitatively similar C2C variations though the actual value of the quantitative properties (e.g. amplitude difference between consecutive cy- cles) was slightly different. This test showed that the C2C variation is not caused by our data handling.
(iii) The next potential cause can come from the pho- tometry, such as background sources, drift of the stars in the CCD frame, etc. We have chosen high and low max- ima pairs from the light curves and plotted the flux in the pixel maps at the high maximum phase and also the flux differences between the high and low maxima phases. This is plotted for NR Lyr in Fig.3. The figure shows that (1) the amplitude difference is connected to the star and there is not any other sources of light and (2) the position of the star is fixed within the pixel mask. These image properties mini- mize the chance of C2C variations being caused by serious photometric problems.
The investigation of the pixel masks resulted in a by- product. We found a faint variable source in the frame of V784 Cyg. The source was identified with the star
-1 0 1 2 3 4 5 6
-1 0 1 2 3 4 5 6 7
NR Lyr pixel mask (raw)
0 10000 20000 30000 40000 50000 60000
-1 0 1 2 3 4 5 6
-1 0 1 2 3 4 5 6 7
NR Lyr pixel mask (subtracted)
-50 0 50 100 150 200 250
Figure 3.The pixel mask of NR Lyr during the SC (Q11.1) ob- servation. The upper panel shows the flux in ‘high’ maximum signed by ‘C’ in Fig.1, while the lower panel contains the flux difference of the ‘high’maximum ‘C’ and ‘low’ maximum ‘B’.
KIS J195622.44+412013.9 (g = 20.19, r = 19.32 and i = 18.67 mag) observed by the Kepler-INT survey (Greiss et al. 2012) (see also last paragraph in Sec4.2). Other variable sources have not been found in any other frames.
(iv) For testing unknown instrumental effects as an ex- planation of C2C variation, we investigated similar obser- vations with a different instrument. Currently the only in- dependent instrument which observed high precision time series for non-Blazhko RR Lyrae stars is the CoRoT space telescope (Baglin et al. 2006). To our knowledge three non- Blazhko stars were observed with the oversampled mode which mean 32 sec sampling. (The time coverage of the nor- mal 8 min sampling ofCoRoTis too sparse for our porpose.) These are: CoRoT 103800818 (rCoRoT=14.39mag,Szab´o et al. 2014), CM Ori (CoRoT 617282043, rCoRoT =12.64 mag, Benk˝o et al. 2016) and the BT Ser (CoRoT 105173544, rCoRoT = 12.99 mag) which was overlooked by previous CoRoTRR Lyr studies.
We used the oversampled flux time series2 of CoRoT 103800818 from LRc04 run (74.6 d long oversampled part, 176 871 data points), CM Ori LRa05 (90.5 d, 200 999 observations), and BT Ser which was observed in two subse-
2 The data can be downloaded from the IAS CoRoT Public Archive http://idoc-corot.ias.u-psud.fr/sitools/
client-user/COROT_N2_PUBLIC_DATA/project-index.html
765000 768000 771000 774000
5595.46 5595.48 5595.5
CM Ori
Flux [ADU]
BJD - 2 450 000 [d]
765000 768000 771000 774000
5595.46 5595.48 5595.5
CM Ori
Flux [ADU]
BJD - 2 450 000 [d]
430000 432000 434000 436000
5396.85 5396.88 5396.9 5396.92
BT Ser
Flux [ADU]
BJD - 2 450 000 [d]
430000 432000 434000 436000
5396.85 5396.88 5396.9 5396.92
BT Ser
Flux [ADU]
BJD - 2 450 000 [d]
Figure 4. The amplitude difference of consecutive cycles in CoRoT non-Blazhko stars. The red dots mean the original light curve points while the blue ‘x’ symbols show the light curve points shifted one pulsation cycle.
quentCoRoTruns LRc05 and LRc06, meaning 168.4 d-long almost continuous observations with 391 455 individual data points. These amount of data are comparable with the SC data of presentKeplersample. CM Ori and BT Ser are rel- atively bright: despite the smaller aperture of CoRoT we have similarly accurate light curves for these stars as for the fainterKeplerstars.
We performed similar investigation of theCoRoTlight curves as we did forKeplerstars and we found C2C variation for the two brighter stars CM Ori and BT Ser. Fig.4shows their amplitude variation in the same way that was plotted in the bottom left panel of Fig.1for NR Lyr. Even though the scatter is evidently higher, the amplitude difference is obvious. The largest difference between high and low ampli- tude maxima is about 0.005-0.006 mag. This value is similar to our estimation obtained fromKeplerstars. The∼2 mag fainter third star CoRoT 103800818 show no C2C variation as we expected on the basis of Kepler sample where also seems to be exist a detection limit at about 15.4 mag.
These tests suggest that the detected C2C variations are predominantly belong to the stars. Of course, seri- ous time- and flux-dependent non-linearity of the detectors might cause similar effects, however, no such problems have been reported neither forCoRoT nor forKepler. A promis- ing independent check opportunity will be the analysis of TESS (Ricker et al. 2015) oversampled (2-min) data.
(v) There is an additional argument that the C2C light curve variations belong to the stars: the shape of the resid-
ual light curves. The spikes described in Sec3.1are not ran- domly distributed in the pulsation phase but appeared ex- actly at the phase of the hydrodynamic shocks. This findings argees well with the results of radial velocity studies (Chadid 2000;Chadid & Preston 2013) where the C2C radial veloc- ity curve variations were explained cycle to cycle variation of the hydrodynamic phenomena induced the shock waves in RR Lyrae atmosphere.
3.3 Characterising the C2C variations
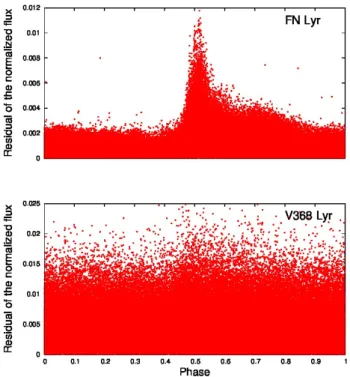
Beyond the visual inspection done in Sec. 3.1, we defined a quantity which numerically measures the detectability of the C2C variations. As we have seen the C2C variations focus around the pulsation maxima therefore the residual flux curves show spikes around these positions (Fig.2). The phase diagrams of these residual flux curves show a broad- ening around the phase of the pulsation maxima (φ=0.5see Fig5). By comparing the amplitudes of these broadenings to the amplitude of non-broadened phases, we can define a numerical value wich typify the detectability of C2C varia- tion.
A simple statistical approach was implemented. We folded the SC residual flux curves r(t) with their periods then the obtained r(φ) phase diagrams were splitted into few bins:r1,r2, . . .rn(nis integer). In each bin the average of the absolute values of the residual fluxes h|ri|i and its stan- dard error si was determined. The difference between the maximal and minimal bin values is
∆n:=h
h|rj|i(max)− h|rk|i(min)i
, j,k∈1,2, . . . ,n. (1) We can define the detectation parameter as
Dn:=∆n
sn, where sn=max(sj,sk). (2) The Dn is a significance-like parameter. It measures how much larger the average flux of the central bin which con- tains the spike than a bin which definitely not contains it.
The difference is expressed in the ratio of the standard er- ror. In column 4 of Table 2 the D5 values are given. If a star has more than one distinct SC quarter observations, we determinedDfor each quarter separately, and here we show their averages.
TheDseem to be good C2C variations detection indi- cator: ifDvalue is high (D>30) we can detect evident C2C light curve variations by eye and if this value is low (D<25) we cannot see anything. The faint variable in the frame of V784 Cyg disturbs the visual inspection, but theDparame- ter clearly show the existence of the C2C variation. There is a trend between the parameterDand the average flux hFi (Column 3 in Table2): the brighter the star, the higher the associated D parameter. It suggests that the phenomenon is similar in strength for all stars and the differences of the detection are mainly because of the brightness differences.
The C2C variations seem to be random. To investigate this, we prepared the Fourier amplitude and phase variation functions. The SC light curves were divided into period-long bins and so each bin contained abut 600-800 points depend- ing on the cycle size. This handling minimize numerous pos- sible technical problems such as zero point fluctuations or short time-scale trends. The amplitude and phase variation
Figure 5.The absolute values of the residual of the normalized flux vs. phase diagram of FN Lyr (up) and V368 Lyr (down).
functions An(t), φn(t) were calculated for each star by ap- plying ten-element harmonic fits. This calculation has been done with theLCfit(S´odor 2012) non-linear Fourier fitting package.
Plachy et al.(2013) investigated RR Lyrae models cor- responding to resonance states and chaotic pulsation. Their synthetic chaotic luminosity curves show similar changes than we presented here: the random-like changes are con- centrated around the maxima and the amplitudes are also in similar magnitude range. These raise the possibility that by the C2C variations we observed might be the sign of chaotic pulsation. Detailed testing of such a possibility is far beyond the goal of this paper but we investigated the Poincare re- turn maps ofA1andφ1values as a fast and easy check. We prepared four maps for each star:(A(j1),A(j1+1)),(A(j)1 ,A(j1+2)), (φ(j)1 , φ(j1+1)) and (φ(j)1 , φ(j1+2)). Here j integers mean the cy- cle numbers of the pulsation. Most of these maps have an oval shape showing the amplitude and phase variations but no other evident structures can be detected. That is, the ob- served C2C variations might be chaotic but we cannot verify this at least with the return maps, certainly.
4 FOURIER SPECTRA
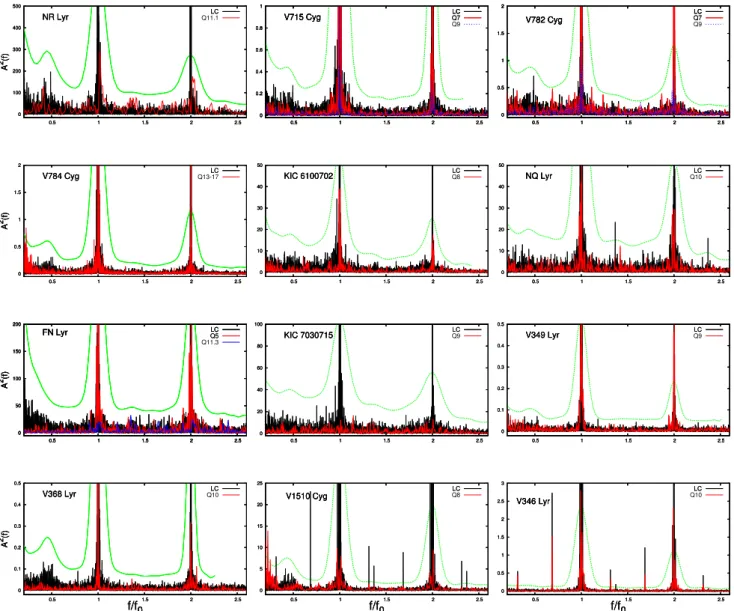
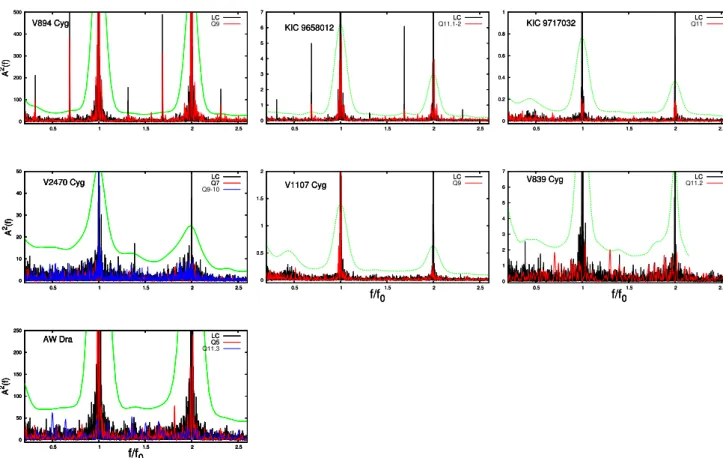
We prepared the Fourier spectra of both the LC and the SC light curves using the discrete Fourier transform tool of the program packageMuFrAn(Koll´ath 1990). The spectra are dominated by the main pulsation frequencies f0 and their harmonicsn f0 (nis a positive integer). After pre-whitening the data for a significant number (35-55) of harmonics we obtainded the residual spectra. In Fig.6-7parts of the resid-
0 100 200 300 400 500
0.5 1 1.5 2 2.5
NR Lyr
A2(f)
0 100 200 300 400 500
0.5 1 1.5 2 2.5
NR Lyr
A2(f)
LC
0 100 200 300 400 500
0.5 1 1.5 2 2.5
NR Lyr
A2(f)
LC Q11.1
0 0.2 0.4 0.6 0.8 1
0.5 1 1.5 2 2.5
V715 Cyg
0 0.2 0.4 0.6 0.8 1
0.5 1 1.5 2 2.5
V715 Cyg LC
0 0.2 0.4 0.6 0.8 1
0.5 1 1.5 2 2.5
V715 Cyg Q7LC
0 0.2 0.4 0.6 0.8 1
0.5 1 1.5 2 2.5
V715 Cyg Q7LC
Q9
0 0.5 1 1.5 2
0.5 1 1.5 2 2.5
V782 Cyg
0 0.5 1 1.5 2
0.5 1 1.5 2 2.5
V782 Cyg
LC
0 0.5 1 1.5 2
0.5 1 1.5 2 2.5
V782 Cyg
LC Q7
0 0.5 1 1.5 2
0.5 1 1.5 2 2.5
V782 Cyg
LC Q7 Q9
0 0.5 1 1.5 2
0.5 1 1.5 2 2.5
V784 Cyg
A2(f)
0 0.5 1 1.5 2
0.5 1 1.5 2 2.5
V784 Cyg
A2(f)
LC
0 0.5 1 1.5 2
0.5 1 1.5 2 2.5
V784 Cyg
A2(f)
LC Q13-17
0 10 20 30 40 50
0.5 1 1.5 2 2.5
KIC 6100702
0 10 20 30 40 50
0.5 1 1.5 2 2.5
KIC 6100702 LC
0 10 20 30 40 50
0.5 1 1.5 2 2.5
KIC 6100702 Q8LC
0 10 20 30 40 50
0.5 1 1.5 2 2.5
NQ Lyr
0 10 20 30 40 50
0.5 1 1.5 2 2.5
NQ Lyr LC
0 10 20 30 40 50
0.5 1 1.5 2 2.5
NQ Lyr Q10LC
0 50 100 150 200
0.5 1 1.5 2 2.5
FN Lyr
A2(f)
0 50 100 150 200
0.5 1 1.5 2 2.5
FN Lyr
A2(f)
LC
0 50 100 150 200
0.5 1 1.5 2 2.5
FN Lyr
A2(f)
LC Q5
0 50 100 150 200
0.5 1 1.5 2 2.5
FN Lyr
A2(f)
LC Q5 Q11.3
0 20 40 60 80 100
0.5 1 1.5 2 2.5
KIC 7030715
0 20 40 60 80 100
0.5 1 1.5 2 2.5
KIC 7030715 LC
0 20 40 60 80 100
0.5 1 1.5 2 2.5
KIC 7030715 Q9LC
0 0.1 0.2 0.3 0.4 0.5
0.5 1 1.5 2 2.5
V349 Lyr
0 0.1 0.2 0.3 0.4 0.5
0.5 1 1.5 2 2.5
V349 Lyr LC
0 0.1 0.2 0.3 0.4 0.5
0.5 1 1.5 2 2.5
V349 Lyr LCQ9
0 0.1 0.2 0.3 0.4 0.5
0.5 1 1.5 2 2.5
V368 Lyr
A2(f)
f/f0
0 0.1 0.2 0.3 0.4 0.5
0.5 1 1.5 2 2.5
V368 Lyr
A2(f)
f/f0
LC
0 0.1 0.2 0.3 0.4 0.5
0.5 1 1.5 2 2.5
V368 Lyr
A2(f)
f/f0
LC Q10
0 5 10 15 20 25
0.5 1 1.5 2 2.5
V1510 Cyg
f/f0
0 5 10 15 20 25
0.5 1 1.5 2 2.5
V1510 Cyg
f/f0
LC
0 5 10 15 20 25
0.5 1 1.5 2 2.5
V1510 Cyg
f/f0
LC Q8
0 0.5 1 1.5 2 2.5 3
0.5 1 1.5 2 2.5
V346 Lyr
f/f0
0 0.5 1 1.5 2 2.5 3
0.5 1 1.5 2 2.5
V346 Lyr
f/f0
LC
0 0.5 1 1.5 2 2.5 3
0.5 1 1.5 2 2.5
V346 Lyr
f/f0
LC Q10
Figure 6.Power spectra of the residuals around the main pulsation frequencyf0and its first harmonic 2f0. Black curves show the LC power spectra. Spectra computed from the SC data are signed red and blue curves (for the actual quarter numbers see the labels in the panels). Providing comparable spectra we scaled the horizontal axes with the value of f/f0. The vertical scales of SC power spectra are also normalized to the signal to noise ratio of the LC spectra. Dotted green curves show the estimatedS/N=4values of the LC spectra.
ual power spectra are shown around the main pulsation fre- quencies (f0) and their first harmonics (2f0). The black lines indicate the LC spectra, while the spectra of the SC light curves are shown with thin red lines. For those stars where two distinct SC observations are available (e.g. Q7 and Q9 for V715 Cyg, etc., see Table1) the second SC spectra are plotted by dotted blue lines (see the labels in the panels).
The power spectra are vertically normalized with (in practice divided to) the signal-to-noise ratio S/N (Breger et al. 1993) of the LC spectra. The S/N=4 ratio functions of the LC data are plotted in green dotted lines in Fig. 6-7.
Strictly speaking, the shape of the SC and the LC S/N ratio vs. frequency functions are different, so we cannot transform them to each other by a simple normalization but such a nor- malization can give an approximate agreement in a shorter frequency interval. That is, the S/N ratio of the LC spec- tra is approximately valid for all spectra within the f0 and
2f0 intervals plotted in the panels. The noise level around the harmonics are overestimated because of the instrumen- tal origin side peaks appearing in the LC spectra (see fig. 4.
inBenk˝o et al. 2019). Instead of the frequency, the horizon- tal axes show the f/f0 values because this way the spectra can be compared directly.
4.1 Signs of the C2C variations
How does the Fourier spectrum of a randomly C2C vary- ing light curve residual look like? In order to check this, we prepared synthetic light curves, for which we used the formulae of simultaneous amplitude and frequency modula- tion summarised inBenk˝o et al.(2011);Benk˝o(2018). The carrier wave coefficients (frequency, harmonic amplitudes and phases) defined a simplified RR Lyrae-like light curve with nine harmonics, and C2C randomly changing ampli-
0 100 200 300 400 500
0.5 1 1.5 2 2.5
V894 Cyg
A2(f)
0 100 200 300 400 500
0.5 1 1.5 2 2.5
V894 Cyg
A2(f)
LC
0 100 200 300 400 500
0.5 1 1.5 2 2.5
V894 Cyg
A2(f)
LC Q9
0 1 2 3 4 5 6 7
0.5 1 1.5 2 2.5
KIC 9658012
0 1 2 3 4 5 6 7
0.5 1 1.5 2 2.5
KIC 9658012
LC
0 1 2 3 4 5 6 7
0.5 1 1.5 2 2.5
KIC 9658012
LC Q11.1-2
0 0.2 0.4 0.6 0.8 1
0.5 1 1.5 2 2.5
KIC 9717032
0 0.2 0.4 0.6 0.8 1
0.5 1 1.5 2 2.5
KIC 9717032 LC
0 0.2 0.4 0.6 0.8 1
0.5 1 1.5 2 2.5
KIC 9717032 Q11LC
0 10 20 30 40 50
0.5 1 1.5 2 2.5
V2470 Cyg
A2(f)
0 10 20 30 40 50
0.5 1 1.5 2 2.5
V2470 Cyg
A2(f)
LC
0 10 20 30 40 50
0.5 1 1.5 2 2.5
V2470 Cyg
A2(f)
LC Q7
0 10 20 30 40 50
0.5 1 1.5 2 2.5
V2470 Cyg
A2(f)
LC Q7 Q9-10
0 0.5 1 1.5 2
0.5 1 1.5 2 2.5
V1107 Cyg
f/f0
0 0.5 1 1.5 2
0.5 1 1.5 2 2.5
V1107 Cyg
f/f0
LC
0 0.5 1 1.5 2
0.5 1 1.5 2 2.5
V1107 Cyg
f/f0
LC Q9
0 1 2 3 4 5 6 7
0.5 1 1.5 2 2.5
V839 Cyg
f/f0
0 1 2 3 4 5 6 7
0.5 1 1.5 2 2.5
V839 Cyg
f/f0
LC
0 1 2 3 4 5 6 7
0.5 1 1.5 2 2.5
V839 Cyg
f/f0
LC Q11.2
0 50 100 150 200 250
0.5 1 1.5 2 2.5
AW Dra
A2(f)
f/f0
0 50 100 150 200 250
0.5 1 1.5 2 2.5
AW Dra
A2(f)
f/f0
LC
0 50 100 150 200 250
0.5 1 1.5 2 2.5
AW Dra
A2(f)
f/f0
LC Q5
0 50 100 150 200 250
0.5 1 1.5 2 2.5
AW Dra
A2(f)
f/f0
LC Q5 Q11.3
Figure 7.Continuation of Fig.6
tude modulation functions for both amplitude and frequency modulation parts were assumed. The random values were set for each amplitude and phase separately. The synthetic light curves were sampled in the same points as the observed Q7 SC data. The spectra of the synthetic light curves after we removed the nine harmonics from the data show significant peaks at the first few (4-5) harmonics. The surroundings of the peaks have a red noise profile as we expected from a random process.
Comparing these synthetic spectra with the spectra of the observed SC data, we found them fairly similar. The ob- served SC residual spectra are also dominated by frequen- cies at around f0 and its harmonics. This is true for the entire sample not just for the bright stars which show evi- dent C2C variations and highDvalues but for the faintest stars as well. The high-D stars show many (> 10) signifi- cant harmonic peaks while low-D stars have typically few (3-4) significant harmonics. This can be explained with that the fine structure of the spikes at the higher harmonics are veiled by the higher noise of low-D stars. For most cases we detect more than one single peak around the harmonic positions k f0,k =1,2, . . . which is again a similarity to the synthetic data spectra. These side peaks due to the C2C variation might explain the distinct group with extremely small Blazhko amplitude found by Kov´acs (2018). Double or multiple peaks, however, could not be just because of the C2C variations. This can also be the consequences of long time-scale (longer than the observed time span) light curve variations caused by instrumental problems or very long pe-
riod Blazhko effect. Since we found some evidence for such effects (see later in Sec.5.1), we cannot declare undoubtedly the detection of the C2C variations on all stars. This also means that the Fourier spectra alone are not discriminative enough to find C2C variations.
4.2 Additional modes
Six stars’ LC spectra show significant (S/N >4) additional peaks around the main pulsation frequency and its first har- monics. These are: NQ Lyr, V1510 Cyg, V346 Lyr, V894 Cyg, KIC 9658012 and V2470 Cyg. SC spectra of three of these stars (V346 Lyr, V894 Cyg and KIC 9658012) contain signif- icant additional frequencies. Several other stars show visible but strictly not significant (2<S/N<4) peaks in their LC or SC spectra. The frequency of the highest additional peaks with their S/N ratio are given in Table3.
In the past years low amplitude additional frequencies were found for many RR Lyrae stars (for a resent review seeMoln´ar et al. 2017). If we focus only on the fundamen- tal mode pulsators (RRab stars) then the half-integer fre- quencies (f0/2,3f0/2, . . .) of the period doubling (PD) ef- fect (Kolenberg et al. 2010;Szab´o et al. 2010) appearing in many Blazhko RRab stars was the first theoretically mod- elled case. Other type of extra frequencies which were discov- ered in numerous Blazho RRab stars are the low order radial overtone frequencies (f1,f2 Chadid et al. 2010;Poretti et al.
2010;Benk˝o et al. 2010) and their linear combinations with the fundamental mode frequency. Although the simultane-
0 5 10 15 20 25
2 4 6 8 10
A2 (f)
Frequency (d-1)
f0 2f0 3f0
f2-f0
2f0-f2
3f0-f2 f2
2f2-2f0
4f0-f2 f2+f0
2f2-f0
2f2
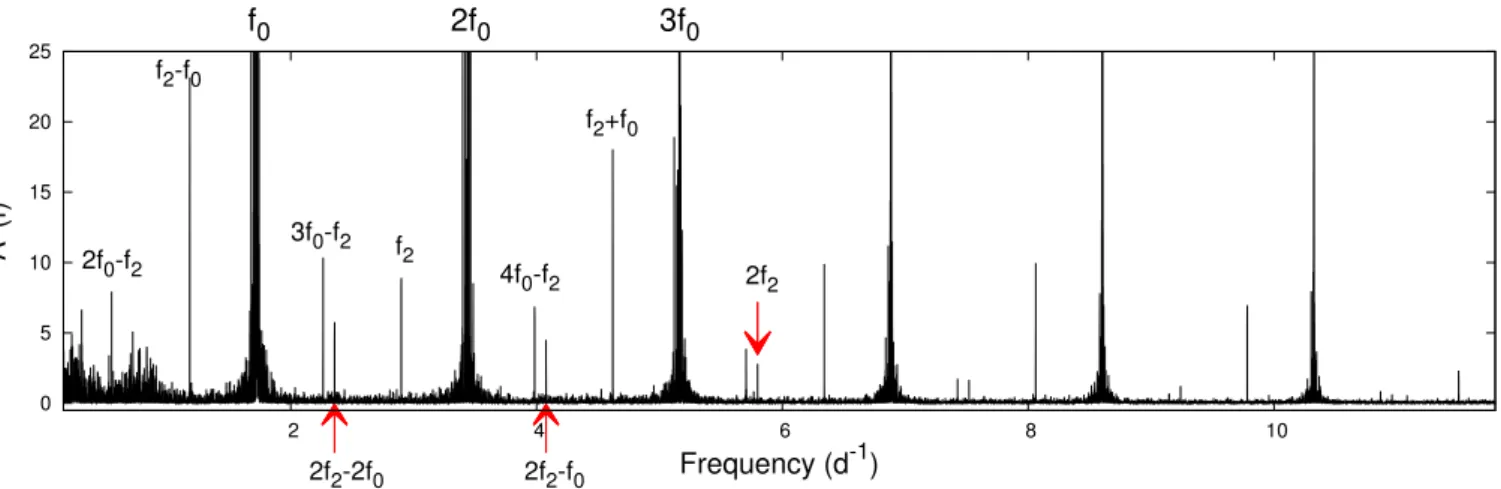
Figure 8.A possible identification of the additional mode frequencies in the pre-whitened spectrum of the LC light curve of V1510 Cyg.
The positions of the main pulsation frequency and its first two harmonics are also marked.
ous appearing of the PD and the first overtone frequencies was reproduced by radial numerical hydrodynamic codes as triple resonance states (Moln´ar et al. 2012), it is not evi- dent that all of such frequencies can be explained on this purely radial basis. Especially thought-provoking that the amplitude of the ‘linear combination’ frequencies are many times higher than their suspected basis frequencies. Such a behaviour is detected for nonradial modes empirically for rhoAp stars byBalona et al.(2013) and explained by the- oreticallyKurtz et al.(2015) which suggests that these fre- quencies could belong to non-radial modes excited at or near the radial mode positions.
The extra frequencies of V1510 Cyg, V346 Lyr, V894 Cyg and KIC 9658012 could be identified as the sec- ond radial overtone mode f2 and their linear combinations.
This identification are shown in Fig.8for V1510 Cyg which has the richest extra frequency pattern. As we see, a few lin- ear combination frequencies (e.g. f2−f0, f2+f0, or3f0−f2) have an amplitude higher than the amplitude of f2. The sit- uation is the same for V346 Lyr and V894 Cyg: the highest amplitude extra frequency is f2−f0, while for KIC 9658012 it is the f2. Stars where the highest amplitude additional fre- quency is lower than the fundamental one are rather rare.
We found V838 Cyg (Benk˝o et al. 2014) the only published case. Additional mode frequencies at the position of f2−f0 are known for few CoRoT andKepler Blazhko RRab stars (seeBenk˝o & Szab´o 2014and references therein) but in all those cases the frequency2f2−2f0 has higher amplitude.
On the basis of their additional frequency content NQ Lyr and V2470 Cyg form a separate subgroup in our sample. Their highest additional peaks are around the po- sition of the first radial overtone frequency f1, but their frequency ratios (f0/f1 = 0.732 for NQ Lyr and 0.722 for V2470 Cyg) are lying bellow the values of the canonical Petersen diagram. Such ratios have been detected for the first time for two RRd stars in the globular cluster M3 by Clementini et al.(2004). Later similar ratio has been found for theKeplerBlazhko RRab stars V445 Lyr (Guggenberger et al. 2012) and RR Lyr itself (Moln´ar et al. 2012). In the OGLE survey data of the Galactic Bulge has been found nu- merous RRd stars showing similarly small frequency ratios (Soszy´nski et al. 2011,2014). Studying the RRd stars in the
globular cluster M3 Jurcsik et al. (2014,2015) found that all four Blazhko RRd stars have anomalous frequency ratio and three of them have smaller then the normal one as we found for the present stars. Significant amount of such RRd stars were identified in the Large Magellanic Cloud by the OGLE survey (Soszy´nski et al. 2016) and also in K2 data (Moln´ar et al. 2017).
Soszy´nski et al.(2016) defined these stars as ‘anomalous double-mode RR Lyrae stars’. This group is characterized by not just its anomalous period (or frequency) ratio but the dominant pulsation mode is the fundamental one here while for the ‘normal’ RRds it is the first overtone. Additionally, most of these anomalous RRd stars show the Blazhko ef- fect (Smolec et al. 2015). Since we analyzed RR Lyrae stars classified formerly as RRab type it is evident that NQ Lyr and V2470 Cyg is dominated by the fundamental mode. The amplitude ratios are A(f1)/A(f0)=0.00025and 0.00032 for NQ Lyr and V2470 Cyg, respectively. These ratios are two- three magnitudes smaller than the similar parameters of the anomalous RRd stars discovered from the ground (Jurcsik et al. 2014;Soszy´nski et al. 2016). The anomalous RRd stars almost always show the Blazhko effect. However, we did not detect any modulation for our stars (see the details later).
Of course, very small amplitude and very long period (longer than four years) modulation can not be ruled out.
AsClementini et al.(2004) andSoszy´nski et al.(2011, 2016) pointed out the low frequency ratio of anomalous RRd stars could only be obtained from the evolutionary models assuming either higher metallicity ([Fe/H]>−0.5) or smaller mass (M<0.55M) than the usual parameters of RR Lyrae stars. For theKepler sample metallicities from high resolu- tion spectroscopy were published by Nemec et al. (2013).
They found the metallicity of NQ Lyr and V2470 Cyg to be [Fe/H]=−1.89±0.10 dex and [Fe/H]=−0.59±0.13 dex, re- spectively. Comparing these values with the period ratios we can conclude that the standard evolutionary theory can- not explain neither of these stars’ present position in the instability strip (see fig. 8 inChadid et al. 2010). It needs an alternate evolutionary channel as it was suggested by Soszy´nski et al. (2016). Since the mass seems to be lower than the normal RR Lyrae regime we raise the possibility that this altenate tracks could belong to binaries similarly to
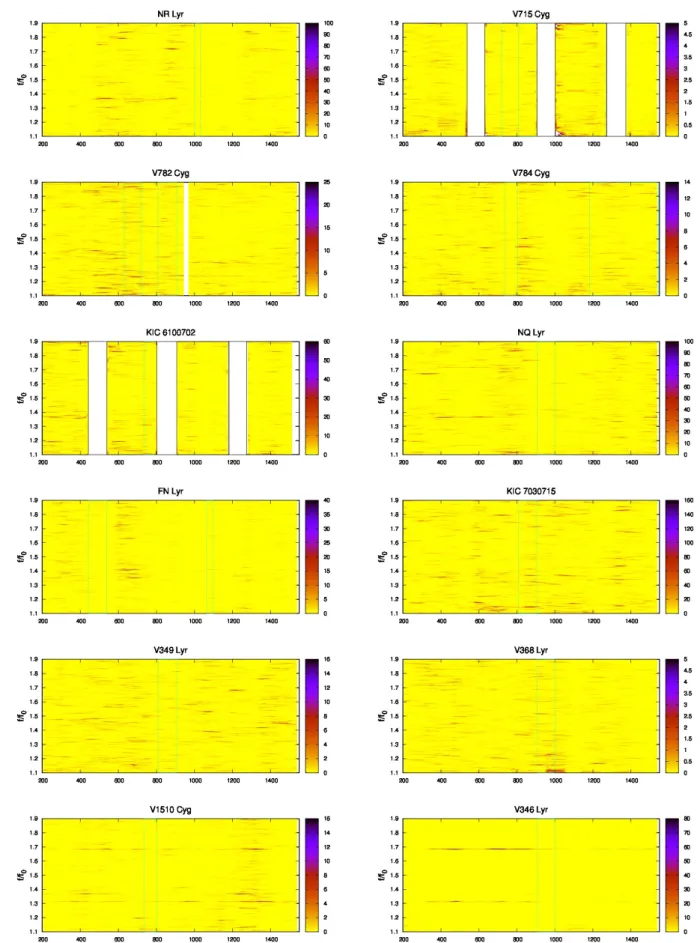
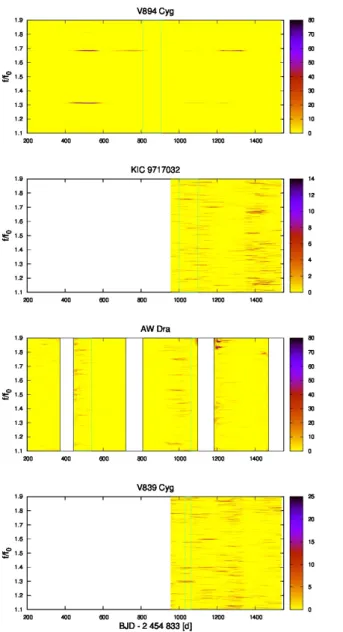
Figure 9. Time-frequency variation of the frequencies around the main pulsation frequency f0 and its first harmonic 2f0. Showing comparable spectra we indicated the normalized frequencyf/f0in the horizontal axes.
Figure 10. Continuation of Fig.9.
the case of OGLE-BLG-RRLYR-02792 (Smolec et al. 2013).
This idea can be justified or refuted by a future spectro- scopic work. AlternativelyPlachy et al.(2013) found higher order resonant solutions in their hydrodynamic codes (e.g.
with 8:11, or 14:19 ratios between f0/f1) which frequency ratios are outside the traditional RRd range but very simi- lar to the ratio of the observed anomalous RRd stars. In this case the mass and metallicity are not necessary anomalous.
We detected in many SC and/or LC spectra an increase around the half of the main pulsation frequency (∼f0/2). In some cases distinct visible but not really significant peaks (S/N < 4) are also appear (see e.g. NR Lyr, V782 Cyg) around0.48−0.49f0but in most cases only the noise level in- creases around this position. It is shown well by the S/N ra- tio curves (green dotted lines in Fig.6-7). The reason of this feature is not clear. Some possible explanations: (i) There is a rough trend within the signs of the residual light curve peaks: a positive peak is followed by a negative and vice versa. If this effect would be more regular we would seen a kind of ‘period doubling’ and its Fourier representation
would be the subharmonic k f0/2frequencies. However, we can see in Fig. 1 and 2 that this feature are far from the regularity and for all observed PD effect the highest ampli- tude frequency is the3f0/2and not f0/2as we see here. (ii) The frequencies of the increase around∼f0/2could be linear combination frequencies as f0−f0. In this scenario f0 fre- quencies would be located around the first overtone f1with anomalous frequency ratio (∼0.72−0.73). This way, almost all RRab stars would show anomalous RRd behaviour. (iii) The formerly cited work ofPlachy et al.(2013) investigated the Fourier spectra of synthetic luminosity curves belongs to e.g. 6:8 resonance solutions. These models show similar sub- harmonic structures (see their fig. 8) what we presented here but our light curves do not show any other signs of this reso- nance. Higher order hardly detectable resonances might also explain the phenomenon but this scenario is rather specula- tive. (iv) No less than the assumption in which non-radial g modes are assumed as an explanation. The frequency range of the detected increases are bellow the Brunt-V¨ais¨al¨a fre- quency but calculations for non-radial modes of RR Lyrae
![arXiv:2109.07329v1 [astro-ph.SR] 15 Sep 2021](data:image/gif;base64,R0lGODlhAQABAIAAAP///wAAACH5BAEAAAAALAAAAAABAAEAAAICRAEAOw==)