Full Terms & Conditions of access and use can be found at
https://www.tandfonline.com/action/journalInformation?journalCode=oass20 ISSN: (Print) (Online) Journal homepage: https://www.tandfonline.com/loi/oass20
The positive externality of education on crime:
Insights from Sub-Saharan Africa
Gabriel Asante & Attila Bartha |
To cite this article: Gabriel Asante & Attila Bartha | (2022) The positive externality of education on crime: Insights from Sub-Saharan Africa, Cogent Social Sciences, 8:1, 2038850, DOI:
10.1080/23311886.2022.2038850
To link to this article: https://doi.org/10.1080/23311886.2022.2038850
© 2022 The Author(s). This open access article is distributed under a Creative Commons Attribution (CC-BY) 4.0 license.
Published online: 24 Feb 2022.
Submit your article to this journal
Article views: 87
View related articles
View Crossmark data
LAW, CRIMINOLOGY & CRIMINAL JUSTICE | RESEARCH ARTICLE
The positive externality of education on crime:
Insights from Sub-Saharan Africa
Gabriel Asante1* and Attila Bartha2,3
Abstract: Although researchers have investigated the association between educa- tion and crime, few studies have studied Sub-Saharan Africa, which has the lowest rate of youth enrolled in high school. Notwithstanding, some countries are paying attention to high school education, whereby specific policies often termed “cost elimination” are designed to facilitate free education. At the micro-to-micro level, it is argued that enrolling and completing high school reduces the rate of criminal engagement. Against this backdrop, we investigate the effect of high school enrol- ment on the crime rate using macro-to-macro-level panel data about Sub-Saharan Africa countries from 2003 to 2018. Using theft and homicide rates as proxies for property and violent crime, respectively, our results show that an increase in enrolment has a significant negative effect on property crime. We find no evidence of a significant effect on violent crime. When addressing endogeneity bias using cost elimination as an instrument for enrolment, we find that the magnitude of the negative effect on the rate of theft is significantly greater and robust than the baseline estimates. These findings support the assumption that interventions that support access to education improve social structures and have the additional benefit of reducing the rate of theft, giving credence to social support theory. In a region where a majority of theft is committed by youth without a high school education, policymakers need to make concerted efforts to raise participation in
Gabriel Asante
ABOUT THE AUTHORS
Gabriel Asante is interested in the welfare of youth from developing economies. He is currently enrolled as a PhD Candidate at Doctoral School of International Relations and Political Science, Corvinus University of Budapest, Hungary. He holds a Masters’ Degree in Political Science from the Kwame Nkrumah University of Science and Technology. He has previously researched youth and prisons in Ghana and currently extending the research to understand ways of reducing the youth prison population in Sub-Saharan Africa through education policies.
Attila Bartha is an associate professor at the Institute of Economic and Public Policy, Corvinus University of Budapest and a senior research fel- low at the Centre for Social Sciences, Budapest.
Since 2015 he has been a founding editor of the journal Intersections: East European Journal of Society and Politics. His main areas of research are comparative public policy, economic policy and welfare policy in fragile democracies.
PUBLIC INTEREST STATEMENT
Criminal activity cannot be completely eradi- cated from society. Governments try to reduce the incidence of crime. The state can reduce the incidence or the rate of crime by establishing and maintaining social structures that prevent people from engaging in crime. One of the identified ways of preventing crime is providing people, especially youth in their late teens, with educa- tion. This is because having an education at least to the high school level reduces the opportunity and/or inclination to commit many crimes, including theft. Against this backdrop, this study assesses the causal relationship between high school enrolment rate and the crime rate in Sub- Saharan Africa. The findings indicate that a higher rate of high school enrolment can reduce the incidence of theft in the region. This means that if governments can support youth enrolment in high school through specific policies a significant reduction in theft can be achieved.
© 2022 The Author(s). This open access article is distributed under a Creative Commons Attribution (CC-BY) 4.0 license.
Received: 23 September 2021 Accepted: 03 February 2022;
*Correspondence author: Gabriel Asante, Corvinus University of Budapest, Budapest 1093, Hungary E-mail: gabito207@gmail.com Reviewing editor:
Heng Choon (Oliver) Chan, Department of Social and Behavioral Sciences, City University of Hong Kong, HONG KONG
Additional information is available at the end of the article
high school as one of the means of reducing crime, rather than focusing exclusively on crime control.
Subjects: Crime Control; Violent Crime; Crime and Crime Prevention; Youth Offending and Youth Justice; Education; Theories of Crime; Secondary Education
Keywords: Upper secondary education; Property crime; Violent crime; Social support; Cost elimination; Sub-Saharan Africa
1. Introduction
Crime creates a sense of insecurity and discomfort in all societies. Crime is a wrongful act or offence, the enforcement of which is typically entrusted to the state (Hermalin, 2005). Criminal activities impose a huge economic cost on societies and generate psychological costs for indivi- duals (Wickramasekera et al., 2015). Studies show that crime undermines development by eroding human and social capital and impeding business and investment in Sub-Saharan Africa (SSA) (Kingdon & Knight, 2007; United Nations Office on Drugs and Crime, 2005). For this reason, the means of reducing criminal activity has received considerable attention from researchers and policymakers (see, Welsh & Farrington, 2012). Research on crime reduction focuses on different levels of analysis. This may involve the micro-to-micro (individual) level, the micro-to-macro or macro-to-micro (cross) level, and macro-to-macro (group) level analysis (Matsueda, 2017).
Criminologists have mainly focused on micro-level analysis. This is not surprising because the long- held view is that individuals’ experiences are liked to individual outcomes, and it is easier to measure and assess individuals and create preventive measures (Pratt & Cullen, 2005). The cross- level effect operates using the assumption that causality works at the individual level and macro- outcomes are merely the aggregation of individual outcomes (Matsueda, 2017). The macro-to- macro-level assumption is that aggregate phenomena are collaboratively created by individuals yet are not reducible to individual action. The environment, social structures, and social support affect behaviour and are susceptible to producing social outcomes. Hence, making inferences from aggregate crime is no different from making inferences from individual-level analysis (Durlauf et al., 2010).
In this study, we focus on crime prevention at the macro-to-macro level of analysis. In recent literature, several micro and cross-level studies mostly conducted in advanced economies have argued that education at the upper secondary level1 can reduce crime and can be part of crime prevention strategies (Ades & Mishra, 2021; Becker, 1968; Bell et al., 2016; Bennett, 2018;
Hjalmarsson et al., 2015; Hjalmarsson & Lochner, 2012; Jonck et al., 2015; Lochner, 2004;
Lochner & Moretti, 2004). The argument is that policies that encourage enrolling and completing upper secondary (high school) education have some unobserved positive externalities, including reducing engagement in criminal activity. This is because evidence suggests that (on average) younger persons, especially uneducated males, commit more crimes than other groups in society (Åslund et al., 2018; Elonheimo et al., 2014; Hjalmarsson et al., 2015; Hövermann & Messner, 2021, p. 18; Lochner & Moretti, 2004). We contribute to this body of literature with the main objective of studying the potential causal link between education and crime by examining the effect of high school enrolment rate on the crime rate in SSA. Through analysing the macro-to-macro level, we seek understanding of how a macro-level structure—that is, the rate of school enrolment—can affect the macro-level crime rate.
Sub-Saharan Africa was selected because the region has the smallest proportion of youth enrolled in high school in the world. According to the United Nations Education, Scientific and Cultural Organisation (UNESCO) Institute of Statistics (UIS), in 2018 barely 34% of the population of official school-going age (upper secondary school) were attending school (UNESCO Institute for Statistics, 2021). Notwithstanding this, some countries in the region are implementing policies generally termed “cost elimination”, or popularly called “fee-free” education as social support programmes to increase the level of school enrolment. This presents an opportunity to study how
enrolment—that is, the rate of “being in school” as a macro-level educational indicator (rather than attainment)—affects the crime rate. The immediate aim of these policies is not to reduce crime; however, as argued in several micro and/or cross-level studies, these national policies may have some indirect or positive externalities at the macro-level on crime, as suggested by social support theory (Cullen, 1994). The study uses countries in SSA to construct a macro-to-macro- level panel data analysis that spans the years 2003 to 2018 with country years as the units of analysis.
The rest of the paper is structured as follow. In Section 2 we discuss crime and theories commonly advanced in the crime prevention literature and describe the nature of crime in SSA.
Section 3 specifies the research question and hypotheses. Section 4 provides details about our statistical model. The analytical results are presented in Section 5, and Section 6 is devoted to a discussion and suggests policy implications and avenues for further research.
2. Theoretical considerations 2.1. Typologies and sources of crime
A complex typology of crime has been developed over the years and several sources of crime are identified in the literature. Hagan (2009) classified crime according to the categories of violent crime, property crime, white-collar crime, political crime and terrorism, organised crime, public order crime, and computer-related crime. The National Incident-Based Reporting System (NIBRS) of the United States (US Department of Justice, 2012) classifies all crimes into one of four broad categories—namely, crimes against persons, crimes against property, crimes against society, and any other form of crime. Others view white-collar crime as a category of property crime. Indeed, there are overlaps in the typologies of crime since criminal activities are linked to each other.
Consequently, in studying crime it is useful to point to the specificities of the criminal act rather than combine multiple crimes into a single category (Brame et al., 2001).
Turning to sources of crime, some of the most commonly advanced classical theories include strain theories. Among the latter is Agnew’s (1985) general strain theory which views the source of crime as the strain experienced by individuals. This may develop into negative emotions, including anger, depression, or anxiety, and leads to various types of delinquent adaptations. Runciman’s (1972) relative deprivation theory refers broadly to people’s perceptions of their well-being relative to others.
For example, inequality leads to a feeling of envy or injustice, engendering social comparison, deviant patterns, and involvement in criminal activity (Fajnzylber et al., 2002). Others refer to cultural deviance theories, such as Sutherland and Cressey’s (1966) differential association theory which holds that criminal behaviour is learned through association (people commit crimes because this is consistent with their values or norms). Merton’s (1968) anomie theory involves a discussion of how culture and social structure (for example, lack of access to education, or inadequate legitimate economic opportunities) can lead to criminal behaviour. For example, Rocque et al. (2019) and Rosenfeld and Fornango (2007) studied the effect of the economy on different indicators of property and violent crime in US states and found an association between these variables.
Hirschi (1969) posited social control theory, arguing that crime and delinquency are outcomes of asocial human nature. Thus, understanding crime is not problematic, according to the previous theories. What remains to be explained is why most people conform to the laws most of the time.
Social control theory suggests that crime and delinquency are more likely to occur in circumstances of weak social bonds and are affected by a low level of social integration. According to the four principles of the theory—attachment, commitment, involvement, and belief—youth who are attached to parents, teachers, peers, and others are less likely to engage in delinquent behaviour. Commitment to achieving educational goals and success prevents youth from crime. Involvement is related to the incapacitation effect of education (Jacob & Lefgren, 2003), which means that time engaged in social activities such as learning limits simultaneous engagement in crime. Social bonds may also create a strong belief in the moral validity of the law, which creates an abhorrence of criminal acts.
Furthermore, Lochner (2004) interprets human capital theory to argue that schooling at the upper secondary level can reduce the rate of criminal engagement. According to Bell et al. (2018), this assumption is valid because education, especially at the high-school level, alters the age-crime profile, discouraging criminal engagement at the typical peak crime-related age. Therefore, poli- cies for increasing the proportion of those in school at the high-school level have the further benefit of reducing crime; an effect which has been termed education-policy-induced crime reduction. However, Elonheimo et al. (2014), Hjalmarsson et al. (2015), Hövermann and Messner (2021), and Moffitt et al. (2006) argue that (on average) the effect is stronger for males than females. This is because male adolescents are more likely to offend than females therefore, educating males at their late adolescence have a significant reduction in their criminal engage- ment compared to females. For example, Hjalmarsson et al. (2015) found that an additional year of high school due to school reforms is associated with an average of 2.2 and 0.4 percentage points reduction in committing a crime for males and females, respectively with strong statistical significance for males. In addition, Bennett (2018) demonstrates that the probability of conviction for males reduces significantly by 9.5, 8 and 2.5 percentage points for any crime, property crime and violent crime, respectively due to having high school education with inconsistent statistical significance across crimes for females. Again, several empirical studies emphasise that the nega- tive effect of education (upper secondary level) on crime is concentrated in relation to property crimes such as theft rather than on violent crimes such as homicide because of the economic motivation for property crime (Ades & Mishra, 2021; Åslund et al., 2018; Lochner, 2004; Machin et al., 2011).
Although Hirschi’s (1969) social control theory and Lochner’s (2004) interpretation of human capital provide enough reasons to assume that schooling can reduce crime, they are limited in their explanation of macro-level crime rates.
2.2. Social support and the macro-level analysis of education and crime
Cullen (1994) proposes social support theory and argues that the level of instrumental or expres- sive support provided by families, interpersonal relations, or states through social programmes can reduce aggregated crime. He further argues that social support makes social control more effec- tive because social control structures (for example, schools) operate in a social context. This means that an ecological setting that provides material benefits to people through social support programmes (for example, paying tuition fees for individuals to help them complete college) makes the social-control-crime-reducing effect at the individual level an effective influence on the national (aggregate) crime rate (Pratt & Cullen, 2005). Intuitively, prosocial influences increase while anti-social influences decrease as a result of social support, while community integration may also be fostered, helping to diminish the effects of the root causes of crime. Some macro-to- macro-level studies of education and crime can be identified. Buonanno and Montolio (2008) examined the issue in relation to the Spanish Provinces from 1993 to 1999 through a panel dataset, finding an association between education and property crime rates, and one Italian study that looked at crime on a regional basis concluded that more than seventy-five per cent of convicted Italians had no high-school education (Buonanno & Leonida, 2006). Killias and Aebi (2000) compared crime trends in Europe and the US and concluded that a lack of educational opportunities for migrant youth in the EU and Eastern Europe may at least partly account for an increase in the crime rate.
2.3. The education-crime nexus in Sub-Saharan Africa
In SSA, Austin and Kim (1999) used multiple regression to study education (with educational attainment and literacy as proxies) and homicide and found that there is a positive significant relationship between the latter. In Kenya, Muchwanju et al. (2015) analysed variables affecting the crime rate using panel datasets for provinces in that country. Austin and Kim’s (1999) and Muchwanju et al.’s (2015) studies, however, conflate educational attainment with school enrol- ment, as they do not specify the level of education used in the study. This is an important limitation in the analysis of the education-crime relationship because the level of education
tends to determine the direction and significance of the relationship with certain categories of crime. For example, Hjalmarsson and Lochner (2012) find that white-collar crimes (embezzlement, tax evasion, confidence tricks, forgery, and check fraud) as categories of property crime increase with education. It is vital to distinguish between the two measures of education (that is, enrolment versus attainment associated with a defined level of education) when estimating the education- crime relationship either at the micro-level or macro-level.
Furthermore, it is important to dichotomise or study different categories of crimes separately, rather than to estimate the overall number of crimes due to differences in patterns of crime related to their predictors (Brame et al., 2001; Elonheimo et al., 2014). For example, to focus on property crime and violent crime using specific indicators such as theft and homicide, respectively
—which is the focus of this study. Another potential limitation of education-crime studies in SSA is the reverse causation problem, and the many potentially unobserved variables that are included in education-crime-related studies which lead to estimation bias. These limitations have been over- looked in previous studies.
Although there may not be clearly defined properties of the macro-social benefits of education on crime or a direct relationship, there are several reasons to assume that the social structure or characteristics (for example, schooling) of youth at their peak-crime age may impact the aggre- gate crime rate in SSA. For example, a study in Nigeria by Ajaja (2012) noted that 85% of criminal activities such as stealing and robbery are reportedly committed by youth who do not have a secondary school education, and the latter constitute the largest proportion of individuals in prison. A study by Jonck et al. (2015) found that the majority of people who committed crimes in South Africa had only completed primary education. Shavisa et al.’s (2015) study in Kenya showed that engagement in crime is statistically associated with juveniles who are not enrolled in school.
Furthermore, other descriptive statistics from national and international institutions provide evi- dence that many criminal activities in SSA involve male uneducated youth. A World Bank (2012) report on youth violence in South Africa indicated that youth are often the perpetrators of violence. According to a 2013 report by the Ghana Prisons Service, 45% of all those convicted are between the ages of 18 and 25. Among them, 79.7% have an education that is below the high school level and a large proportion are male (Ghana Prisons Service, 2013). Last, almost 60% of Sub-Saharan Africa’s popula- tion are youth under the age of 25, while 20% of the population are youth aged between 15 and 24 years (United Nations Department of Economic and Social Affairs, 2019; United Nations Population Fund, 2014), indicating that this cohort is strongly represented in terms of day-to-day activity.
3. Research question and hypotheses
Based on the applicability of a macro-level perspective on crime, we examine the relationship between a macro-social indicator (the enrolment rate) and macro-level crime rate in SSA by asking the following research question (RQ):
RQ: What is the effect of the rate of high school enrolment on the crime rate in Sub-Saharan Africa?
In answering this research question, we specify the following hypotheses:
H1: An increase in the high-school enrolment rate is negatively and significantly related to the rate of property crime/theft.
H2: An increase in the high-school enrolment rate is negatively and significantly related to the rate of violent crime/homicide.
4. Data and methods 4.1. Data
To analyse the effect of education (upper secondary school enrolment) on crime (property crime and violent crime) we use an econometric approach that includes Sub-Saharan African (SSA) countries to build panel data from 2003 to 2018. This timeframe was chosen because the crime- related data for many countries in SSA compiled by the United Nations Office on Drugs and Crime (UNODC)—the main source of crime data for this study—start from 2003, and recent values are for 2018. We conduct a fixed-effect (FE) regression analysis of panel data coupled with instru- mental variable (IV) estimates. However, we start off by pooling the data using ordinary least squares (OLS) estimates. Levitt (2001) recommends the use of panel data to study crime due to its effectiveness for several reasons. Based on the goal of the research, the researcher can remove and control for unobserved entity-fixed effects (for example, civil war, the strength of security-related institutions, or the quality of education) and unobserved time-fixed effects (for example, changes in a country’s laws or national politics) that are not easily quantifiable. Panel analysis also allows for the inclusion of other time-varying factors due to the high number of degrees of freedom, permitting the control of factors that might be plausible explanations for crime. What tempers these advantages is the incidence of missing data found in many panel datasets, which will be discussed subsequently. Nevertheless, utilising internationally (macro) comparable data through panel data analysis is one of the best strategies for studying crime (Levitt, 2001, p. 381).
In terms of SSA countries, we use the classification of the United Nations Development Programme (n.d), which lists 46 countries out of 54 African countries. However, the unavailability of data and many instances of missing data for countries led us to omit some countries from the analysis. In the analysis of property crime represented by the rate of theft, 15 countries (n = 15) have data that can be used with 240 observations (N = 240), while 19 countries (n = 19) have data for violent crime represented by the homicide rate with 304 observations (N = 304).2
There are some issues related to the data which need to be clarified. First, there is the issue of relying on reported crime data, especially in the context of the study. Soares (2004) observed that the underreporting of crime is a common characteristic of developing countries, mostly due to low- quality policing and judicial systems, and a poorly educated population. Low-value property crimes such as petty theft may not be reported. In addition to this, the measurement process may involve different entities. We try to minimise these limitations by using, in most cases, a single source for the crime-related data which has been comparably compiled by the UNODC. Second, crime data reported to the police (the source of the compilation by UNODC) do not contain information on the characteristics of those committing the crimes, such as their educational background. Since UNODC is the only up-to-date and comparable crime data with a relatively wide scope in terms of time for SSA countries, we collected the nationally aggregated crime data of interest and matched them to the main independent variable, which is also aggregated educational data for each entity and year. This helps to reduce, if not overcome, this challenge.
Finally, there is the issue of missing data. Missing data affect the dependent variables and the main independent variable, as well as other control variables. All missing values are “missing completely at random” (MCAR). This means that their lack is not a function of nor is statistically independent of the explanatory variables and outcome variables. As stated earlier, we eliminated countries with a lot of missing data from the analysis. We relied on countries that have enough data that permitted the tracking of specific trends over time and used the linear interpolation method in the STATA Statistical Software3 to input the missing data for the remaining years. Little and Rubin (2020, p. 178) argue that
“given estimates of the simple correlation for two different values . . . one can estimate the simple correlation for any other value . . . using linear interpolation”.
4.2. Variables
4.2.1. Dependent variables
The dependent variables throughout the study are the rate of theft, which is used as a proxy for property crime (Theft Rate) and the homicide rate (Homicide Rate) that is used as a proxy for violent crime. These variables are measured as theft or homicide rates per 100,000 people in a country within one year. Following previous studies, and to reduce the influence of high crime rates and facilitate interpretation of the coefficients as elasticities, we used the natural log to transform the crime rates for all the estimates.4
The use of the rate of theft as a specific proxy for property crime is justified in several ways: 1) it is the metric that is readily available and easily comparable as a category of property crime that has been collected by UNODC for SSA; 2) theft is the leading criminal offence recorded by the police in almost all SSA countries. The homicide rate was selected because: 1) unlike other violent crimes such as rape or serious assault, homicide is the crime least affected by underreporting; 2) the homicide rate is the most available piece of crime-related data for SSA countries that is collected by UNODC; 3) the approach is consistent with prior literature that attempted to explain crime, since many of these studies used the homicide rate as a proxy for violent crime (see, Fajnzylber et al., 2002; Rocque et al., 2019).
4.2.2. Independent variables
The main independent variable of interest is the gross upper secondary school enrolment rate (Enrolment Rate). We use this measure of the level of upper secondary school participation to capture the level of the “being-in-school” effect on crime at the macro-level. The latter is a measure of the number of students enrolled in upper secondary education, regardless of age, as a proportion (percentage) of the total official population of the corresponding age group (UNESCO Institute for Statistics, 2009). However, we include the male enrolment rate (Male enrolment) as another indicator of education in separate models as a form of robustness check.
As argued earlier, theoretical and empirical evidence indicate that young uneducated males commit more crimes than females (Elonheimo et al., 2014; Hjalmarsson et al., 2015; Hövermann
& Messner, 2021; Moffitt et al., 2006). Therefore, if school enrolment generally has any negative effect on crime, as hypothesised, this must be true of male enrolment.
4.2.3. Control variables
We selected and controlled for several economic, demographic, and deterrence effects that have been demonstrated to affect the crime rate to minimise potential confounding effects. Regarding economic factors, we control for the level of youth unemployment (Levitt, 2001), the level of inequality (Fajnzylber et al., 2002), and economic growth (Rosenfeld & Fornango, 2007).
Unemployment is the proportion of youth unemployed (Youth Unemployment) measured as the share of the labour force aged 15–24 without work but available for and seeking employment. The inequality rate (Inequality Level (GINI)) is measured as the Gini index, whereby an index of “0”
represents perfect equality, while an index of “100” implies perfect inequality. Economic growth is measured as the annual percentage growth rate of gross domestic product (GDP) per capita (GDP Per Capita Growth). The GDP values are aggregates based on constant 2010 U.S. dollars at purchase prices to control for inflation and population variation.
Concerning demographic factors, we control for peak crime traits (Witte, 1997), population density (Nolan, 2004), and upper secondary school attainment. Peak crime trait is measured as the number of males aged 15–24 (Male Age [15–24]) as a proportion (%) of the total population.
Population density (Population Density) is measured as the midyear population of a country divided by the country’s land area in square kilometres. Since several other studies have used educational attainment as a measure of education in education-crime-related studies, we control for upper secondary school attainment in separate models to check our assumption of a “being-in-school” effect on crime. Attainment (Attainment) is measured as the number of
persons of upper-secondary school age who have completed the last grade of upper secondary education as a proportion (%) of the total population of upper secondary school age. For deterrence, we control for the existence of the death penalty (Death Penalty) and the effective- ness of the rule of law (Effective Rule of Law) in a country. The death penalty is measured as a dummy variable, whereby countries that retain the death penalty for ordinary crimes in the observed year are assigned a dummy of “1”. Countries that are abolitionist in practice are not considered as having the death penalty. The rule of law is used as a proxy to measure the effectiveness of the criminal justice system. It measures the perception of the extent people have confidence in the police, courts, property rights, as well as the likelihood of crime and violence, and ranges from approximately −2.5 to 2.5.
We investigated multicollinearity, thus the correlation between the independent variables, using variance inflation factor (VIF). The highest and the mean VIF is 4.75 and 2.12, respectively, for the theft rate sample. For the homicide rate sample, the highest VIF is 4.17, with a mean of 2.10. Since these values are all below the critical value of 5, this indicates normality in the explanatory variables. Table 1 summarises all the variables and the sources of data.
4.3. Data analysis
4.3.1. Pooled ordinary least square (pooled OLS) estimates
As stated earlier, we begin analysing the relationship between upper secondary school enrolment and the rate of crime by pooling the data with no fixed effect. In this way, we could observe a simple reduced-form relationship between the rate of crime, log(Crimeji) (j = log of theft or homicide rates) and educational enrolment (Enrolmenti) in Sub-Saharan Africa, conditional on other observed national characteristics (Xi) in the equation:
log Crimeji
� �
¼β0þβ1EnrolmentiþγXiþεi (1)
where β0 is the constant term, β1 captures the coefficient of the net effect of educational enrolment on the rate of crime in SSA, Ɛ is the error term that is assumed to have the usual noise properties, and subscript i is the unit of observation (country*year). The pooled OLS regres- sion estimation assumes that the error variance (Ɛi) is identical (homoscedastic) and uncorrelated across units and over time.
4.3.2. Fixed-effect (FE) estimates
Since panel data usually barely meet the assumption of identical and correlated error variance across units, we utilise a fixed-effect (FE) estimator of panel data analysis, where the unobserved entity-specific effects are modelled as part of a basic panel equation, as follows:
log crimejit
� �
¼β0þβ1EducationitþγXitþσdt03þ. . .þσdt18þvit (2) where log(crime) is the dependent variable (DV) with j as either Theft Rate or Homicide Rate. The subscripts i and t represent entity (country) (i = 1, 2, 3, . . . n) and time (year) (t = 2003, 2004, 2005, . . . .2018), respectively. β0 is the constant term, Β1 is the vector of coefficient for Education;
the main independent variable (IV) entered as Enrolment Rate (and Male Enrolment as a form of robustness check) for each entity and time. X represents a vector of one control variable as IV with its associated vector of coefficient (γ) to be estimated. dt is a dummy variable for each period (2003–2018) that does not change across entities (i), which is why it has no i subscript. The error component (v) is the composite error term, assumed to have the usual noise properties. It is the purely random part of the error term. It can be decomposed into two parts as:
vit = ui + eit, where ui is the individual heterogeneity (unobserved country-fixed effect) and eit is the idiosyncratic shock.
4.3.3. Instrumental variable (IV) two-stage least squares (2SLS) Estimates
The instrumental variable (IV) estimator is implemented because we assume that school enrol- ment in school is not strictly exogenous to the dependent variables. The crime level may be correlated with the level of educational participation. This is because crime has an economic benefit (Becker, 1968) that may encourage habitual offenders who are not caught and punished not to participate in school but rather engage in crime. Thus, high participation in crime may imply low attachment to school. The methodological issue presented here is thus the problem of endogeneity or reverse causation. Another methodological problem is the possibility of omitted variables in the FE estimates. An instrumental variable estimator can handle errors from reverse causation or joint endogeneity, where the covariance of two or more variables in estimation can be corrected. It is also efficient at dealing with omitted variable bias. From the above, we analyse the relationship between enrolment and the rate of crime using a two-stage least-squares estimate that takes the form of the following basic equation:
log crimejit
� �
¼β0þβ1EnrolmentitþγXitþσdt03þ. . .þσdt18þuiþeit¼Zitσþuiþeit (3) Table 1. Variables, operationalisation, and data sources
Variable Operationalisation of variable Source
Dependent Variables 1. Theft rate 2. Homicide rate
Log of number of crimes (theft or homicide) per 100,000 population.
United Nations Office on Drugs and Crime (2018) and Official National Sources5 Independent Variables
Upper Secondary School Enrolment Rate Gross enrolment rate in upper secondary school, regardless of age, as a proportion (%) of the official total population of upper secondary school age.
UNESCO Institute for Statistics (2021)
Male Enrolment Gross male enrolment rate of males in upper
secondary school, regardless of age, as a proportion (%) of the official total population of the corresponding age group.
Control Variables
Youth Unemployment Labour force aged 15–24 without work but available for and seeking employment.
World Bank (2021)
Inequality Rate Gini index with index “0” representing perfect equality and index 100 perfect inequality.
GDP Per capita Growth Annual percentage growth rate of gross domestic product (GDP)
Population Density Mid-year population of a country divided by the country’s land area in square kilometres.
Upper Secondary Attainment rate Persons of upper secondary school age who have completed the last grade of upper secondary education as a proportion (%) of the total population of upper secondary school age.
UNESCO Institute for Statistics (2021)
Male Age (15–24) The number of males aged 15–24 as
a proportion (%) of the total population.
World Bank (2021)
Death Penalty Dummy variable of “1” for countries that retain the death penalty for ordinary crimes.
Amnesty International (2018)
Effective rule of law Perception of people’s confidence in the police and courts as well as the likelihood of crime.
World Governance Indicators (2019)
Cost Elimination National policy intervention or legal framework that eliminates registration fees and tuition fees.
National official sources
where Enrolment (and Male enrolment as robustness checks) is treated as an endogenous regres- sor, and Z is the instrument for the endogenous regressor. The other interpretations in the equation are the same as explained under Equation (2). Moreover, with the IV estimator, the random error component (ui + eit) can also correlate with the instrument, therefore, this error part is repeated.
Studies in advanced economies have mainly used compulsory school-leaving age or minimum- dropout-age policies to address reverse causation or omitted-variable-related methodological issues (Anderson, 2014; Lochner & Moretti, 2004; Machin et al., 2011). In this study, we use cost elimination as an instrument (Z) for the enrolment rate. Cost elimination refers to access-oriented policies designed to offer free education to children and youth at different levels of education (World Bank, 2009, p. 1). Many researchers have concluded that financial constraints (mostly registration fees and tuition fees) are the most important barriers to accessing basic education in developing countries (Al-Samarrai & Zaman, 2007; Bray, 1987; Petrosino et al., 2012). A recent study by Naape et al. (2020) demonstrated that increasing education-related spending by elim- inating or reducing the direct cost of schooling increases enrolment. Based on this empirical knowledge, we use fee-free policies, which have been implemented in some countries at the high- school level, as an instrument for enrolment.
Following the Results for Development Institute’s (R4D; 2015)6 categorisation of types of educa- tional cost, cost elimination (Cost Elimination) is measured as a national policy or legal framework that eliminates registration fees and tuition fees at the upper secondary school level in a country.
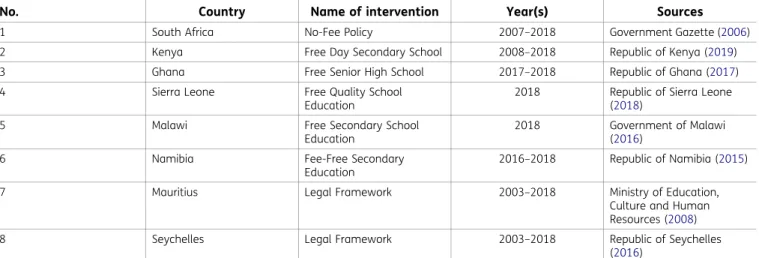
This is the most conservative form of defining school fees (Branson & Lam, 2017). This means, apart from any other form of subsidy or cost-sharing that may be in existence, students at the upper secondary school level do not pay registration fees or tuition fees before they are enrolled in school because there is a specific government policy or legal framework that absorbs these cost items. I use national official sources to identify the presence of cost elimination policies as operationalised in this study rather than using the UIS dataset. This is because fee-free education may formally be reported, but in reality, it may not exist since students may be required to pay registration fees before they are enrolled. This caution is also highlighted by Branson and Lam (2017).7 A dummy variable of “1” is created for each observation with the presence of cost elimination. Table 2 illustrates those countries with cost elimination and year(s) of implementation.
The relevance and validity of the instrument: In IV estimation, a critical issue is investigating and identifying an instrument that satisfies two basic assumptions: 1) the instrument should be relevant in that it should be strongly correlated with the endogenous regressor (Enrolment); the stronger the correlation, the better, and; 2) it should be uncorrelated with the idiosyncratic part of the random error term (eit) and can only affect the dependent variable through the endogenous regressor. In estimating 2SLS, Staiger and Stock (1997) and Stock and Yogo (2005) proposed a rule of thumb for the first stage regression. According to the latter, at the first stage in a single endogenous regressor, the proposed instrumental variable for the endogenous regressor (in addi- tion to all other exogenous regressors) should have a joint F statistic greater than 10 (F > 10). An F statistic greater than 10 demonstrates that we do not have to worry about having a weak instrument (Wooldridge, 2016, p. 478).
Furthermore, before we can accept the results from the IV estimation at the second stage, it is important to investigate if the implementation of the policy used as an instrument affects any unobserved variable(s) that affect the outcome of interest—for example, an increase in the resources of security agencies dedicated to fighting crime, or an increase in the income of house- holds. Theoretically, the police are the most important component of the internal security capacity to reduce crime through prevention strategies (Abdelmottlep, 2016). However, tracking the trends in the resources allocated to the police and criminal justice system is more difficult due to the unavailability of data related to police personnel and police expenditure in the context of this
study. Accordingly, we rely on government expenditure on the military as a percentage of general government expenditure to measure the variation in security expenditure. Relying on military expenditure, although not a perfect measure of internal security, can still give a sense of how Table 2. Countries with cost elimination (Fee-free education) at upper secondary level and year(s) of implementation with a dummy of “1”
No. Country Name of intervention Year(s) Sources
1 South Africa No-Fee Policy 2007–2018 Government Gazette (2006)
2 Kenya Free Day Secondary School 2008–2018 Republic of Kenya (2019)
3 Ghana Free Senior High School 2017–2018 Republic of Ghana (2017)
4 Sierra Leone Free Quality School
Education
2018 Republic of Sierra Leone (2018)
5 Malawi Free Secondary School
Education
2018 Government of Malawi (2016)
6 Namibia Fee-Free Secondary
Education
2016–2018 Republic of Namibia (2015)
7 Mauritius Legal Framework 2003–2018 Ministry of Education,
Culture and Human Resources (2008)
8 Seychelles Legal Framework 2003–2018 Republic of Seychelles
(2016)
Notes: Some other countries such as Uganda may have cost elimination but are excluded from this table and the analysis since there is not enough data on other variables for use in this study.
Source: Authors’ compilation from national official sources.
Figure 1. Crime trends by country.
much governments in SSA have generally been committed to security over the years. In terms of an increase in the income of households, which may affect crime, to the best of our knowledge cost elimination generally absorbs the cost of schooling and does not involve providing direct material support to households, thus we do not expect the implementation of such policies to increase household income. All other pieces of information are presented in the results section.
4.3.4. Robustness checks
To check the consistency and the reliability of the results, however, we introduce homogeneity into the dataset for robustness checks. We use only countries with data for the two dependent variables (theft and homicide) in the analysis. Furthermore, we use the original theft and homicide rates (thus rate per 100,000 of the population) as the dependent variables to check the power of significance and direction of our assumptions. Throughout the robustness checks, the direction of the relationship between the main variables and their significance level did not change from the results presented in the main study.8
5. Results
5.1. Descriptive statistics
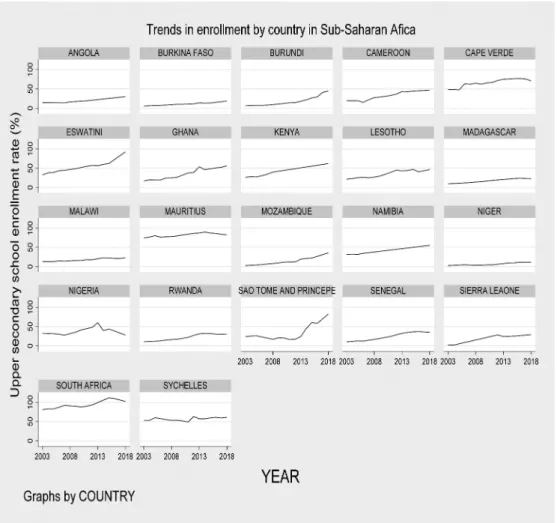
We first present descriptive statistics about the data used in the analysis.9 figure 1(a,b) plots the trend in theft and homicide, respectively, over time (2003–2018) in logs for the countries included Figure 2. Upper secondary
school enrolment trends in SSA by country.
in the study. The trends show an increase in crime over time for some countries and a decrease for others, while some have a relatively stable incidence of crime.
figure 2 shows the enrolment trend by country. From the plots, it appears that there is no uniformity in the rate of enrolment among countries. While some countries have a relatively high rate of enrolment (such as Mauritius, Cape Verde, and South Africa), others have a relatively low rate (including Angola, Burkina Faso, and Niger). In addition, some countries started at a very low rate of enrolment and have progressed steadily, such as Eswatini, Ghana, Kenya, and Sao Tome and Principe.
figure 3 plots the potential relationship between the main variables of interest (that is, theft, homicide, and the upper secondary school enrolment rate). From the figure, the data for theft indicate a declining trend. When the enrolment rate is low, we find a high number of data points on the upper-left side of the diagram. This suggests a potentially negative association. However, homicide does not appear to have a clear pattern of association. For the enrolment figures displayed on both the left and right, we have data points above and below the fitted line.
5.2. Pooled ordinary-least-square (Pooled OLS) estimates
Table 3 reports the results from the pooled OLS estimates. They indicate that the school enrolment rate may be strongly negatively associated with the rate of property crime in SSA with no significant relationship with the rate of violent crime. The focus on the results from the pooled OLS estimates is observing the relationship between the main variables without any fixed effects.
From the results, enrolment and male enrolment rate have a significant impact on the theft rate in the negative direction with or without the control of school attainment. Youth unemployment and inequality level are consistently significant in the positive direction for all indicators of crime. These economic variables indicate that unfavourable economic conditions may have some positive relationship with the rate of crime in SSA.
Figure 3. Scatterplot of the level of theft and homicide by enrolment in SSA.
Although the models of the OLS estimator yield a very high R-squared (minimum of 58% total variation of the dependent variables), it is still important to investigate the assumptions using the FE estimator for two reasons. One, further investigations may reveal the violation of the basic assumptions of the pooled OLS.10 Two, the possibility of multiple unobserved variables in the potential education-crime relationship. The fixed-effect estimator of panel data is assumed to yield unbiased and consistent parameter estimates in the presence of correlated and heteroske- dastic error terms across panels.
5.3. Fixed-effects (FE) estimates
The FE results show that many of the variables in the OLS estimates which have significant coefficients are no longer significant. However, the results (as presented in Table 4) show the significant relationship between enrolment rate and theft and the coefficients take a negative sign.
However, the enrolment rate is insignificant without controlling for upper secondary school Table 3. Pooled OLS estimates of the effect of education on crime in Sub-Saharan Africa
Explanatory Variables
Dependent Variables (in logs)
Theft Homicide
(3.1) (3.2) (3.3) (3.4) (3.5) (3.6)
Enrolment Rate −0.023** −0.041*** 0.001 −0.003
(0.01) (0.01) (0.00) (0.00)
Male Enrolment −0.020** −0.003
(0.01) (0.00)
Youth Unemployment
0.071*** 0.085*** 0.068*** 0.036*** 0.038*** 0.038***
(0.01) (0.01) (0.01) (0.00) (0.00) (0.00)
Inequality Level (Gini)
0.071** 0.085*** 0.067** 0.021*** 0.017*** 0.022***
(0.02) (0.02) (0.02) (0.00) (0.00) (0.00)
GDP Per Capita 0.062 0.083 0.062 −0.025** −0.031** −0.024**
(0.05) (0.06) (0.05) (0.01) (0.02) (0.01)
Male Age (15–24) −0.071** −0.095*** −0.071** −0.004 0.007 −0.007
(0.02) (0.02) (0.02) (0.01) (0.01) (0.01)
Population Density 0.002** 0.000 0.002** −0.000 0.000 −0.000
(0.00) (0.00) (0.00) (0.00) (0.00) (0.00)
Attainment 0.012 0.011*
(0.01) (0.01)
Death Penalty −1.187*** −1.312*** −1.217*** 0.326* 0.415** 0.272
(0.25) (0.29) (0.24) (0.17) (0.17) (0.17)
Effective rule of law 0.959*** 0.077 0.848*** −0.039 −0.202** −0.009
(0.19) (0.29) (0.18) (0.08) (0.10) (0.08)
Constant 2.610** 2.141** 2.771** 0.368 0.148 0.411
(0.89) (0.88) (0.90) (0.27) (0.28) (0.26)
No. of Observations 240 208 240 304 241 304
R-square .59 .58 .58 .64 .69 .64
Notes: All standard errors are corrected for heteroskedasticity (robust) in parentheses. Each row is a separate regression. Columns (3.2) and (3.5) control for school attainment; Columns (3.3) and (3.6) use Male Enrolment Rate as the main explanatory variable instead of Enrolment Rate in Columns (3.1) and (3.4). All rows control for the year effect in dummies of 16 years (2003–2018). Coefficient estimates are multiplied by 100. Asterisks denote significance for the coefficient at the following levels: ***p < .001, **p < .01, *p < .05.
attainment. When attainment is controlled for, enrolment has a significant negative effect of 1.6%
on the theft rate, holding all other variables constant. This shows that the “being-in-school” effect on the theft rate is stronger in SSA than the role of attainment. In addition, male enrolment has a significant negative effect of 1.5% on the theft rate, holding all other variables constant, and without controlling for attainment. These results further show that having more male youths in school (regardless of the level of attainment) may have a stronger negative effect on the theft rate than the general enrolment rate. There is no statistically significant effect at the conventional level of 5% on the homicide rate.
The differences in the results between the pooled OLS and the FE estimates may be due to the unobserved characteristics in countries such as the school system, culture, or the nature of the Table 4. Fixed-effects (FE) estimates of the effect of education on crime in Sub-Saharan Africa
Explanatory Variables
Dependent Variables (in logs)
Theft Homicide
(4.1) (4.2) (4.3) (4.4) (4.5) (4.6)
Enrolment Rate −0.010 −0.016** 0.002 0.005
(0.01) (0.01) (0.00) (0.00)
Male Enrolment −0.015** 0.001
(0.01) (0.00)
Youth Unemployment
−0.026 −0.032 −0.022 0.025 0.015 0.026
(0.04) (0.04) (0.03) (0.02) (0.01) (0.02)
Inequality Level (Gini)
0.045** 0.048* 0.049** 0.002 −0.007 0.002
(0.02) (0.02) (0.02) (0.01) (0.01) (0.01)
GDP Per Capita −0.009 0.003 −0.008 −0.008 −0.003 −0.008
(0.01) (0.01) (0.01) (0.01) (0.01) (0.01)
Male Age (15–24) −0.162 0.077 −0.154 −0.143** −0.166** −0.143**
(0.12) (0.10) (0.13) (0.05) (0.04) (0.05)
Population Density −0.003 −0.001 −0.002 −0.003 −0.001 −0.003
(0.01) (0.01) (0.01) (0.01) (0.01) (0.01)
Attainment −0.016 0.013
(0.01) (0.01)
Death Penalty −0.921* −0.321 −0.924* 0.489 0.386 0.493
(0.52) (0.37) (0.51) (0.36) (0.34) (0.36)
Effective rule of law 0.251 −0.195 0.289 0.438 −0.063 0.445
(0.63) (0.54) (0.63) (0.36) (0.26) (0.35)
Constant 7.669** 1.639 7.402** 4.906** 5.497*** 4.879**
(3.42) (2.86) (3.33) (1.51) (1.29) (1.47)
No. of Observations
240 208 240 304 241 304
No. of countries 15 13 15 19 16 19
R-Square .29 .36 .33 .23 .33 .23
Notes: All standard errors are corrected for heteroskedasticity (robust) clustered on the country level in parentheses. Each row is a separate regression. Columns (4.2) and (4.5) control for school attainment; Columns (4.3) and (4.6) use Male Enrolment Rate as the main explanatory variable instead of Enrolment Rate in Columns (4.1) and (4.4). All rows control for the year effect in dummies of 16 years (2003–2018). Coefficient estimates are multiplied by 100. Asterisks denote significance for the coefficient at the following levels: ***p < .001, **p < .01, *p < .05.
crime reporting system. Some observed economic conditions, including the level of unemployment or inequality, may account for the incidence of crime in some years in individual countries irrespective of the level of educational enrolment. Notwithstanding this, from both the OLS and FE estimates educational enrolment seems to explain variation in the rate of theft without accounting for significant variation in the homicide rate. We cannot, however, make conclusions from these results due to the methodological issue of reverse causation and the possibility of omitted variable bias. We therefore further investigate the education-crime nexus using the IV estimator.
5.4. Instrumental variable (IV) two-stage least squares estimates
In the IV estimates, we first check if our instrument is not weak—or in other words, if the instrument is relevant and valid. We present the results in Table 5. In Columns 5.1 to 5.4, it can be seen that the F-statistic in all models is greater than 10, showing that the instrument is valid and relevant. Second, the instrument strongly predicts educational enrolment positively. This is true of individual samples based on the dependent variables. It is also true when the instrument alone is regressed on the endogenous variable, as well as when all other covariates are added.
Finally, in Columns 5.5 and 5.6 we find no statistically significant evidence that indicates that the presence of cost elimination has led to an increase in the resources of the military. These pieces of information eliminate concern about the weakness of the instrument. Since the instrument satisfies all the listed assumptions, it means that the coefficient (β) of the IV estimator is consistent. Therefore, if the effect of the upper secondary school enrolment rate varies across countries, and if there are gains for enrolment from cost elimination, the IV estimator in the second stage should be interpreted as the effect of enrolment on crime owing to the margin of higher enrolment due to cost elimination.
The second-stage regression from the IV estimates is presented in Table 6. The estimate for property crime suggests a significantly negative effect of enrolment on the theft rate with or without controlling for attainment. Male enrolment as a robustness check variable is also signifi- cant and robust compared to the fixed effect estimates. Since we capture here solely the “being-in -school” effect on crime, we use the estimate in Column 6.2, which controls for attainment, in the discussions. Results show that a 1% increase in the enrolment rate is associated with an average 3.3% decrease in the theft rate, holding all other variables constant. Turning our attention to violent crime, the estimate is statistically insignificant. This means that, similarly to the previous Table 5. First-stage regressions and the effect of cost elimination on military expenditure
Explanatory variable
Enrolment Rate Military
Expenditure Theft rate sample Homicide rate sample
(5.1) (5.2) (5.3) (5.4) (5.5) (5.6)
Cost Elimination 17.26*** 22.29*** 14.02*** 19.87*** −0.28 −0.64
(2.86) (3.64) (2.26) (2.85) (0.47) (0.48)
No. of Observations
240 240 304 304 336 336
No. of countries 15 15 19 19 21 21
F-statistic 12.07 37.41 15.29 48.60
R-square .58 .14 .57 .15 .24 .01
Covariates included
Yes No Yes No Yes No
Notes: Columns (5.1) and (5.3) control for all the variables included in the analysis. Columns (5.2) and (5.4) do not have any controls. All standard errors are corrected for heteroskedasticity (robust) clustered on the country level in parentheses. Asterisks denote significance for the coefficient at the following levels:
***p < .001, **p < .01, *p < .05.
results, we cannot associate an increase or decrease in the homicide rate with school enrolment.
In summary, we can accept Hypothesis 1 but reject Hypothesis 2.
It seems that the statistical significance of the results on the main independent variable and theft rate is consistent in all the estimation strategies. Comparing the magnitude of the effect in the FE estimate in Table 4 to the IV estimate in Table 6, there is a significant difference in the decrease in the theft rate due to educational enrolment. figure 4 compares the average marginal effects of the coefficient estimates from the two estimators. It may be observed that whereas a 1% increase in high school enrolment reduces the rate of theft on average by 1.6%, the reduction is 3.3% when enrolment is estimated as a function of cost elimination. This means that, in general, cost elimination further induces a lower theft rate. From these results, it is plausible to think that Table 6. 2SLS IV estimates of the effect of education on crime in SSA
Explanatory Variables
Dependent Variables (in logs)
Theft Homicide
(6.1) (6.2) (6.3) (6.4) (6.5) (6.6)
Enrolment Rate −0.039*** −0.033*** 0.009 0.013
(0.01) (0.01) (0.01) (0.01)
Male Enrolment −0.036*** 0.009
(0.01) (0.01)
Youth Unemployment
0.015 −0.015 0.002 0.019 0.005 0.020
(0.05) (0.04) (0.04) (0.02) (0.02) (0.02)
Inequality Level (Gini)
0.072* 0.064* 0.066*** −0.004 −0.016 −0.004
(0.02) (0.02) (0.02) (0.01) (0.01) (0.01)
GDP Per Capita 0.001 0.011 −0.001 −0.010 −0.005 −0.010
(0.01) (0.01) (0.01) (0.01) (0.01) (0.01)
Male Age (15–24) −0.068 0.162 −0.099 −0.155* −0.190* −0.153*
(0.17) (0.16) (0.15) (0.05) (0.07) (0.05)
Population Density −0.001 0.000 −0.001 −0.004 −0.002 −0.004
(0.01) (0.01) (0.00) (0.01) (0.01) (0.01)
Attainment −0.015 0.011
(0.02) (0.01)
Death Penalty −0.726 −0.151* −0.837** 0.457 0.367 0.471
(0.55) (0.38) (0.53) (0.36) (0.34) (0.36)
Effective rule of law 0.565 −0.093 0.491 0.308 −0.199 0.329
(0.69) (0.52) (0.68) (0.42) (0.32) (0.41)
Constant 4.404 −1.017 5.486* 5.352** 6.432** 5.275**
(4.87) (4.78) (4.25) (1.75) (2.45) (1.70)
No. of Observations
240 208 240 304 241 304
No. of countries 15 13 15 19 16 19
R-square .17 .27 .21 .19 .28 .19
Notes: All standard errors are corrected for heteroskedasticity (robust) clustered on the country level in parentheses. Each row is a separate regression.
Columns (6.2) and (6.5) control for school attainment; Columns (6.3) and (6.6) use Male Enrolment Rate as the main explanatory variable instead of Enrolment Rate in Columns (6.1) and (6.4). All rows control for the year effect in dummies of 16 years (2003–2018). Coefficient estimates are multiplied by 100. Asterisks denote significance for the coefficient at the following levels: ***p < .001, **p < .01, *p < .05.
when cost elimination is implemented, this affects educational enrolment positively, with a stronger significant negative effect on the theft rate.
6. Discussion, limitations and conclusions
In this paper, we estimate the effect of high school enrolment rate on the crime rate in Sub- Saharan Africa (SSA). We use macro-to-macro level indicators and utilise government policies in the form of “fee-free” education as an instrument for school enrolment. This adds to the body of literature that describes the positive externality of education on crime (Bennett, 2018; Hjalmarsson et al., 2015; Hjalmarsson & Lochner, 2012; Lochner, 2004; Lochner & Moretti, 2004). In using macro-level enrolment, we learn about how a social structure (that is, the national rate of school- ing or “being-in-school effect”) affects the national crime rate. After controlling for several other macro-level factors, the estimates from the pooled OLS and fixed-effects panel data analysis indicate that the effect of a high school enrolment rate is significantly negative for property crime proxied by the rate of theft. Male enrolment used as another indicator of education led to similar results.
However, in the fixed-effect estimates which consider unobserved country-fixed effects, enrol- ment is only significant (with a magnitude of −1.6%) in relation to the rate of theft when high school attainment is controlled. This may be because educational attainment may increase expectations of achieving high-status jobs that the economies of developing countries in SSA cannot provide. An increase in educational access does not automatically translate into better job creation (Teal, 2021). Therefore, a high proportion of high-school graduates without the economic growth required to create employment, coupled with a high rate of income inequality, may lead to a strong incentive to steal, as individuals have lower absolute or relative salaries.
These speculations are supported by Kingdon and Knight’s (2007, p. 842) study in South Africa, Figure 4. Comparison of FE and
IV estimations of the average marginal effects of enrolment on the rate of theft.
which argued that the rise in unemployment and income inequality may lead people to engage in illegal acts such as “crime and theft”.
In dealing with the problem of omitted variable bias and/or reverse causation in the education-crime relationship, we used cost-elimination so-called “fee-free education” as an instrument for the enrolment rate, which was treated as an endogenous regressor in two-stage instrumental variable estimations.
These estimates reflect the causal effect of education on crime and Bell et al.’s (2018) idea of education- policy-induced crime reduction. We find that the relationship between enrolment and the rate of theft is robust and significantly negative with or without controlling for school attainment. In addition, the negative effect of 3.3% on average is higher than the fixed effect estimates of −1.6% on average. These results show that the immediate and rapid increase in enrolment through specific policies of cost elimination in the form of social support programmes have the further positive benefit of reducing the rate of theft in society. From our estimates, it is plausible to believe that policies aimed at increasing upper secondary school enrolment in SSA have a negative effect on the rate of theft, lending credence to Cullen’s (1994) social support theory.
The study confirms a recommendation by Jonck et al. (2015, p. 150) who suggested examining
“the potential effect of formal education in reducing crime” and recommended widening “the spectrum of interventions aimed at increasing school retention up to completing [high school]
grade 12” in South Africa. In this study, we provide causal evidence about the positive externality of education on crime through utilising government policies to increase high school enrolment. In the international literature, Hjalmarsson and Lochner (2012, p. 54) argue that “policies designed to encourage schooling among more crime-prone groups are likely to produce the greatest benefit from crime reduction”. In terms of violent crime, proxied by the homicide rate, however, there is no statistically significant relationship. What may explain this is that property crime in general and theft, in particular, is a common criminal offence among uneducated youth in SSA, unlike homicide (Jonck et al., 2015). Again, as commonly argued in the crime literature, socioeconomic factors such as the rate of educational enrolment are more likely to affect property crimes, while crimes against the person, typically homicide, may depend on more complicated predictors difficult to account for using aggregated data (Pratt & Cullen, 2005). A distinct mechanism between education and violent crime may require further investigation, a suggestion put forward by Ades and Mishra (2021).
Furthermore, these results are consistent with Killias and Aebi’s (2000) speculation that improving educational opportunities in Europe may reduce crime rates. They also support Buonanno and Montolio’s (2008) study in the Spanish Provinces that concluded that education is negatively related to property crime. Nevertheless, the results disprove Austin and Kim’s (1999) conclusion about the positive signifi- cant relationship between education and homicide in SSA. Due to the inability to clearly operationalise education and the overlooked omitted variable or reverse-causation methodological issues in their study, we reject their results. The conclusions of Muchwanju et al.’s (2015) study are largely in line with the findings presented in this study about the education-theft relationship. This is because in the fixed-effect estimates we find a negative and insignificant relationship. The study of the former, how- ever, ignored the possibility of omitted variable bias (for example, educational attainment and reverse causation, which are taken care of in this study, causing enrolment to have a significant effect). This suggests that when using enrolment as a measure of education to estimate the effect on crime which captures the being-in-school effect, it is necessary to control for the level of educational attainment and to consider the potential effect of any other omitted variables.
6.1. Limitations and directions for further research
The study is limited in several ways. One is the inability to obtain crime data disaggregated by age.
This would provide insight into how the criminal behaviour of the cohort of interest, conditional on the level of social support received through cost elimination, affects the macro-level crime rate.
Future studies may consider this limitation and study it in detail, especially at the individual level and across levels. Two, the source of crime data that was used lacks data for many countries, leading to the exclusion of some countries from the analysis. Nevertheless, from the macro-level