M. A. EI-Samanoudi
1, M. F. Abd-Rabo
2, A. A. Sarhanj
3, M. Attia
4.
1-Faculty of Eng., Ain Shams University.
2-Shoubra Faculty of Eng., Zagazig University.
3-Environmental Researches & Studies Institute, Ain Shams University 4-Central Laboratory For Environmental Quality Monitoring, National Wa- ter Research Center, Ministry of Water Resources and Irrigation.
IMPACT OF WATER DESALINATION TECHNOLOGIES ON ENVIRONMENTAL DEVELOPMENT
Abstract
A comparison was made between the Reverse Osmosis (RO) and Multistage Flash (MSF) technologies under different evaluation parameters. Mathematical models for both MSF and RO were developed using lab view 4 software to compare various parameters that affect the plant performance. A comparison study was car- ried out to make the selection decision between RO and MSF plants much easier.
The study shows that MSF has a great thermal pollution. It also takes a long installa- tion time and need long time to start and shutdown with no partial operation availa- bility. Also it can handle any type of feed water with simple pretreatment. Top brine temperature is the main parameter that affects its operation and the performance ratio improved by raising it. The RO Plants have no thermal pollution and are very compact compared with MSF plants. It takes short time to start operation and to shutdown with the availability for partial operation. The feed water pretreatment for RO is very critical and important process. Consequently the rejected water contains hazards chemicals. The RO is very simple process so it needs technical labor re- quirements less than MSF. The main parameters that affect RO operation perfor- mance are pressure, concentration polarization and flow velocity. The RO plants have a lower potential for scaling formation and corrosion than MSF. The RO con- sumes inlet seawater 3 to 1 times of fresh water produced but the MSF needs 8-10 times. The RO plants are suitable for operation without being associated with power plant. But the MSF plants are not suitable for this. For long time operation the RO cost for one meter cubic of fresh water is less than MSF by about 35 % approximate- ly.
1. Introduction
A desalting device essentially separates saline water into two streams: one with a low concentration of dissolved salts (the fresh water stream) and the other contain- ing the remaining dissolved salts (the concentrate or brine stream). The device re-
quires energy to operate it and can use a number of different technologies for the separation. This technology could be classified into two main categories, methods to produce large quantities of water and methods to produce small quantities of water.
The methods to produce large quantities of water are classified into two subcatego- ries: thermal processes, like Multistage Flash (MSF) , Multiple Effect Distillation (MED) and Vapor Compression Distillation (VC) and membrane process like Elec- trodialysis (ED) and Reverse Osmosis RO. The MSF and RO are widely used all over the world.
2. The Multistage Flash (MSF) Process
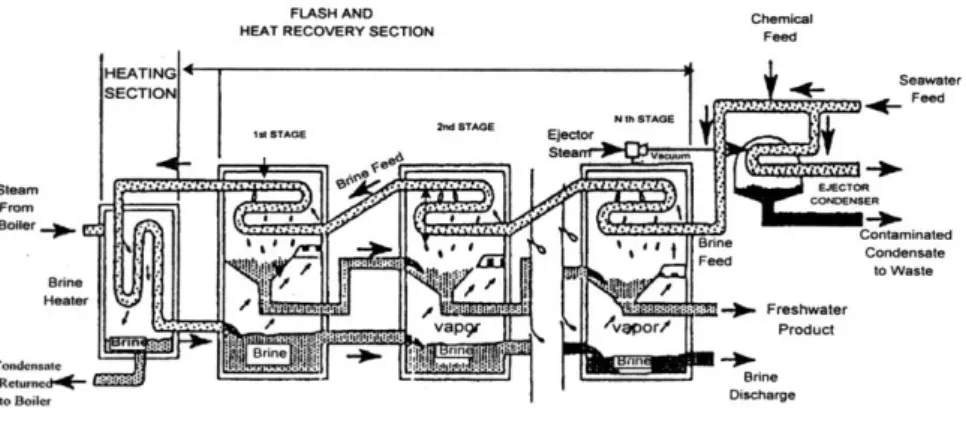
In the MSF process shown in Figure 1, sea water is heated in a vessel called the brine heater, this is generally done by condensing steam on a bank of tubes that passes through the vessel which in turn heats the sea water.
Figure 1: Diagram of a multi-stage flash distillation plant
This heated seawater then flows into another vessel, called a stage, where the ambient pressure is such that the water will immediately boil. The sudden introduc- tion of the heated water into the chamber causes it to boil rapidly, almost exploding or flashing into steam. Generally, only a small percentage of this water is converted into steam (water vapor), depending on the pressure maintained in this stage since boiling will continue only until the water cools (furnishing the heat of vaporization) to the boiling point. Stages set at increasingly lower atmospheric pressures were developed. In this unit, the feed water could pass from one stage to another and be boiled repeatedly without adding more heat. Typically, an MSF plant can contain from 4 to about 40 stages. The steam generated by flashing is converted to fresh water by condensing on tubes of heat exchangers that run through each stage the tubes are cooled by the incoming feed water to the brine heater. This, in turn, warms
up the feed water so that the amount of thermal energy needed in the brine heater to raise the temperature of the seawater is reduced.
3. The Reverse Osmosis (RO) Process
RO is a membrane separation process in which the water from a pressurized sa- line solution is separated from the solutes (the dissolved material) by flowing through a membrane as shown in Figure 2.
Figire 2: Typical flow sheet-Seawater RO with pre-treatment system No heating or phase change is necessary for this separation. The major energy required for desalting is for pressurizing the feed water. In practice, the saline feed water is pumped into a closed vessel where it is pressurized against the membrane.
As a portion of the water passes through the membrane, the remaining feed water, increased in salt content, will also pass through the membrane. Without this con- trolled discharge, the pressurized feed water would continue to increase in salt con- centration, creating such problems as precipitation of supersaturated salts and in- creased osmotic pressure across the membrane. The amount of the feed water dis- charged to waste in this brine stream varies from 20 to 70 percent of the feed flow, depending on the salt content of the feed water.
An RO system is made up of the following basic components: Pretreatment, High pressure pump, Membrane assembly and Post treatment.
4. Mathematical Model
The lab-view software is developed to simulate process and control of parame- ters influencing. This software uses visualization technique for programming by using ready made function. It has the ability to design the function for any purpose and use it as a module. The mathematical model for MSF and RO was divided into classified groups of equations, each group have some input and output parameters.
These parameters may be constant or coming from another module (group). Each RO or MSF model consists of a group of modules for calculating different parame- ters of the model. Each model also can be used as a module within another module.
The following is the simple flow diagram of the modules for RO and MSF.
4.1 The Reverse Osmosis (RO) Module
The purpose of the mathematical model of the RO method is to assess how the different parameters: (Pressure, concentration polarization and velocity) influence the membrane system.
4.2 The Multistage Flash (MSF) Module
The purpose of the mathematical model of the MSF method is to assess how the different parameters influence the Multi Stage evaporation system. The study will focus on the effect of the top brine temperature on the performance ratio, flow rate of cooling water, flow rate of feed water, flow rate of circulating brine and the salin- ity of brine.
5. Environmental Impacts
Distillation plants generally require a larger seawater inlet flow than membrane processes, resulting in a smaller rise in salinity of the discharged brine. By contrast, the energy consumption of membrane plant is usually less than that of distillation plants, although the brine temperature rise is correspondingly lower.
Various chemical treatments are used in desalination to control formation of mineral scale and biological growth that would otherwise interfere with the process.
These chemicals, or their reaction products, are in turn discharged with the rejected brine. Certain atmospheric discharges also take place, for example from de-aeration and degassing of feed or product water.
This section examines and compares the environmental impacts of the two main seawater desalination processes, multistage flash distillation (MSF) and reverse osmosis (RO). The atmospheric emissions and thermal discharges from power gen- erating and/or boiler plant to produce the energy needed for desalination are also evaluated.
6. Environmental Considerations
6.1 Atmospheric emissions
The energy required is ultimately derived from the combustion of fossil fuels, ei- ther for the generation of electricity for RO processes, or for the generation of steam and auxiliary power for MSF and other distillation methods. The principal atmos- pheric emissions associated with the combustion of fossil fuels are as follow: Sul- phur dioxide (SOZ), Oxides of nitrogen (NOx), Suspended particulate matter (SPM), Carbon dioxide COz and Carbon monoxide CO
6.2 Thermal impacts
Rise in seawater temperature is related to the discharge of thermal effluents from desalination schemes, power stations and industrial plants are known to have impact upon marine organisms in a number of ways with certain communities, such as those at the limit of their geographical range, being particularly affected. For instance, elevated temperatures and increased salinity reduce the overall concentration of dissolved oxygen in the water, which restricts the life forms to those able to exist at low oxygen levels. This effect may be more pronounced with residual concentra- tions of chemicals used for de-aeration are present such as sodium metabisulphite.
Furthermore, at the level of the individual organism, extreme temperatures may result in death, whilst sublethal temperature can modify the rate at which biological processes occur thus influencing movement, the onset of maturity, life stage devel- opment in growth and size. At the species level, excessive temperatures may lead to changes in individual abundance and population diversity.
6.3 Chemical discharges
Chemicals used in desalination plants fall into three main categories: Biocides, Scale control and Anti foams.
A- Biocides. Traditionally chlorine or chlorine compounds have been used to dis- infect seawater intake systems and the associated downstream plant. The main pur- pose of Biocides to prevent bio fouling and the mechanism by which this works is to either kill the offending organisms or more usually to produce conditions that do not allow the organisms to settle. Modern analytical techniques and concerns about- halogenated hydrocarbons have led to the discovery of tri halo methane formations and the consequent risks to human health. Alternative biocides such as copper salts have been tried with varying sand in many areas. The discharge of copper in the brine at levels much less than 1 ppm is unsatisfactorily because of the environmental damage, which can arise through accumulation of the metal.
B- Scale control. Early scale control was achieved through the use of polymeric phosphate at threshold levels. Hydrolysis to orthophosphates led to problems of bacterial proliferation's within the dosing systems and contamination through the plant, particularly for RO. Phosphate discharged in the brine is also nutrient for all
biological growth with potential for eutrophication in slow moving enclosed waters.
The uses of polymeric additives based on malice anhydride have now eliminated this possibility.
C- Anti foams. Foaming of seawater in the flash stages of distillation plant is un- predictable but tends to be more severe where the demisters are close to the surface of the brine stream, allowing only a small volume for separation of aqueous and vapor phases. Stable foams tend not to form in pure boiling water because the stabil- ity depends on the presence of impurities in the water/vapor interface to increase liquid film strength.
7. Capital and operating costs
Capital costs for power and desalination plants considered are based on recent tender prices for similar co-generation plants.
The specific capital cost for steam power plant is taken to be $600/MW. [Year 1999]
For RO desalination unit the capital cost is considered equal to $1350/m3/d. For specific capital cost (Cd,) of MSF with capacities (D) ranging from 30000-45000 m3/d and performance ratio (R) =6-11 is calculated from the following equation [12].
0,658
0,736360 1100
360
D
R Cd
Where R= water product/steam consumption
Annual amortization is calculated from the plant lifetime and discount rate as in- verse of the present worth equation.
Amortization = Capital cost
r
nr
1 1
Where n = plant life times, years, r =discount rate
The desalination and power plant capital and operating costs are based on the following operating conditions:
Power plant load factor 170%
Desalination unit load factor 85%
Plant life time 20 year
Discounts rate 10%
RO membrane life 5 years
Fuel cost $ I 8 per barrel ($2.8 per GJ)
The common items include civil works (building, foundation), seawater intake out fall, electrical switch gear, instrument and control system.
The running costs include, fuel, spare parts, chemical, operation and mainte- nance costs.
The electrical power consumed by the desalination unit depends on its type of process, rated capacity, and performance ratio.
The operating and maintenance cost are taken to be equal to $0.69/1000 gal for MSF, $1.1 S/1 OOOgaI for RO.
MSF unit with TBT 124 °C and Gain output ratio equal 11
Table 1: Capital & Running costs of dual purpose plants, based on prices of years 1999.
Item MSF RO
Desalinate plant
Unit capital cost, million $ 63.00 47.25
Seawater intake & outfall, million $ 10.50 10.50
Backup heat source, million $ 13.12 13.12
O &M cost, million $/Y 1.87 3.09
Total Expenses for producing
electricity, m$/Y 27.27 30.64
Electricity Cost, $/kW hr 0.046 0.051
Total expenses for producing
water, million $/Y 19.42 15.43
Water cost, $/m3 l. 79 1.42
Power plant
Capital cost, million $ 4g
Levelized capital cost, million $/Y 5.63 Variable O & M cost, million $/Y 1.02
Fixed cost, million $/Y 0.69
Energy cost, million $/Y 24
Foundation & building, million $/Y 3.28 8. RESULTS
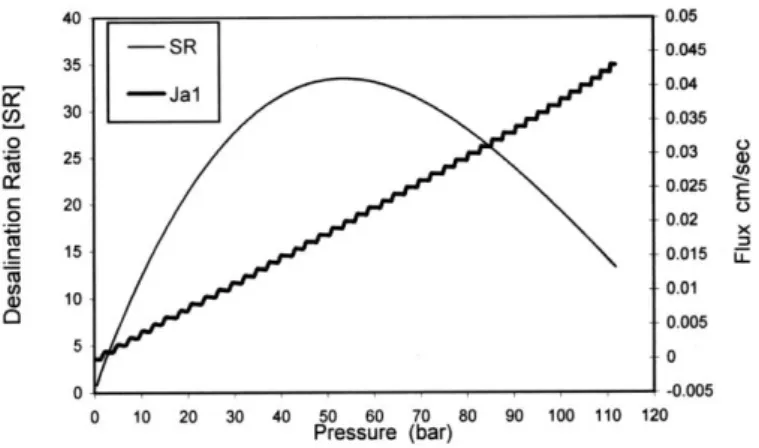
The operating pressure is the most important operating variable that influences the performance of the membrane. Figure 3 presents the permeate flux JA and the distillation ratio as a function of the difference between the inlet pressure and the osmotic pressure of the feed solution. The concentration polarization is a complex function of several parameters. It diminishes at increased flow velocity and reduced tube diameter.
Figure 3: effect of different pressure on flux and desalination ratio Process parameters:
U=500 cm/sec, D=0.625 cm, d=0.352cm, C2/C1=1.00381,viscosity=0.01cm2/sec n=1Dab=0.00001 dx=0.05cm t=0.09 osmosis pressu~e=4.6bar A=0.0005,8=0.0001, the increasing of C2/C1 is 0.005
The magnitude of concentration polarization has a direct influence on the most important parameters, viz., the flux and the desalination ratio, the higher the concen- tration polarization, the lower the flux and the desalination ratio.
Figure 4: effect concentration polarization on flux and desalination ratio P~ocess parameters: U=500 cmlsec, D=0.625 cm, d=0.352cm C2/C1=1.00381 viscosity=0.01 cm2/sec, n=1D ab=0.00001 dx=0.05cm t=0.09 osmosis pressure=4.6bar A=0.0005 B=0.0001 the inc~easing of C21C1
is 0.005
This is illustrated in Figure 4. The increase in flow velocity brings about a drop in concentration polarization, a reduction of boundary layer thickness, an increase in desalination ratio, an increase in permeate flux, depending on the size of the pres- sure drop, and an increase in pressure drop. The velocity values and the tube length
must not be so high as to bring about a reduction of total permeate flow owing to an excessive pressure drop in the tube, as can be observed in Figure 5.
Figure 5: effect of velocity on flux and desalination ration Process Process parameters:
U=500 cmlsec, D=0.625 cm, d=0.352cm C21C1=1.00381 viscosity=0.01 cm2lsec, n=1D ab=0.00001 dx=0.05cm t=0.09 osmosis pressure=4.6bar A=0.0005 B=0.0001 the increasing of C21C1 is 0.005
Figure 6 shows the effect of top brine temperature on the performance ratio. As the top brine temperature increases the performance ratio also increases, The rate of increase of performance ratio is very small although the amount of produced water increases. This is due the increase in required steam flow rate as result of elevated top brine temperature which means that the steam boiler temperature increases and consequently the required steam mass flow rate.
Figure 6: The relation between top brine temperature and the station Performance ratio (PR)
Figure 7 shows the effect of top brine temperature on the cooling water flow rate. The more the top brine temperature increases the more the cooling water flow rate decreases. This is due to the decrease in the rejected brine flow rate by increas- ing the product water rate with the increase in top brine temperature.
Figure 7: The relation of top brine temperature and the cooling water flow rate.
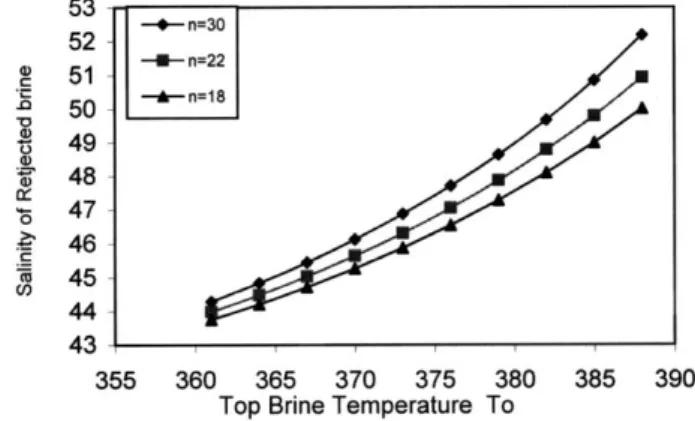
Figure 8 shows the effect of top brine temperature on the salinity of the rejected brine. With the increase in top brine temperature the salinity increases because of the decrease in reject brine flow rate.
Figure 8: The relationship between the top brine temperature and the salinity of rejected brain.
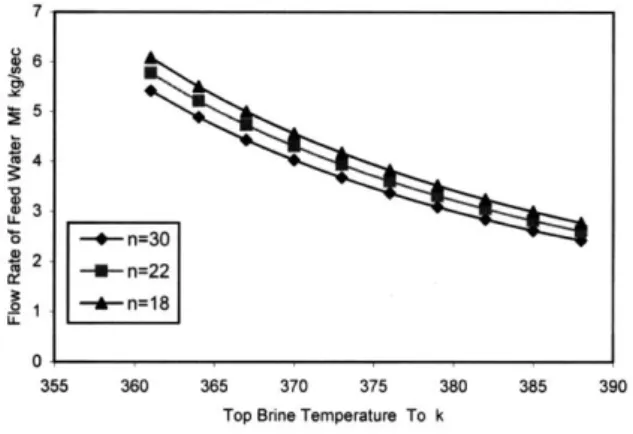
Figure 9 shows that the effects of top brine temperature on the feed water flow rate. The decrease in the feed water flow rate with the increase in top brine tempera- ture is due to the decrease in re-circulated water flow rate with the increase in the top brine temperature. This is due to the effect of the increase in temperature differ-
ence per stage. This increase in temperature difference means more potential flow of heat to the feed water and consequently no need to large quantity of fed water for heat recovery.
Figure 9: The relation between top brine temperature and feed Water flow rate.
Figure (10) shows the effect of the top brine temperature on the rate of the re- jected brine. The above relation shows that the top brine temperature has a signifi- cant effect on the rejected brine flow rate and the more it increases the more the flow rate of rejected brine decreases. But that means the salinity increases due to the increase in the productivity of the station. However we should not go through the procedure of rising the top brine temperature Instead, we should have an optimum temperature for our design requirements.
Figure 10: The relation between the top brine temperature and the flow Rate of the rejected brain
9. Conclusions
The main design parameters for RO plants are pressure, type of membrane, con- centration polarization and flow velocity. The MSF plants respective parameters are top brine temperature, number of stages, seawater temperature etc. The harmful factor for RO process is concentration polarization. It has a critical effect on the life period of membrane. This can be reduced by making the flow through the tube tur- bulent by increasing the flow velocity or by any other economical method to reduce it. The main factor affecting the MSF operation is the top brine temperature. The more it increases the more the performance ratio increases. Top brine temperature can be controlled knowing the available type of energy sources in the station region.
Numbers of stages have a critical effect on the performance of MSF plant. The more it increases the more the performance ratio increases. And also, the more the salinity of the brine increases, This should be within moderate limits for discharging it in the sea. It also has good effect on cooling water flow rate and consequently the outlet temperature of the water to the sea. Thermal distillation processes have a greater thermal impact than membrane processes, in terms of both marine and atmospheric discharges. By contrast membrane processes have a greater impact in terms of salt concentration increase in the discharged water, although salt mass flow rates are the same for both types of process. The quantities and types of chemical discharges are generally at a low level, but ecological and environmental studies are recommended at the planning and site selection stages of a project, to determine any effects on marine life. The distillation plants require an inlet seawater flow around 8 to 10 times the fresh water production, as compared with a ratio of 3 to 1 for RO plant.
RO uses electricity as the principal utility while evaporative processes use steam.
Therefore, the evaporative process will have lower operating costs at places where low cost of steam is available. An RO plant typically occupies less than half the space of an MSF plant. The RO plant is delivered and operated in modules, so no need to shut off the whole plant for emergency or routine maintenance. No need to combine the RO plant with a power plant or to interfere with its operation. In fact it can be operated only during non-peak power demand periods. It has simple start/stop operation. The RO plant consumes less energy, and only in the form of mechanical energy delivered by electric motors driving the pumps of the system.
Pretreatment for evaporative processes is simpler and less critical because the pro- cess is more tolerant to feed water contaminants and has more consistent quality of feed water from the sea. RO requires two stages or a de-mineralizer to obtain high purity water. The evaporative processes are capable of producing high-purity water without any post-treatment. Since evaporative processes operate at higher tempera- tures than RO, they have a higher potential of scaling and corrosion. The scales can be removed by periodic cleaning and corrosion can be minimized by proper material selection. Membranes in an RO system are subjected to compaction and fouling, which can be overcome by periodic cleaning and membrane replacement. The prod- uct water contamination risk is higher with RO since a membrane rupture passes feed water directly to the product water. The replacement of ruptured membranes is therefore essential. The discharges from desalting processes can meet the require-
ments of wastewater and ocean regulations for heavy metals, temperature, chemical additions, and water quality. Brine can be disposed of in a number of ways: includ- ing irrigation or land spreading, surface water bodies, sewer system, deep well injec- tion and Zero discharge. Mitigation methods are available to assist in lessening tem- porary environmental impacts at the point of disposal. According to the vital role of water and consequently the desalination process, there are many factors that control the selection of the type of station. For a developing country, the main factor which control the selection type of desalination plant and the technology of station is its ability of the technical management, operational cost and dependency on itself.
Through our study we suggested that the MSF plant is very suitable for the different of regions of the country. This is mainly because the manufacturing technology is very simple and its installation is easy and all components can supplied from the local market. But RO process depends mainly on the type of membrane, which should be supplied from abroad.
Bibliographies
[1] Desalting Handbook for Planners, Bureau of Reclamation and Office of Saline Water, first edition -May (1972).
[2] Buros, O. K. The desalting "ABC's. For International Desalination Association. 1990.
[3] Work Shop, "Water Re-use Promotion Center, Tokyo, Japan, October 1981, Document No.
5635.
[4] J. W.Oldfield and B. Todd, "Environmental Aspects of Corrosion in MSF and RO Desalina- tion Plants", Desalination 108 (1996) pp. 27-36, Amsterdam.
[5] A. J. Morton, I. K. Callister, and N.M. Wade, "Environmental Impacts of Seawater Distilla- tion and Reverse Osmosis Processes", desalination 108(1996), pp. 1–10, Amster- dam.
[6] T. Hopner and J. Windelberg, "Elements of Environmental Impact Studied on Coastal Desal- ination Plants", Desalination 108 (1996) pp. 11-18, Amsterdam.
[7] M. A. Darwish and N. A1 Najem, "Cogeneration Power-Desalting Plant: New Outlook For Using Reverse Osmosis Desalting System, ADST", Second International Workshop On: "desalination technologies: future trends and Economics", February 7-8,2001, pp. 160-167, Amsterdam.
[8] J. Murkes and H. Bohman, "Mathematical Modeling Of Reverse Osmosis And Ultra Filtra- tion Processes", Desalination, 11 (1972) pp. 269-301, Amsterdam.
[9] H. El-Dessouky, Habib I. Shaban & H. Al-Ramadan, "Steady-state analysis of multistage flash desalination process" , desalination 103 (1995) pp. 271-287.
[10] M. A. DARWISH, "Lecture Notes In Desalination" King Abdulaziz University College of Engineering 5-16 September 1981.
[I1] M. A. Darwish, F.A. Yousef & N.M. AL-Najem, "Energy consuption and costs with a multi- stage flashing (MSF) desalting system", Desalination 109 (1997) pp. 285- 302, Amsterdam.
[12] Narmine H. Aly "Evaluation of water cost from seawater desalination in dual-purpose plants for potable water production and electricity", Fourth International Water Technology Conference IWTC 1999, Alexandria. Egypt.