Atmospheric Chemistry
István Lagzi Róbert Mészáros
Györgyi Gelybó
Ádám Leelőssy
Atmospheric Chemistry
by István Lagzi, Róbert Mészáros, Györgyi Gelybó, and Ádám Leelőssy Copyright © 2013 Eötvös Loránd University
This book is freely available for research and educational purposes. Reproduction in any form is prohibited without written permission of the owner.
Made in the project entitled "E-learning scientific content development in ELTE TTK" with number TÁMOP-4.1.2.A/1-11/1-2011-0073.
Consortium leader: Eötvös Loránd University, Consortium Members: ELTE Faculties of Science Student Foundation, ITStudy Hungary Ltd.
Table of Contents
Preface ... vi
1. The structure and composition of the atmosphere ... 1
1.1. Formation of the Earth atmosphere ... 1
1.2. A short history of the atmospheric chemistry ... 3
1.3. Atmospheric composition ... 4
1.4. Vertical structure of the atmosphere ... 8
1.4.1. Vertical change of composition ... 8
1.4.2. Vertical temperature changes ... 9
1.5. The planetary boundary layer ... 12
2. Emission of air pollutants ... 14
2.1. Source types of air pollutants ... 15
2.2. Natural emission sources ... 16
2.2.1. Terrestrial ecosystems ... 16
2.2.2 Aquatic Ecosystems ... 17
2.2.3 Forest fires ... 17
2.2.4 Volcanic and tectonic activities ... 17
2.2.5 Lightning ... 17
2.3 Anthropogenic emission sources ... 18
2.3.1 Industrial energy production and use ... 18
2.3.2. Transport ... 19
2.3.3 Agriculture ... 19
2.3.4 Waste management ... 20
2.3.5 Biomass burning ... 20
2.3.6. Anthropogenic sources of air pollutants by different sectors ... 20
3. Basics of the reaction kinetics ... 26
3.1. Differential rate law ... 26
3.2. Integrated rate law ... 27
3.3. Three-body reaction ... 28
3.4. Photochemical reaction (Photolysis) ... 28
3.5. Radicals in the atmosphere ... 29
3.6. Arrhenius Equation ... 30
3.7. Half-life ... 31
3.8. Reaction mechanism ... 31
3.9. The quasi steady-state approximation (QSSA) ... 32
3.10. Application of a reaction mechanism ... 33
4. Reactions of air pollutants in the atmosphere ... 41
4.1 General notes ... 41
4.2 Reactions of atmospheric oxygen ... 41
4.3 General reactions in the troposphere and stratosphere ... 44
5. Biogeochemical cycle of carbon ... 46
5.1. The natural carbon cycle ... 47
5.1.1. Terrestrial processes ... 48
5.1.2. Oceanic processes ... 49
5.1.3 Geological processes ... 52
5.2 Methane ... 53
5.2.1 Sources and sinks of atmospheric methane ... 53
5.3 Human disruption of carbon cycle ... 54
5.4 Carbon cycle research in Hungary ... 58
6. Nitrogen compounds ... 60
6.1. Nitrogen fixation ... 61
7. Sulphur compounds ... 67
7.1. Sulphur oxides (SOx) ... 70
7.1.1. Reaction sulphur dioxide in the atmosphere ... 70
7.2. Hydrogen sulphide (H2S) ... 71
7.3. Carbonyl sulphide (COS) ... 72
7.4 Carbon disulfide (CS2) ... 72
8. Ozone ... 73
8.1. Stratospheric ozone ... 73
8.1.1. A short history ... 73
8.1.2. Natural balance of stratospheric ozone ... 73
8.1.3. Circulation patterns in the stratosphere ... 77
8.1.4. Gas-phase chemistry in the stratosphere ... 77
8.1.5. Polar ozone chemistry ... 79
8.2 Tropospheric ozone ... 81
8.2.1. Global tropospheric ozone budget ... 82
8.2.2. Ozone production in the troposphere ... 83
8.2.3. Sinks of the tropospheric ozone ... 84
8.2.4. Spatial and temporal variability of ozone in the near surface layer ... 84
9. Aerosol particles ... 89
9.1. Sources and sinks of atmospheric aerosols ... 89
9.1.1. Sources of aerosol particles ... 89
9.1.2. Sink processes ... 91
9.2 Physical and chemical characteristics of aerosols ... 92
9.2.1. Concentrations: ... 93
9.2.2. Size distribution: ... 93
9.2.3. Chemical composition ... 96
9.2.4. Water solubility ... 98
9.2.5. Atmospheric lifetime ... 98
9.3. Effects of atmospheric aerosols ... 99
9.3.1. Direct effects: direct radiative forcing due the scattering radiation. ... 100
9.3.2. Indirect effects: indirect radiative forcing through cloud formation effects ... 100
10. Dispersion of air pollutants ... 102
10.1. Introduction ... 102
10.2. Overview of air dispersion modelling ... 102
10.2.1. The transport equation ... 102
10.2.2. Turbulence parameterization ... 104
10.2.3. Chemical reactions and radioactive decay ... 109
10.3. Gaussian dispersion models ... 110
10.3.1. Theory and limitations of Gaussian models ... 110
10.3.2. History of development ... 111
10.3.3. Advanced Gaussian models ... 112
10.4. Lagrangian models ... 112
10.4.1. Calculation of trajectories ... 113
10.4.2. Puff models ... 113
10.4.3. Trajectory models ... 115
10.5. Eulerian models ... 119
10.5.1. Solving atmospheric transport equations ... 119
10.5.2. Operator splitting ... 120
10.6. Computational Fluid Dynamics models ... 122
11. Air pollution modelling ... 127
11.1. Adaptive gridding ... 127
11.1.1. Introduction ... 127
11.1.2. Adaptive gridding for simulating photochemical air pollution ... 128
11.1.3. Adaptive gridding for simulating accidental release ... 135
11.2. Parallelization ... 144
11.2.1. Introduction ... 144
11.2.2. Supercomputers, clusters, and Grids ... 144 Atmospheric Chemistry
12. Deposition of air pollutants ... 153
12.1. Dry deposition of trace gases ... 154
12.1.1. Field measurements ... 154
12.1.2. Deposition/exchange models ... 155
12.1.3. Some results ... 157
12.2. Dry deposition of aerosol particles ... 161
12.2.1. Field measurements ... 161
12.2.2. Modelling the dry deposition of particles ... 161
12.3. Modelling of wet deposition ... 162
12.3.1. Wet deposition in Europe ... 163
13. Environmental effects of air pollution ... 165
13.1. The role of each pollutant ... 165
13.1.1. Carbon monoxide (CO) ... 167
13.1.2. Sulphur dioxide (SO2) ... 167
13.1.3. Nitrogen dioxide (NO2) ... 168
13.1.4. Ozone (O3) ... 169
13.1.5. Particulate matter ... 170
13.2. Some effects on the environment ... 171
13.2.1. Smog ... 171
13.2.2. Acid rain ... 171
13.3.3. Crop and forest damage by ozone ... 172
14. The role of air pollution in the global climate change ... 175
14.1. Effects of atmospheric composition on the radiation budget ... 175
14.2. Anthropogenic perturbation of the greenhouse gases ... 176
14.3. Radiative forcing of atmospheric components ... 178
14.4. Future scenarios ... 180
14.4.1. SRES scenarios ... 180
14.4.2. Representative Concentration Pathways (RCPs) ... 183
15. Monitoring of Air Pollution ... 187
15.1. Measurement locations ... 187
15.1.1. Classification of measurement sites ... 187
15.1.2. Measurement network in Europe and Hungary ... 189
15.2. Measurement techniques ... 191
15.2.1. Sampling methods ... 191
15.2.2. Measurement of gas concentrations ... 192
15.2.3. Measurement of aerosol concentrations ... 194
15.2.4. Remote sensing ... 195
15.2.5. Rainwater analysis ... 198
15.3. Conclusion ... 198
16. Questions: ... 200 Atmospheric Chemistry
Preface
Atmospheric chemistry is a multidisciplinary research field with respect to emissions, interactions and physical and chemical transformation of chemical compounds in the atmosphere. It also investigates the key physical processes occurring in the atmosphere. This eBook provides a comprehensive review of this topic showing recent advances in this field e.g., parallelization of mathematical models with CUDA, effect of air pollutants on global climate change. The authors of this book hope that material presented will be useful and essential for bachelor and master students as well as graduate students, and they can use it as a basic source for their studies.
Chapter 1. The structure and composition of the atmosphere
The total mass of the atmosphere is approximately 5.3·1018kg, against the 1.4·1021kg mass of the hydrosphere (oceans, sees, lakes, rivers, groundwater, snow and ice) and 5.98·1024kg mass of the Earth. The upper border of the atmosphere is not a well-defined altitude. The atmospheric material steadily decreases with height, until it gradually reaches interplanetary space. The atmosphere is an envelope of gases and particles surrounding the Earth.
This amount of materials remains around our planet during the rotation around its axis and orbit around the Sun.
The relatively dense area of the Earth's atmosphere is an extremely thin layer compared to the whole atmosphere.
Half of the atmosphere’s mass can be found below 5.5 km and around 99% of the air is located in the lower 30 km’s layer. The whole atmosphere actually the same as the range of the magnetosphere (Figure 1.1), which is the result of the interaction between Earth’s natural magnetic field and solar wind1.
Figure 1.1: The magnetosphere around the Earth is formed by the interaction between Earth’s natural magnetic field and solar wind
1.1. Formation of the Earth atmosphere
The Earth formed about 4.5 billion years ago, as hot molten rock. It’s first atmosphere probably contained hydrogen and helium and some simple compounds of hydrogen, like ammonia (NH3) or methane (CH4). This first atmosphere of the Earth could similar to the atmosphere of Jupiter and Saturn today. Because our planet didn’t have a magnetic field to protect it yet, the intense solar wind from the Sun blew this early atmosphere away. In essence, the Earth was lost its early atmosphere. Meanwhile, as the Earth cooled enough, a solid crust with several active volcanoes was developed about 4.4 billion years ago. By the strong volcanic activity, gases from the hot interior of our planet reached the surface. These gases – basically water vapour, carbon dioxide and ammonia – created the sec- ondary atmosphere of the Earth. The atmospheres of Mars and Venus today – which contain mainly carbon-dioxide – are similar to this early atmosphere of the Earth.
Over hundred millions of years the atmosphere cooled down gradually, therefore most of water vapour condensed and formed the clouds. Precipitation from these clouds created the oceans. Simultaneously, most of atmospheric
Figure 1.2: Probable composition of the atmosphere during the history of the Earth
Based on some theory, the oxygen was first produced in the atmosphere by photochemical dissociation of water vapour by intense ultraviolet radiation:
(R1.1) 2H2O + uv radiation → 2H2+ O2.
However this amount was negligible and free oxygen was probably produced as a by-product of photosynthesis2 by tiny organisms known as cyanobacteria (or blue-green algae) from around 2.500 millions years ago. Photosyn- thesis uses carbon dioxide, water, and light energy releasing organic compounds (carbohydrates) and oxygen:
(R1.2) CO2+ H2O + sunlight → organic compounds + O2
Initially, the small amount of atmospheric oxygen consumed for oxidation of rocks at the surface (weathering process). Complete oxidation of the surface rocks, oxygen levels in the atmosphere began to grow more intensively.
As the atmospheric oxygen reached 1–2% of present oxygen level, ozone (O3) could form to shield Earth’s surface from intense ultraviolet radiation:
(R1.3) 2O2+ uv radiation → O3+ O
and
(R1.4) O + O2= O3.
At this time, primitive plants formed which facilitated the photosynthesis process. Land plants developed a few million (based on new studies around 700 million) years ago and would have removed carbon dioxide (from around 1–5% down to 0.04%) at the same time steadily increased the amount of oxygen in the atmosphere. Oxygen levels fluctuated in the last few million years during various time periods regulated by climate, volcanism and plate tec- tonics (Holland, 2006). Finally, the atmospheric oxygen level stabilized at around 21% (Figure 1.3).
2Photosynthesis: during this process, plants and other organisms convert light energy from the Sun to chemical energy. Photosynthesis requires
The structure and composition of the atmosphere
Figure 1.3: The probable variation of oxygen level in the atmosphere during the history of the Earth
1.2. A short history of the atmospheric chem- istry
Greek philosopher, Anaximenes (585–528 BC) declared that air was the primary substance and the source of all other things. Later, Empedocles (ca. 490–430 BC) described the air as one of the four elements (see e.g. May, 2010). This conception was accepted until 18thcentury. At this time, a question was arisen: whether air is a com- pound, or a mixture of individual gases. First scientific studies about atmospheric composition were published in the 1700s. Chemical compounds in the atmosphere were discovered one after the other (Table 1.1) to confirm that air is a mixture of gases (see e.g. Anfossi and Sandroni, 1993).
Table 1.1: Important discoveries of atmospheric elements
Explorer(s) Compound
Date
Joseph Black carbon dioxide
1750s
Henry Cavendish hydrogen
1766
Daniel Rutherford nitrogen
1772
Joseph Priestley and oxygen
1774
Carl Wilhelm Scheele 1772 (published in 1777)
Christian Friedrich Schönbein ozone
1840
Lord Rayleigh and William Ramsay argon
1894
Table 1.2: Some important milestones of atmospheric chemistry in the 20thcentury Discovery
Explorer(s) Date
developed a spectrophotometer and started the regular measurements of total-column ozone Gordon Dobson
1924
described theory that explains existence of ozone
„layer”
Sydney Chapman 1930
The structure and composition of the atmosphere
the Nobel Prize in Chemistry was awarded jointly
"for their work in atmospheric chemistry, particu- Paul Crutzen,
Mario Molina and 1995
larly concerning the formation and decomposition of ozone".
Frank Sherwood Rowland
After the clarification of fundamental composition of the atmosphere till the late 19thcentury, the attention was focused on the atmospheric trace gases with very small concentrations. In the 20thcentury new research directions were appeared, namely the analysis of temporal variation of trace gas concentrations and investigations of chem- ical reactions in the atmosphere (Table 1.2).
Today, major challenges of atmospheric chemistry are to describe the relationships and feedbacks between chemistry and climate, as well as the exchange processes between the surface and the atmosphere.
1.3. Atmospheric composition
Earth’s atmosphere contains mainly several different gases and additionally aerosol particles. Atmospheric gases are generally classified by their amount and residence time. The residence time (or removal time or lifetime) is an average amount of time that a particle or substance spends in a particular system (as the atmosphere). The residence time can be defined as the amount of the compound in the atmosphere divided by the rate at which this compound removed from the atmosphere. Based on the quantity, major components and trace gases, while according to res- idence time, constant and variable (and sometimes highly variable) gases can be distinguished (Table 1.3).
The amount of atmospheric gases can be expressed by different measures. Generally used terms are the concentration (kg m–3), the volume ratio (m3gas per m3air) and mole fraction (mol mol–1). For trace gases, this mixing ratio are commonly given in units of parts per million volume (ppmv or simply ppm), parts per billion volume (ppbv or ppb), or parts per trillion volume (pptv or ppt); 1 ppmv = 10–6mol mol–1, 1 ppbv = 10–9mol mol–1and 1 pptv = 10–12mol mol–1.
The abundances of constant gases has remained the same over geological timescales, while residence time generally means years in case of variable gases and days in case of highly variable gases (Table 1.4).
The main constituents of the dry atmosphere are nitrogen (78.084% by volume), oxygen (20.946% by volume) and argon (0.934% by volume), but much lower concentrations other noble gases can also be found (Table 1.4).
Concentrations of these gases do not vary substantially in time and space (in the lower 80 km layer of the atmosphere) and therefore they are called permanent gases.
Table 1.3: Classification of atmospheric gases
Trace gases Main components
Amount Residence time
other noble gases nitrogen, oxygen and argon
Constant gases
(major components of the atmosphere)
other long-lived tracers carbon dioxide
Variable gases
other short-lived tracers water vapour
Highly variable gases
Table 1.4: Composition of the Earth’s atmosphere
The structure and composition of the atmosphere
* Concentration of water vapour is not included in dry atmosphere; (1) evaporation and transpiration; (2) oxidation of methane and non-methane hydrocarbons
Nitrogen (N2) is a relatively inert gas3and fundamental to all living systems. Through the nitrogen cycle nitrogen is removed from the atmosphere and becomes part of living organisms. This process is realized by nitrogen fixation4 by soil bacteria, and by way of lighting through precipitation. Nitrogen returns to the atmosphere mainly by biomass combustion and denitrification5.
As nitrogen, oxygen (O2) has also very important relations with life. Oxygen exchange between the atmosphere and biosphere is realized by photosynthesis and respiration6.
Argon (Ar) in the atmosphere is the third most abundant gas. Among noble gases, argon was first detected in the atmosphere in 1894 by Lord Rayleigh and William Ramsay. Almost 100% of atmospheric argon is the radiogenic
40Ar isotope derived from decay in40K (potassium) in the Earth's crust.
Water vapour (H2O) is a significant component of the atmosphere. Its concentration varies over a wide range both spatially and temporally. Most of water vapour concentrated in the lower atmosphere (about 90% of total atmo- spheric water vapour is found in the lower 5 km atmospheric layer, and more than 99% of it can be found in the troposphere7). The capacity of air to hold water vapour (called saturation level) is a function only of the air temper-
3Inert gas: Unreactive gas, which does not react with other chemicals to form new compounds under a set of given conditions. Inert gases are
The structure and composition of the atmosphere
ature. The higher the temperature the greater amount of water vapour can be held without condensation (Figure 1.4).
Figure 1.4: Dependence of saturated water vapour pressure from air temperature. The higher the temperature, the greater water vapour can be held by the air.
The highest atmospheric moisture content is observable over equatorial ocean area and tropical rain forests, while the lowest water vapour concentrations can be measured over cold, polar regions, and subtropical deserts. Atmo- spheric water vapour has several significant direct and indirect effects on both weather and climate. It plays important roles in the radiation and the energy budgets of the atmosphere, and also in the formations of clouds and precipit- ations. About 70% of total absorption of the incoming shortwave solar radiation, particularly in the infrared region, and about 60% of total absorption of long-wave radiation by the Earth are realized by water vapour (Figure 1.5) thereby it is the most significant greenhouse gas8. Water vapour also influences heat energy transfer on the surface- atmosphere system through the latent heat flux. The latent heat flux is a component of surface energy budget. It plays an important role in the heat transfer from Earth’s surface into the atmosphere. During this process heat from evaporation and transpiration of water at the surface is transferred to the troposphere by water vapour and it is re- leased there by condensation. Latent heat of evaporation of water at the surface is released to the atmosphere when condensation occurs. Due to the condensation, cloud, fog and precipitation can be produced.
8Greenhouse gas (GHG): gases in the atmosphere, which cause greenhouse effect. Most abundant greenhouse gases are water vapour (H2O),
The structure and composition of the atmosphere
Figure 1.5: Absorption of solar and terrestrial radiation by all atmospheric components and by water vapour. Water vapour has significant absorption bands both in shortwave (incoming solar radiation) and longwave (outgoing
terrestrial radiation) spectra.
Carbon dioxide (CO2) is an important greenhouse gas as it has a strong absorption capacity in the infrared and near-infrared bands. It has a natural exchange between the atmosphere and biosphere through the photosynthesis and respiration. A part of atmospheric CO2is dissolved by the seas and oceans. Atmospheric concentration of carbon-dioxide has increased steadily worldwide by over 35% since the beginning of 1800’s. Before the Industrial Era, atmospheric carbon dioxide concentration was 280 ± 10 ppm for several thousand years. The present atmo- spheric CO2concentration has not been exceeded during the past 420,000 years, and likely not during the past 20 million years. The rate of increase over the past century is unprecedented, at least during the past 20,000 years (IPCC, 2001). The increase has speeded up in the last few decades. In the beginning of the measurements of background concentration9of CO2on Mauna Loa observatory in 1958, CO2level was less than 320 ppm, while in 2010 it has reached and exceeds 390 ppm (Figure 1.6). This rapid growth is primarily due to growing anthropo- genic activities, like burning of fossil fuels, deforestation, and other forms of land-use change. This man-made increase of atmospheric concentration of carbon-dioxide has definitely contributed to global warming over the last decades with the increase of greenhouse effect. Carbon-dioxide concentration shows characteristic seasonal cycle, which is related mainly to Northern Hemisphere growing season.
Figure 1.6: Monthly mean background concentration of atmospheric carbon dioxide (CO2) from 1958 to 2012, measured at the Mauna Loa Observatory. Source of data: http://www.esrl.noaa.gov/gmd/ccgg/trends/
The volume of other gases compared to the main components, are very low, and therefore they are called trace gases. Despite their low concentrations, these tracers (e.g. ozone both in troposphere and stratosphere, carbon, ni- trogen, sulphur compounds etc.) can be of critical importance for several environmental issues (for example:
greenhouse effect10, atmospheric pollution etc.).
Next to the different gases, Earth’s atmosphere contains a huge number of aerosol particles. Aerosols are generally defined as suspension of solid particles or liquid droplets in a gas. Their size are very small, the particle diameters in the range of 10–9–10–4m. Aerosol particles originate in large part from different natural sources, and in lesser extent, from anthropogenic sources. Main emission sources of primary particles – which are emitted directly to
The structure and composition of the atmosphere
the atmosphere – are soil and mineral dusts, sea salts, volcanic eruptions, biomass burning, biological materials (e.g. pollen, plant fragments, microorganisms), incomplete combustion of fossil fuels, industrial particulates and traffic. Secondary particles are formed when gas-to-particle conversion occurs by nucleation and condensation of gaseous precursors.
The concentration, size distribution and composition of atmospheric aerosol particles vary significantly with time and space. In the lower troposphere, the aerosol mass concentration varies in a range of 1–100 µg m–3, and particle number is typically varies from 102to 105cm–3(Pöschl, U., 2005). Most particles can be found over deserts and urban area, while polar atmosphere and alpine air contains fewer aerosols. Generally, aerosol concentration decreases with altitude.
Atmospheric aerosols have significant effects on different atmospheric processes, climate and human health.
Aerosol particles modify the radiation balance of the Earth through scattering and absorbing incoming solar and terrestrial radiation. They are essential in the formation of clouds and precipitations, as they provide condensation nuclei. They have influence on oxidation processes, and affect the cycles of nitrogen, sulphur and atmospheric oxidants (see more information about aerosol particles in Chapter 9).
1.4. Vertical structure of the atmosphere
1.4.1. Vertical change of composition
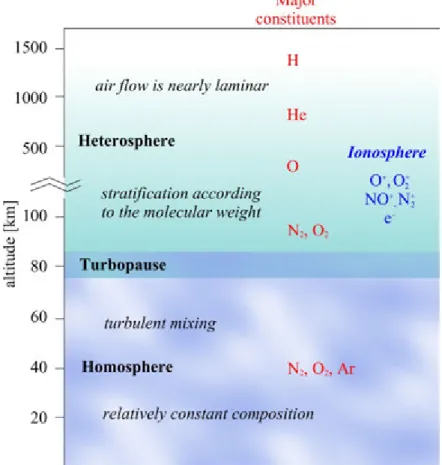
According to the homogeneity of atmospheric composition, two layers can be defined in the atmosphere. The lower layer, up to an altitude of about 80 km above sea level is the homosphere, where due to the continuous turbulent mixing the composition of the atmosphere is relatively constant for chemical species which have long mean residence times. This region is closed by a thin transition layer, called turbopause. Above the turbopause, in the heterosphere, the molecular diffusion dominates and the chemical composition of the atmosphere becomes stratified and varies according to the molecular mass of chemical species (Figure 1.7). The lower heterosphere are dominated by nitrogen and oxygen molecules and the lighter gases being concentrated in the higher layers. Up to 1,000 km the oxygen atoms and above this height the helium and hydrogen are the dominant species.
In the upper part of the atmosphere – from about 60 km to 2000 km above the Earth's surface – ionic species or free radicals (O+, O2+, NO+, N2+, free electrons) can also be found, and high number of ionized particles affect the propagation of radio waves. This region of the atmosphere is called ionosphere. There are three important layers in the lower part of the ionosphere (at altitudes between about 60 km and 600 km), where the absorption of solar extreme ultraviolet radiation and x-rays ionize the neutral atmosphere. These are the D (60–90 km), E (90–150 km) and F regions (150–500 km) with F1 and F2 sub-layers. The ion density of each layer depends on the solar activity and time of day (Figure 1.8).
The structure and composition of the atmosphere
Figure 1.7: Vertical structure of the atmosphere according to chemical composition
Figure 1.8: The layers of the ionosphere The structure and composition of the atmosphere
The lowest major atmospheric layer is thetroposphere, extending from the Earth's surface to the tropopause (Figure 1.9). The thickness of the troposphere varies with latitude: it is about 7 km in polar region, generally 11–12 km in the mid-latitudes and even 18 km over the Equator. The height of the tropopause is also depends on season, weather condition and time of day.
Figure 1.9: The vertical structure of the atmosphere according to the vertical temperature changes Troposphere contains about 80% of total mass of the atmosphere, nearly all water vapour and dust particles can be found here. Almost all weather phenomena and cloud formation take place in this layer. The troposphere is heated from below by the Earth’s surface. Incoming solar radiation first warms the surface, which radiates heat into the atmosphere. The warmer air in the near surface layer generates turbulent vertical motions, which transfer water vapour and other tracers to higher altitudes.
Temperature decreases with increasing height in the troposphere to away from the warming surface. The changing rate of temperature with height is called “lapse rate”11. Tropospheric air temperature is generally proportional with distance from surface and lapse rate is fairly uniform, it is about 6,5 °C / 1000 m, but this rate is affected by water vapour content. Temperature is generally lower than –50 °C at the top of the troposphere (in mid-latitude, temper- ature is –56.5 °C at 11 km based on ICAO standard atmosphere12).
However, in the lower troposphere, the atmospheric stratification can differ from normal, and temperature can in- crease with height in the function of time of day and weather condition. This situation is called inversion13, which generally occurs at night. When temperature remains the same with height, the stratification is isothermal. The at- mospheric stratification and thereby the stability conditions play important role in dispersion of tracers.
11Lapse rate: a rate of change in temperature observed while moving upward through the Earth’s atmosphere. The lapse rate is positive when temperature increasing with altitude, zero in case of isothermal stratification and negative when temperature decreasing with height.
12ICAO standard atmosphere: a hypothetical model atmosphere created by ICAO (International Civil Aviation Organization) to describe the vertical distribution of atmospheric temperature, pressure, and density.
The structure and composition of the atmosphere
The troposphere can be divided into two main parts. The lower part is the planetary boundary layer (PBL) or atmo- spheric boundary layer, extending upward from the surface to a height that ranges from about 100 to 3000 m in the function of season, weather condition and time of day. Above this layer, the free troposphere can be found.
Stratosphere:
At the tropopause, the decrease of temperature halts and to about 50 km above ground level, an inversion layer can be found, when temperature increases with height. This layer is the stratosphere. Temperature increase in the stratosphere (Figure 1.9) is due to the relatively high concentration of ozone. Ozone strongly absorbs uv radiation14 from the Sun in the bands between 210 and 290 nm (more information about ozone see Chapter 8). This absorption by the ozone is the primary cause of temperature increase in the stratosphere. Without ozone layer, a further decrease of temperature with increasing height would be observable in the stratosphere (Figure 1.10).
Stratosphere holds about 19% of total mass of the atmosphere, and it contains only a very small amount of water vapour. Due to the vertical stratification, stratosphere is a stable layer and the mixing is weak. Particles that reach the stratosphere from the troposphere (e.g. from a large volcanic eruption) can stay a long time (many years) in the stratosphere without removing from it. Polar stratospheric clouds15(PSCs) can be observed in winter polar stratosphere between 15 and 25 km height. They form at only very low temperature (below −78 °C). Different types of PSCs contain water, and different particles (e.g. nitric acids) or only water ice (see more information about polar stratospheric clouds in Chapter 8).
The stratosphere is bounded above by the stratopause at about 50 km height, where the average temperature is generally just below 0 °C.
Figure 1.10: Real and hypothetical vertical profile of temperature with and without ozone in the stratosphere, re- spectively.
Mesosphere:
Over the stratopause, the next layer is the mesosphere from about 50 km to 85–100 km above the Earth’s surface (Figure 1.9). Air density is tow low to absorb solar radiation, thus the mesosphere is warmed from below by the stratosphere and hence the temperature decreases with increasing height. However the atmosphere is still thick enough to slow down meteoroids enter to the atmosphere. The upper boundary of mesosphere is the mesopause, which is the coldest region of Earth’s atmosphere, where the temperature is around –100 °C.
The structure and composition of the atmosphere
Within the mesosphere, noctilucent clouds16can be appeared, when Sun is below the horizon and the lower layers of the atmosphere are in the Earth's shadow. These thin clouds are composed from tiny ice crystals, but their emergences, properties and relationships with global climate change are still not fully understood.
Upper atmospheric electrical discharges (like red sprites or blue jets) over tropospheric thunderstorms also occur in the mesosphere.
However, in the absence of frequent direct measurements (only by occasionally sounding rockets), mesosphere is a less known layer of the atmosphere.
Thermosphere:
In the thermosphere, over the mesopause, temperature rise continually with increasing height due to the direct ab- sorption of high energy solar radiation by atmospheric gases. Temperatures are highly dependent on solar activity, and can rise well beyond to 1000 °C. However, this value is not comparable to those of the lower part of the atmo- sphere, as the air density is extremely low in this layer.
Considering the composition, this layer is a part of the heterosphere, where the atmospheric compounds stratified by their molecular mass. Major layers of the ionosphere (see above) are situated in the thermosphere. Auroras, form by collisions of energetic charged particles with atoms, occur also in the thermosphere.
Over about 500–1000 km above the Earth’s surface (depending on solar activity), the collisions between atmospheric constituent become negligible. This layer is often called as exosphere, which gradually merge into interplanetary space.
1.5. The planetary boundary layer
The lowest level of the atmosphere – the bottom layer of the troposphere – called planetary boundary layer (PBL) is directly and strongly influenced by the underlying surface (Stull, 1988). Within the PBL the convective air motions generate intense turbulent mixing. The upper boundary of PBL is a statically stable layer (temperature inversion).
Interactions between the atmosphere and the surface take place in the PBL. Timescale of atmospheric response to surface forcing is an hour or less. Atmospheric variables (wind speed, temperature, water vapour content etc.) show great variability and fluctuation and the vertical mixing is strong.
The structure of PBL varies with season, weather condition and time of day. The depth of the PBL ranges from tens of meters in case of strongly stable stratification, to a few thousand meters in very unstable condition; it is lower at night and winter and higher in day-time and summer.
16Noctilucent cloud: thin cloud in the mesosphere which are composed of tiny crystals of water ice. They can be observed at latitudes between
The structure and composition of the atmosphere
Figure 1.11: The structure of the planetary boundary layer
Daly variation of PBL shows a typical pattern during pleasant weather condition (Fig 1.11.) The lowest (about 10%) part of PBL is called surface layer. The thickness of this layer is typically 10–30 m at night, and 50–100 m in day-time. Exchange processes between the atmosphere and the surface (vegetation) are realized here by the turbulent fluxes17of heat, momentum, water and air pollutants. After sunrise, a convective mixed layer growing rapidly due to the intensive turbulence. This layer is capped by a stable entrainment zone. Near sunset, the mixed layer collapses and in its place a nocturnal boundary layer is formed. The bottom part of this layer is stabilized by the nigh time radiative cooling of the surface. Above this stable zone a residual layer can be found.
Planetary boundary layer has great importance in dispersion, dilution and deposition of air pollutants.
References
Anfossi D. and Sandroni S.. 1993.Surface Ozone at Mid Latitudes in the Past Century In: Il Nuovo Cimento. No.
17. Vo 2. 199-207.
Holland H.D.. 2006.The oxygenation of the atmosphere and oceans. Phil. Trans. R. Soc. B.. Vo. 361. 903-915.
IPCC, 2001: Climate Change 2001: The Scientific Basis. Contribution of Working Group I to the Third Assessment Report of the Intergovernmental Panel on Climate Change. Houghton J.T., Ding Y., Griggs D.J., Noguer M., van der Linden P.J., Dai X., Maskell K., and Johnson C.A.. (eds.). Cambridge University Press, Cambridge, United Kingdom and New York, NY, USA. 881 pp. ISBN 0521 80767 0.
May L.. 2010.Atomism before Dalton. In: Atoms in chemistry: from Dalton's predecessors to complex atoms and beyond. Book Series: ACS Symposium Series. Vo. 1044. 21-33.
Pöschl U.. 2005.Atmospheric Aerosols: Composition, Transformation, Climate and Health Effects In: Angewandte Chemie International Edition. Vo. 44. 7520-7540.
Stull R.B.. 1988.An Introduction to Boundary Layer Meteorology (Atmospheric Sciences Library). Kluwer Aca- The structure and composition of the atmosphere
Chapter 2. Emission of air pollutants
Earth’s atmosphere contains various gases and aerosol particles (see Chapter 1). Detailed description about the cycles of some important components can be found in other chapters (carbon compound: Chapter 5, nitrogen compounds: Chapter 6, sulphur compounds: Chapter 7, ozone: chapter 8, aerosol particles: Chapter 9). The atmo- spheric transport processes of air pollutants (Chapter 10), as well as chemical reactions (Chapter 4) and deposition processes (Chapter 12) are also described in detail hereinafter. This chapter present the main source types of air pollutants and their key features.
During air pollution, different gases, particulates or biological materials get to the atmosphere from various natural and anthropogenic sources and modify its natural composition. Emissions influenced by weather conditions, a number of physical and chemical properties and, in case of anthropogenic sources also by technological parameters.
The emitted amounts vary with respect to the location and time. Pollutants emitted to the atmosphere can be transported from emission sources to even a long distance (transmission) in the function of their properties and weather conditions. In the atmosphere, complex chemical reaction processes can be realized which can produce secondary air pollutants. After these processes, air pollutants can be removed from the atmosphere by chemical reactions, dry or wet deposition (Figure 2.1).
Figure 2.1: A schematic picture about life cycle of air pollutants
Atmospheric air pollutants have several effects on the environment in the atmosphere and after they remove into the different surfaces. The chemical composition of the atmosphere can influence both the weather condition and the climate (e.g. cloud formation, visibility, radiation budget). Various air pollutants emitted into the atmosphere by both natural and human activities are the cause of many current and potential environmental problems, such as acidification, air quality degradation (Figure 2.2), global warming/climate change, stratospheric ozone depletion, harmful effects on vegetation, soils, ground water, aquatic ecosystems, human health and also on built environment (further information about the effects of air pollutants can be seen in Chapter 13 and Chapter 14).
Figure 2.2: Severe air pollution in an industrial area
2.1. Source types of air pollutants
There are many different types of sources of atmospheric emissions, for example industry, energy supply (power plants, refineries, incinerators, factories, fossil fuel extraction and production sites, etc.) transport, animals and humans, agricultural activities, natural and managed vegetations, soil etc (EEA Technical report, 2009).
Due to the high variability and complexity of emission sources, it is not possible to measure emissions from all the different source types. In practice, atmospheric emissions are generally estimate based on measurements made at selected or representative samples of the (main) sources and source types. These estimated emissions are collected into emission inventories. Emissions inventories may contain three main types of sources, namely point, area and line sources. However, in some cases the emission inventories refer to a specific area (e.g. to a country or a region).
Three main types of emission sources are the following:
Point source: a single, fixed point, from were air pollutants can be emitted into the atmosphere continuously or instantaneously (for example during an accidental release). Typical example for point source is a smokestack.
Area source: emission of air pollutants from a specific area (e.g. from a city, or from a forest fire). In emission inventories, area sources can refer to an administrative area, such as a country, or region, or for a regular grid, (e.g.
50 km × 50 km grid in EMEP emission inventories: http://www.ceip.at/ceip/, or other derived grid: see Figure 2.3).
Line source: generally refers to emissions from transport (vehicle emissions from road transport, railways, shipping or aviation) along a line of the road, railway-track, sea-lane etc.
The primary sources of atmospheric pollutants could be classified as natural or anthropogenic sources. During natural processes the atmosphere interacts continuously with other spheres (e.g. biosphere, lithosphere, hydrosphere), and these spheres can be both sources and sinks of atmospheric components. This quasi steady state is disrupted by human activities. Anthropogenic emissions are mainly related to energy and food supply of world population.
Emission of air pollutants
Figure 2.3.: An example of emission inventory: Derived sulphur dioxide emission field on a regular grid over Central Europe used in a dispersion model simulation. In some cases, emission data has large uncertainties. Source
of data: http://www.ceip.at/ceip/
2.2. Natural emission sources
Natural emission sources are not influenced by human activities. A variety of air pollutants is generated during a range of processes taking place in terrestrial and aquatic ecosystems or in Earth’s crust.
2.2.1. Terrestrial ecosystems
Various carbon and nitrogen species are emitted to the atmosphere during microbiological and plant physiological processes. Natural sources of carbon compounds, such as carbon dioxide (CO2)and methane (CH4) can be aerobic and anaerobic respiration. Nitrogen species such as nitrogen (N2), nitrous oxide (N2O) and nitric oxide (NO) are produced by biological oxidations and reductions of inorganic nitrogen in soils and waters. The most important factor controlling the rate of the nitrogen emission is the soil temperature.
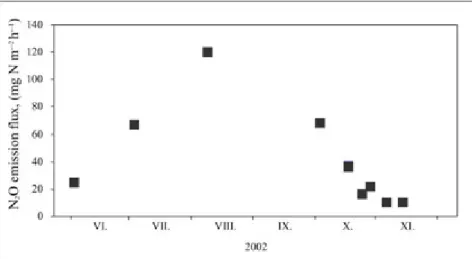
The soil fluxes of N2O in a Norway spruce forest in Mátra Mountain were determined by small static chambers.
Accumulation of nitrous oxide was measured by a gas chromatography-mass spectrometry system. N2O emission fluxes were calculated from the accumulation of nitrous oxide gas in the chamber (Figure 2.4).
Due to metabolic processes in forest trees, grasslands or scrublands several types of hydrocarbons are also emitted to the atmosphere.
Emission of air pollutants
Figure 2.4: N2O emission flux from forest soil measured by static chamber in 2002, in Mátra Mountain.
2.2.2 Aquatic Ecosystems
Several physical, chemical and biological processes occur at surface of wetlands and oceans, which influence the global cycles on a number of species, e.g. carbon, nitrogen, sulphur and trace metals. The most important emission process in wetlands and anaerobic waterlogged soils is the bacterial production of methane. Oceans play an important role in the global biochemical sulphur cycle. Dimethyl sulphide (DMS) is produced during biological activity of phytoplankton then enters the atmosphere by the exchange between see and the atmosphere. Dimethyl sulphide is the major precursor of sulphate particles ( ). Large amount of water droplets and sea salts are emitted into the maritime atmosphere. After the evaporation of water aerosol particles, such us sodium chloride (NaCl), magnesium sulphate (MgSO4) are formed. Various halogenated organic compounds are also emitted to the atmosphere from the oceans. Among them, methyl chloride (CH3Cl) is the major natural source of atmospheric chlorine.
2.2.3 Forest fires
Almost all forest fires are human induced. Naturally occurring biomass burnings are usually the consequence of lightning. The major products of biomass burning are carbon dioxide (CO2) and water vapour. However, a large number of particulates and trace gases are produced, including the products of incomplete combustion of CO, NMVOCs, nitrogen and sulphur species.
2.2.4 Volcanic and tectonic activities
Volcanoes release significant amount of gases and ash particles into the atmosphere. Volcanic emissions occur both during occasionally eruption and long term non-eruptive activities. Most prevailing volcanic gas is water vapour, which can reach 50–90% of total volcanic emission. However, this amount of water vapour is negligible in com- parison to its atmospheric concentration. Other important gases emitted from volcanic activities are carbon dioxide (CO2), sulphur dioxide (SO2), hydrogen sulphur (H2S) and some other sulphur species, hydrogen chloride (HCl) and other halogen compounds. Besides the gases, considerable emissions of aerosols are present in most volcanic plumes.
2.2.5 Lightning
Lightning during thunderstorm events creates plasma channels in the atmosphere characterized by the high fraction of ionic loads and high temperatures. High temperature cause chemical reactions. Major compounds of the atmo-
Emission of air pollutants
2.3 Anthropogenic emission sources
Anthropogenic emissions of air pollutants into the atmosphere depend on the population and various human activities to improve the quality of life. These activities are mainly related to supply of energy and food. Human- made emissions are very divers. In the following, some major source types are presented.
2.3.1 Industrial energy production and use
Combustion processes are the major anthropogenic sources of air pollutants during the production and use of energy.
Combustion process produces carbon dioxide (CO2) and water (H2O) as the main products. Additionally, combustion also produces several by-products, which originate either from incomplete fuel oxidation (e.g. CO, hydrocarbons, aerosol particles etc.) or from the oxidation of non-combustible species present in the combustion chamber (e.g.
NOx, SOxetc.).
During combustion processes in energy and transformation industries, or in manufacturing industries, the emissions depend on the fuel and process activity. Relevant pollutants are generally CO2, H2O, SO2, NOx, CO, NMVOC, aerosol particles, heavy metals (HM), polycyclic aromatic hydrocarbons (PAH), polychlorinated dibenzo-dioxin and polychlorinated dibenzo-furans (PCDD/F) and, for some activities, polychlorinated biphenyls (PCB) and hexachlorobenzene (HCB).
Current anthropogenic emissions of CO2are primarily the result of the consumption of energy from fossil fuels (IPCC, 2001). About 20–33% of total anthropogenic sources of methane (CH4) is also originated from combustion.
In the absence of flue gas desulphurisation (FGD) technology, the emissions of sulphur oxides (SOx) are directly related to the sulphur content of the fuel. The sulphur content of refined natural gas is negligible. The majority of SOxis sulphur dioxide (SO2) although small proportions of sulphur trioxide (SO3) can arise. For cement manufacture, some of the SO2(and other acid gases) is absorbed through contact with alkaline media in the cement kiln and, in the dry process, the raw meal.
The emission of NOxis generally in the form of nitric oxide (NO) with a small proportion present as nitrogen di- oxide (NO2). Nitric acid manufacture includes catalytic combustion of ammonia to provide NO2for subsequent absorption. Emissions of nitrogen oxides arise from nitrogen in the fuel (mainly relevant to solid and liquid fuels) and from reaction of atmospheric nitrogen. Combustion control can provide a high degree of NOxemission control (low NOxburner technology) and this may be supplemented by use of selective catalytic reduction (SCR) or selective non-catalytic reduction techniques (SNCR).
Particulate matter (PM) emissions from large combustion plants (> 50 MW) burning solid fuels are often lower than emissions from smaller plants (per unit of energy input); the physical and chemical characteristics of the particulate matter also differ. This is because different combustion and abatement techniques are applied. Combustion of fuels can generate solid residues, which may be deposited within combustion chambers (furnace bottom ash) within the furnace, boiler surfaces or ducting (fly ash) or on heat exchanger surfaces (soot and fly ash). Coal and other fuels with significant ash content have the highest potential to emit particulate matter. Suspended ash mater- ial in exhaust gases may be retained by particulate abatement or other emission abatement equipment (abatement residues). Materials, which remain in the flue gases beyond the abatement equipment and passes to the atmosphere, are primary particles.
The emission of heavy metals (arsenic (As), cadmium (Cd), chromium (Cr), copper (Cu), mercury (Hg), nickel (Ni), lead (Pb), Selenium (Se), Zinc (Zn) and Vanadium (V)) during combustion processes strongly depends on their contents in the fuels and process feedstock. Most of the heavy metals considered are normally released as compounds (e.g. oxides, chlorides) in association with particulates. Only Hg and Se are at least partly present in the vapour phase. The content of heavy metals in coal is normally several orders of magnitude higher than in oil (except occasionally for Ni and V in heavy fuel oil) and in natural gas. For natural gas, only emissions of mercury are relevant. During the combustion of coal, particles undergo complex changes, which lead to vaporisation of volatile elements. The rate of volatilisation of heavy metal compounds depends on fuel characteristics (e.g. con- centrations in coal, fraction of inorganic components, such as calcium) and on characteristics of technology (e.g.
type of boiler, operation mode).
Emission of air pollutants
The emissions of dioxins and furans are highly dependent on the conditions under which combustion and subsequent treatment of exhaust gases is carried out. The sintering process in iron and steel manufacture has been identified as a significant source of dioxins.
The emissions of polycyclic aromatic hydrocarbons (PAH) results from incomplete (intermediate) conversion of fuels. Emissions of PAH depend on the combustion process, particularly on the temperature (too low temperature favourably increases their emission), the residence time in the reaction zone and the availability of oxygen.
Carbon monoxide is found in gas combustion products of all carbonaceous fuels, as an intermediate product of the combustion process and in particular for under-stoichiometric conditions. CO is the most important intermediate product of fuel conversion to CO2; it is oxidized to CO2under appropriate temperature and oxygen availability.
Thus, CO can be considered as a good indicator of the combustion quality. Substantial emissions of CO can occur if combustion conditions are poor.
Emissions of non-methane volatile organic compounds (NMVOC), e.g. olefins, ketones, aldehydes, result from incomplete combustion. Furthermore, unreacted fuel compounds such as ethane (C2H6) can be emitted. The relevance of NMVOC and CH4emissions from boilers, which are often reported together as VOC, is very low for large-sized combustion plants.
2.3.2. Transport
Transport is another major source of air pollutants. Terrestrial, naval and aerial transportation use a huge amount of energy and during the combustion processes, various components are emitted into the atmosphere. In order to comply with emission legislation, vehicle manufacturers have installed various after-treatment devices, such as catalytic converters and diesel particle filters (DPFs) to reduce pollutant emissions. However, such devices may, as a result of their action, also produce small quantities of pollutants such as NH3and N2O.
During terrestrial transport, the most important pollutants emitted by road vehicles are ozone precursor compounds, (CO, NOx, NMVOCs), greenhouse gases (CO2, CH4, N2O), acidifying substances (NH3, SO2), aerosol particles, carcinogenic species, such as polycyclic aromatic hydrocarbons (PAHs) and persistent organic pollutants (POPs), heavy metals and other toxic substances (dioxins and furans).
The emissions produced by railways arise from combusting the fuel in an internal combustion engine. Consequently, the principal pollutants are those from diesel engines, i.e. similar to those used in road transport. These are principally CO2, PM and NOx, plus to a lesser extent CO and hydrocarbons, together with SOxand heavy metals originating from the content of fuel in sulphur and metals, respectively.
The emissions produced by aviation come from the use of jet fuel (jet kerosene and jet gasoline) and aviation gasoline (used to fuel small piston engine aircraft only) that are used as fuel for the aircraft. Consequently, the principal pollutants are those common to other combustion activities, i.e. CO2, CO, hydrocarbons and oxides of nitrogen, with SO2emissions being dependent of the level of sulphur in the fuel. Other important species (like PM, N2O, CH4) are emitted at relatively low concentrations. Air pollutants emitted by aircrafts can affects the atmo- spheric processes in the free troposphere and in the lower stratosphere too.
Water-borne navigation causes emissions of carbon dioxide (CO2), methane (CH4) and nitrous oxide (N2O), as well as carbon monoxide (CO), non-methane volatile organic compounds (NMVOCs), sulphur dioxide (SO2), particulate matter (PM) and oxides of nitrogen (NOx).
2.3.3 Agriculture
Agricultural activities can also result human-made emission of air pollutants into the atmosphere. Main sources of emission from animal husbandry and manure management are livestock housing and holding areas, manure storage, field-applied manure and manure deposited during grazing. During these activities NH3, NO and NMVOCs
Emission of air pollutants
An additional, less important agricultural source of air pollutants is crop burning. During these processes ammonia (NH3), nitrogen oxides (NOx), non-methane volatile organic compounds (NMVOCs), sulphur dioxide (SO2), carbon monoxide (CO), particulate matter (PM), heavy metals (HM) and dioxin are released to the atmosphere.
2.3.4 Waste management
Major emissions from waste disposal are emissions of greenhouse gases. Small quantities of NMVOCs, CO, NH3 and NOxmay be released as well. Particulate matter (PM) emissions are also emitted from waste handling, but no emission factors are available.
2.3.5 Biomass burning
The relative contribution of (open and domestic) biomass burning emissions to the global annual emission for CO is ~ 25 %, for NOx~ 18 % and for non-methane volatile organic compounds (NMVOC) and CH4~ 6 % (Intergov- ernmental Panel on Climate Change (IPCC), 2001). In Europe however, the contribution to total emissions is much lower, since the vast majority of fires occur in tropical regions.
2.3.6. Anthropogenic sources of air pollutants by differ- ent sectors
The air pollutants emissions vary greatly with time and space. The distribution among each sectors are also highly variable depending to the development level of each country. Here we focus only on the emission inventories of the European Union based on the Technical Reports of European Environment Agency (EEA, Technical Report, 2008, 2009, 2012). Further data can be available for example at http://www.epa.gov/air/emissions/.
Greenhouse gases:
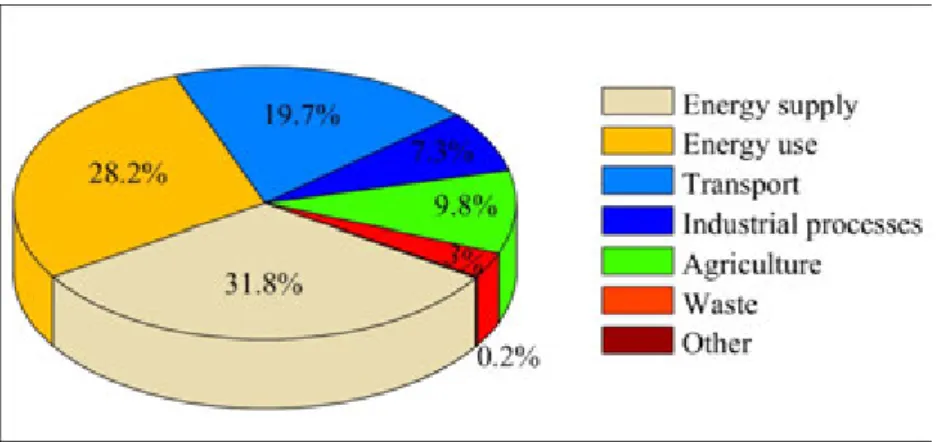
The total greenhouse gas (GHG) emission in the Europen Union was 4720.9 Mt CO2equivalent in 2010. The most significant sectors that release GHGs into the atmosphere are energy supply and use as well as transport, both in the whole European Union (Figure 2.5) and in Hungary (Figure 2.6).
Figure 2.5: Share of greenhouse gas (GHG) emissions by main source types in EU countries in 2010 Emission of air pollutants
Figure 2.6: Share of greenhouse gas (GHG) emissions by main source types in Hungary in 2010
Figure 2.7: Share of greenhouse gas (GHG) emissions by species in EU countries in 2010
Figure 2.8: Share of greenhouse gas (GHG) emissions by species in Hungary in 2010
Figure 2.7 and Figure 2.8. show the percentage of each emitted greenhouse gases in 2010 in EU, and in Hungary, respectively.
Nitrogen oxides (NOx):
The main anthropogenic sources of nitrogen oxides are transport and public electricity and heat sector (Figure 2.9).
In combustion equipments the NOxare formed during the combustion process at high temperatures by the oxidation Emission of air pollutants
Figure 2.9: Emission sources of nitrogen oxides (NOx) in 2006 in EU27. Emission data are calculated by the estim- ations of member countries.
Carbon monodide (CO):
Carbon monoxide is mainly produced as an intermediary product of combustion processes. In the EU-27, total emissions of CO was 30 200 Gg in 2006. This is a result of a large decrease by just over 53% between 1990 and 2006 (EEA, 2008). Contributions to total CO emission by different sectors in the European Union can be seen in Figure 2.10. Main sources of carbon dioxide are transport and residential heating.
Figure 2.10: Emission sources of Carbon monoxide (CO) in 2006 in EU27. Emission data are calculated by the estimations of member countries.
Non methane volatile organic compounds (NMVOC):
The Earth’s vegetation naturally releases huge amounts of organic gases into the air. As plants assimilate carbon dioxide into biomass through photosynthesis, a fraction of this carbon leaks out in to the atmosphere, predominantly in highly reduced forms such as isoprene and terpenes. In addition to emissions from natural sources, several an- thropogenic processes result in the emission of organic compounds such as carbonyls, alcohols, alkanes, alkenes, esters, aromatics, ethers and amides. Biogenic sources in total are considered to be approximately ten times larger than the sum of anthropogenic emissions including fossil fuel emissions and biomass burning (Williams and Koppmann, 2007). At the same time, human made emission can play important role in local atmospheric chemistry, e.g. in ozone production (see Chapter 8). The anthropogenic contribution to organic emissions in the atmosphere is originated from transport, other explotation of fossil fuels, product use and paint applications (Figure 2.11).
In Europe, the total NMVOC emission of EU27 was 9 391 Gg in 2006 (EEA, 2008). The NMVOC emission is decreased by 44% in Europe since 1990.
Emission of air pollutants
Figure 2.11: Emission sources of non-methane volatile organic compounds (NMVOC) in 2006 in EU27. Emission data are calculated by the estimations of member countries.
Sulphur oxides (SOx):
Sulphur components are released into the atmosphere by both natural and anthropogenic sources. Human made emissions however are more significant than natural sources (Möller, 1994). Anthropogenic sulphur emission is principally originated from fossil fuel combustion. Total SOxemission was 7 946 Gg in 2006 in EU countries (EEA, 2008). Due to the rigid emission reduction strategies in Europe, SOxemission have decreased continuously in the last decades (about 70% decrease have realized in SOxemission since 1990, when total SOxemission was 26 217 Gg). Main anthropogenic sources of sulphur compounds is public electricity and heat production, which accounts for more than 58 % of total emissions, and manufacturing industries and constructions (about 14% of total SOxemissions) (Figure 2.12).
Figure 2.12: Emission sources of sulphur oxides (SOx) in 2006 in EU27. Emission data are calculated by the estim- ations of member countries.
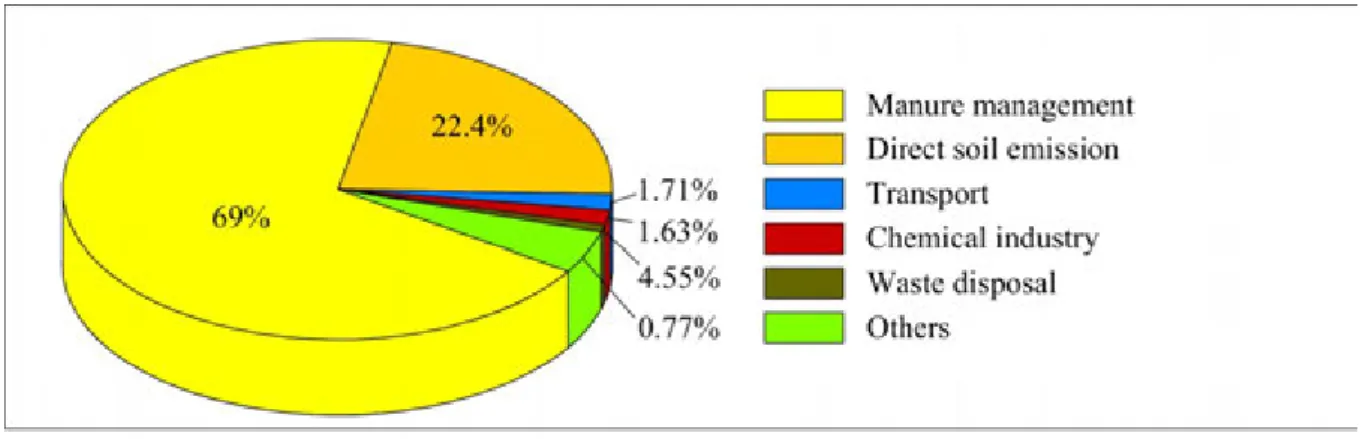
Ammonia (NH3):
The major sources for atmospheric ammonia are agricultural activities. Close to the emission sources, acute exposures to NH3can result in visible foliar injury on vegetation. NH3is deposited rapidly within the first 4–5 km from its sources in the function of weather and plant conditions (see e.g.: Horváth, et al., 2005). However, NH3is a very important alkaline constituent in the atmosphere. It reacts with acidic substances such as sulphuric acid (H2SO4), nitric acid (HNO3), nitrous acid (HNO2), or hydrochloric acid (HCl) to form NH4ammonium salts that occur predominantly in the fine particle (size < 2.5 mm) fraction causing regional scale problems (see e.g.: Krupa, 2003).
Total ammonia emission was 4 001 Gg in 2006 in the European Union countries (EEA, 2008). This value shows a 22% decrease compared to the emission in 1990 (5 118 Gg). The two most important key categories of NH are
Emission of air pollutants
Figure 2.13: Emission sources of ammonia (NH3) in 2006 in EU27. Emission data are calculated by the estimations of member countries.
Particulate matter:
Figure 2.14: Emission sources of particulate matter, PM10 in 2006 in EU27. Emission data are calculated by the estimations of member countries.
Next to the natural sources of primary aerosol particles (see Chaper 9), a huge number of different size particles are also released into the atmosphere by several various anthropogenic processes. The total PM10 emission was 1 555 Gg in EU27, in 2006 (EEA, 2008). Almost 60% of this emission occurs in energy-related sectors, with a further 13% of emissions occurring in the agriculture sector (Figure 2.14).
Total PM2.5 emissions was 1 044 Gg in EU-7, in 2006 (EEA, 2008). In 2006, PM2.5 emissions from the residential category contributed approximately 30% to total emissions (Figure 2.15). Other main sources were road transport- ation (18%) and manufacturing industries (11%). Both PM10 and PM2.5 emission have decreased since 1990 with about a 10% in Europe.
Emission of air pollutants
Figure 2.15: Emission sources of particulate matter, PM2.5 in 2006 in EU27. Emission data are calculated by the estimations of member countries.
References
EEA Technical report, 2008: Annual European Community LRTAP Convention emission inventory report 1990–2006 Submission to EMEP through the Executive Secretary of the UNECE. EEA Technical report. No 7/2008.
ISBN 978-92-9167-366-7.
EEA Technical report, 2009: EMEP/EEA air pollutant emission inventory guidebook 2009. Technical guidance to prepare national emission inventories. EEA Technical report. No 9/2009. ISBN 978-92-9213-034-3.
EEA Technical report, 2012: Greenhouse gas emission trends and projections in Europe 2012. Tracking progress towards Kyoto and 2020 targets. EEA Report. No 6/2012. ISBN 978-92-9213-331-3.
Horváth, L., Asztalos, M., Führer, E., Mészáros, R., and Weidinger, T.. 2005. Measurement of ammonia exchange over grassland in the Hungarian Great Plain In: Agricultural and Forest Meteorology. 130. 282-298.
IPCC, 2001: Climate Change 2001: The Scientific Basis. Contribution of Working Group I to the Third Assessment Report of the Intergovernmental Panel on Climate Change. Houghton J.T., Ding Y., Griggs D.J., Noguer M., van der Linden P.J., Dai X., Maskell K., and Johnson C.A.. (eds.). Cambridge University Press, Cambridge, United Kingdom and New York, NY, USA. 881pp. ISBN 0521 80767 0.
Krupa, S.V.. 2003.Effects of atmospheric ammonia (NH3) on terrestrial vegetation: a review. Environment Pollution.
124. 179-221.
Möller, D.. 1994.Global sulfur and nitrogen biogeochemical cycles. In: Boutron, F (ed) Topics in atmospheric and terrestrial physics and chemistry. Vo. 2. 125-156. ISBN 2-86883-287-3.
Williams, J. and Koppmann, R.. 2007.Volatile Organic Compounds in the Atmosphere: An Overview, in Koppmann, R (ed): Volatile Organic Compounds in the Atmosphere. Blackwell Publishing Ltd., Singapore. Vo. 1- 32. 125-156. ISBN 978-1-4051-3115-5.
http://www.ceip.at/ceip/
http://www.epa.gov/air/emissions/
Emission of air pollutants
Chapter 3. Basics of the reaction kinetics
Chemical kinetics studies the speed with which a chemical reaction occurs and the factors that affect this speed.
This information is especially useful for determining how a reaction occurs. Let’s consider the following chemical reaction:
(3.1) .
Here letters A, B, C, and D represent chemical species involved in the chemical transformation.νa,νb,νc, andνd are the stoichiometric coefficient for the given reaction.
The speed of a reaction is the rate at which the concentrations of reactants and products change. The term rate of reaction (r) occurring in a closed system under isochoric conditions, without a build-up of reaction intermediates can be written in the form (Atkins, 1997):
(3.2) ,
whereciis the concentration and is the stoichiometric coefficient of reactants and products, respectively. (Note:
The rate of a reaction is always positive. Stoichiometric coefficients for products are positive and for reactants are negative in reaction kinetics. Moreover, stoichiometric coefficients are not always cardinal numbers.)
The effect of concentration on the rate is isolated as
(3.3) ,
where the specific ratek, called reaction rate coefficient, is independent of concentration but does depend on tem- perature, catalysts, and other factors. The law of mass action states that the rate is proportional to the concentrations of the reactants and has a form
(3.4) .
Here exponentsα,βare empirical and identifies the order of the reaction, and they can be determined from reaction kinetics measurements. Importantly, they are identical with the stoichiometric coefficients when the stoichiometric equation truly represents the mechanism of reaction i.e. the reaction is an elementary reaction.
3.1. Differential rate law
In many reactions, the rate of reaction changes as the reaction progresses. Initially the rate of reaction is relatively large, while at very long times the rate of reaction decreases to zero (at which point the reaction is complete). In order to characterize the kinetic behaviour of a reaction, it is desirable to determine how the rate of reaction varies as the reaction progresses. A rate law is a mathematical equation that describes the progress of the reaction (3.4).
In general, rate laws must be determined experimentally as we discuss earlier. Unless a reaction is an elementary reaction, it is not possible to predict the rate law from the overall chemical equation. There are two forms of a rate law for chemical kinetics: the differential rate law and the integrated rate law.
The differential rate law relates the rate of reaction to the concentrations of the various species in the system. Dif- ferential rate laws can take on many different forms, especially for complicated chemical reactions. Each rate law contains the reaction rate coefficient. The units for the rate coefficient depend upon the rate law, because the rate always has units of mole L−1s−1and the concentration always has units of mole L−1. There are some examples of different differential rate laws.