1
Degradation phenomena on atmospheric air plasma treatment of polyester fabrics
Szilvia Kléberta*, Sándor Tilajkaa,b, Loránd Románszkia, Miklós Mohaia, Emília Csiszárb,Zoltán Károlya
aInstitute of Materials and Environmental Chemistry, Research Centre for Natural Sciences, H-1117 Magyar tudósok körútja 2. Budapest Hungary
bDepartment of Physical Chemistry and Materials Science, Budapest University of Technolo- gy and Economics, H-1111 Műegyetem rkp. 3. Budapest Hungary
* corresponding author Abstract
Surface treatments are commonly employed on woven fabrics to render properties such as dyeability, antibacterial feature, self-cleaning, etc. A variety of environmentally benign cold plasma treatments present a viable alternative to the conventional wet chemical processes.
The various plasma designs, however, may differ in the efficiency and the effect they exert on the fabrics. In this work a polyester woven fabric was treated by diffuse co-planar surface barrier discharges in atmospheric air for various lengths of time. X-ray photoelectron spec- troscopy investigation revealed that changes in surface chemistry occurred within 30 sec- onds of treatment. Carbon containing contaminations were removed and the surface be- came more oxidized, however, new chemical states have not been developed. As an effect, wettability and wickability of the fabric significantly increased. A slight increase in the roughness also occurred after treatment according to AFM measurements. The tensile strength of the fabric showed a gradually decreasing trend with respect to treatment time that could be attributed to damaged sites in the fabric generated by the local excessive etch- ing of the plasma. The results show the detrimental effect of prolonged plasma treatment on the woven poly(ethylene-terephthalate) (PET) fabrics. Employing longer treatment times of 120 s and 180 s the mechanical properties reduced by ca. 40% and 50%, respectively, with- out significant changes in the surface morphology.
Keywords: DCSBD plasma, PET fabric, atomic force microscopy, surface chemistry and mor- phology, tensile strength
1. Introduction
Today, the surface treatment of natural and synthetic fibers and fabrics is a commonly em- ployed technique for various purposes [1-3]. It is used to attain higher durability, flame- retarding ability, electroconductivity, improved adhesion, developed antibacterial feature, shrink-resistance, self-cleaning behavior, etc. [4]. Due to growing environmental concern, the conventional chemical processes for surface treatment are increasingly substituted by various cold plasma techniques that are environmentally benign and getting more affordable
Manuscript File Click here to view linked References
2
[5]. Among the abundant cold plasma techniques, atmospheric plasmas offer obvious ad- vantages over their low-pressure counterparts [6-8]. The various types of atmospheric cold plasma devices – corona, dielectric barrier discharge (DBD), glow discharge, plasma jet, etc. – can greatly differ in their design and discharging mechanisms. However, a common feature is that ions and radicals present in the plasma induce several chemical and morphological changes in the material during operation [9-12]. As a result, the level of contaminations such as hydrocarbons and other organic compounds typically present on the polymer surfaces tends to decrease. Fast electrons in the plasma are capable of breaking double and triple covalent bonds generating free radicals and subsequently new polar functional groups [13].
Surface roughness is also commonly affected by plasma treatment. The changes in the mor- phology are usually negligible during short (5-10 s) treatments [14], however, may be signifi- cant for prolonged ones [15]. The length of plasma treatment shows great variety lasting from a few seconds to as long as 60 min [16]. These changes usually occur simultaneously, and the final properties of the fabric are determined by the complex effect of the above mechanisms. Several papers have been published on plasma treatment of poly(ethylene- terephthalate) (PET) fibers and fabrics to improve wettability, printability and dye adsorp- tion, or to confer antistatic properties, grafting enzymes for various purposes, etc. [17-20].
They unanimously concluded that the surface became more oxidized with increased surface energy resulting in higher wettability [21]. Mechanical properties, especially tensile strength of the treated fabric, however, usually received less attention in spite of this could be of great importance from application point of view. As plasma treatment is considered to affect only the outmost part of the surface, changes in the mechanical properties are not expected or seem negligible. In addition, existing studies are equivocal in this matter. Enhanced me- chanical properties of natural fibers were reported on plasma treatment in [22][23], while in case of synthetic fibers, a slight decrease of the tensile properties was observed due to plasma etching effect [24]. Although the etching effect has been confirmed by several au- thors, the changes in the mechanical properties of artificial fibers were not examined com- prehensively [25][26]. In this paper, we treated the surface of a PET fabric by coplanar sur- face DBD plasma under atmospheric air and studied the physical and chemical changes of the surface as well as the tensile strength of the fabric in function of the treatment time.
2. Experimental
Polyester (100%) twill fabric with a weight per unit area of 55 g/m2 made from filament yarns was used in this research. Prior to the tests, the fabric was washed with a neutral soap for 30 min at 40 °C and air-dried. The fabric specimens were conditioned at 55% relative humidity and 23 °C for 24 hours before being treated and tested. Cold plasma treatments were performed in ambient air, by a diffuse coplanar surface barrier discharge (DCSBD) type equipment (Manufacturer: Roplass s.r.o., Brno, Czech Republic). The plasma was powered with a sinusoidal low frequency, ~10-20 kHz, high voltage with peak-to-peak values of up to 20 kV. Both sides of the PET fabric samples (12 cm × 20 cm) were treated at 300 W power with treatment times of 30, 60, 120 and 180 s. The samples were moved on the surface of
3
the plasma device at a slow but continuous rate. During plasma treatments warp yarns of the fabrics were situated invariably parallel to the electrodes.
Fourier transform attenuated total reflectance infrared spectra (FTIR-ATR) were recorded on the fabrics in the wavenumber range of 4000 to 400 cm−1 in 32 scans, using a Tensor 27 (Bruker) spectrophotometer equipped with a Platinum ATR unit A225 containing a diamond prism with a refractive index of 2.4. For the background signal, the measured medium was air.
The surface roughness of individual PET fibers, which were removed from the untreated and 30 s treated fabric, was measured by a Dimension 3100 atomic force microscope equipped with a Nanoscope IIIa controller (Digital Instruments/Veeco, Santa Barbara, California, USA) on 4, and 64 μm2 areas using silicon cantilevers in contact mode with 512×512 pixelresolu- tion [27]. For the two scan sizes, the number of measurements was 16, respectively 13 in the case of samples before plasma treatment, and 13, respectively 9 in the case of samples after plasma treatment. Known weaknesses and systematic errors of AFM scanning, such as tip convolution problems determined by tip radius and cone angle, no tracking of deep trenches and steep slopes, etc., were not taken into account in the data treatment.
Raw measurement data files were processed using the Nanoscope software by first applying a 3rd order flattening. Three widely used roughness parameters see e.g. ref. [28][29] were determined, such as the
1. root mean square roughness, Rq (also RMS):
𝑅q = √∑𝑛𝑖=1𝑧𝑖2 𝑛
where 𝑧𝑖 represents the distance of the ith point from the mean plane;
2. mean roughness, Ra:
𝑅a = 1
𝑛∑|𝑧𝑖|
𝑛
𝑖=1
3. max. height, Rmax, the vertical distance of the highest point from the lowest point.
X-ray photoelectron spectroscopy (XPS) measurements were done by a Kratos XSAM 800 spectrometer operating in fixed analyzer transmission mode, using Mg Kα1,2 (1253.6 eV) ex- citation. Survey spectra were recorded in the kinetic energy range of 150–1300 eV with 0.5 eV steps. Photoelectron lines of the main constituent elements, that is, the O1s, N1s, and C1s, were recorded in 0.1 eV steps. The spectra were referenced to the C1s line (binding energy, BE = 285.0 eV) of the hydrocarbon type carbon. A Gaussian–Lorenzian peak shape (70:30 ratio) was used for peak decomposition. Quantitative analysis, based on peak area intensities after removal of the Shirley type background, was performed by the Kratos Vi- sion 2 and by the XPS MultiQuant programs [30], using experimentally determined photoion- ization cross-section data of Evans et al. [31] and asymmetry parameters of Reilman et al.
[32]. Correction for surface contamination was done by the method of Mohai [33]. The sur-
4
face morphology was investigated by an EVO 40 scanning electron microscope (Carl Zeiss AG, Oberkochen, Germany) at 10 kV acceleration voltage. In all cases secondary electron (SE) detector was applied and working distance (WD) was 11.5 mm. To avoid electrostatic charg- ing of the surface, the samples were coated with a ~10-30 nm thin gold layer.
Wettability of the plasma treated fabrics was characterized by water drop test, measuring the elapsed time between the contact of the water drop with the fabric and the disappear- ance of the drop into the fabric [34]. A burette was used to drop a single droplet of water on the sample from a height of 1 cm. Ten readings were taken from different locations on the samples subsequent to the plasma treatment and the average was presented.
Wickability of the plasma treated fabrics was also determined. A strip of the fabric (2 cm × 10 cm) was vertically dipped to a depth of 1 cm into the distilled water and the time for wicking height of 2 cm was measured at 20 ± 0.2 °C and the wicking rate was calculated [35][36]. At least eight wicking measurements were made for each fabric in the warp direc- tion and the averaged wicking time was used for the calculations.
Mechanical properties were determined by an Instron 5566 tensile tester at 50 mm/min cross-head speed with 20 mm gauge length on specimens with 7 mm width. Four or more parallel measurements in warp direction were made and averaged.
3. Results
3.1. Surface characterization
The surface chemistry of the treated and untreated fibers was analyzed by infrared spectros- copy and XPS methods. High resolution X-ray photoelectron spectra of the untreated sample are shown in the upper row of Figure 1. The C1s and O1s spectral regions are decomposed according to the expected chemical states of PET (details of the data processing are described in the appendix). The binding energy positions of the components are in excellent agreement with the literature data [37], as shown in Table 1.
Table 1. Positions of the photoelectron lines (binding energy, eV) of the PET samples
O1s C1s N1s
O=C O–C CH C–O C=OO N–C Measured (±0.1 eV) 531.7 533.3 284.7 286.3 288.6 400.1 Literature [37] 531.62 533.22 284.70 286.24 288.66
Figure 1. C1s, O1s and N1s photoelectron spectra of the untreated (upper row) and the 180 s plasma treated (lower row) PET samples. For the untreated sample, the CH component coincides with the adventitious carbon
5
The quantitative composition, however, is far from the theoretical one, as shown in Table 2.
The concentration of the CH type carbon is higher than the expected value, which indicates the presence of adventitious carbon contamination. The chemical states of the CH and contaminant carbons cannot be distinguished but an aliquot part of the CH intensity can be accounted as contaminant. By applying a correction [31] for the contamination and varying its intensity, an optimum can be achieved, where the surface composition is very close to the expected one (Table 2). The present contamination is approximately equivalent with a 1 nm thick continuous carbonaceous layer on the PET (calculated by the Layers-on-Cylinder model [38]). Such level of contamination is typical on surfaces stored in ambience.
Table 2. Surface chemical composition (atomic %) of the untreated and plasma treated PET samples.
Treatment O C N O/C
O=C O–C CH C–O C=OO N–C
Theoretical 14.3 14.3 42.9 14.3 14.3 0.40
Untreated, uncorr. 11.1 9.0 58.3 11.3 10.2 0.25 Untreated, corr. 15.9 12.9 42.9 14.8 13.4 0.40 Plasma 0.5 min 15.1 16.5 34.2 17.1 16.0 1.1 0.47 Plasma 1 min 14.1 14.3 39.5 16.9 14.0 1.2 0.40 Plasma 2 min 15.5 15.1 37.0 16.1 15.6 0.6 0.44 Plasma 3 min 15.7 15.8 36.9 15.7 15.2 0.7 0.46
During plasma treatments, no new chemical states have been developed; spectra of all samples could be decomposed by the scheme used for the untreated sample. Typical spectra are illustrated in the lower row of Figure 1. Besides the main constituents, a small amount of nitrogen has built in at the interface. The nitrogen is bonded to carbon, as C–N–C or C–NH2, while N–O bonds cannot be detected.
Figure 2. Infrared spectra of PET fabric samples. Black: untreated, red: 30 s treated, blue:
180 s treated
Figure 2 shows the ATR-FTIR spectra of untreated and activated samples. The infrared spec- tra indicate the typical group frequencies of PET: the C–C and C–H groups of the backbone chain, the C–C, C=O and C–O units of the ester group. (Major infrared bands are as follows:
3000–2800 cm−1: C–H stretching, ~1720 cm−1: C=O stretching, ~1250 cm−1: C(O)–O stretching of ester group, ~720 cm−1: interaction of the two carbonyl substituents on the aromatic ring [39][40]). The only minor changes in the IR spectrum caused by the plasma treatment oc- curred in the range of 2950–2800 cm−1, shown as an inset in Figure 2. This absorption inter- val is attributed to the aliphatic asymmetric and symmetric C–H stretching [41]. The very light decrease in the intensities suggests a decrease of the number of CH2 groups on the sur-
6
face, which can be attributed to elimination of H atoms during C radical formation [42].
Based on the IR spectra, the reaction time has no significant effect on the surface chemistry.
3.2. Wettability and wickability
Although contact angle measurement performed by static sessile drop method is commonly used for evaluating the wettability of solid materials (see, e.g., [43]), it is difficult to apply in the case of porous fabrics. For this reason, we employed an alternative technique detailed in [34] also accepted for such purpose that is more appropriate for fabrics. In Figure 3 we illus- trated the results of the water drop test. The untreated polyester fabric did not behave hy- drophilic with a wetting time of 126 s. However, even the shortest plasma treatment in- duced significant changes in wetting and the time needed for the water drop to disappear was decreased by approximately 70%. Increasing the time of plasma treatment, however, resulted only in a slight improvement of the wettability. Results of the wickability tests (Fig- ure 4) confirmed that plasma treatment rendered the fabric hydrophilic. However, the change was slower as compared to the previous test. The diagram also shows that the wick- ability practically did not change any further over 60 s treatment.
Figure 3. Wetting time of PET fabric as a function of plasma treatment time
Figure 4. Effect of plasma treatment time on the water wicking rate of PET fabric 3.3. Morphology
Surface images
The fabric samples were placed on an illuminated background (overhead projector) and pho- tos were taken by a commercial digital camera. Figure 5 shows the images of the fabrics be- fore plasma treatment and afterwards. Tiny transparent stripes are visible even after 30 s treatment, however, they appear more pronouncedly on the fabric treated for 180 s. These stripes suggest severe local degradation, which has not been observed on natural fibers ex- posed to similar treatment [44].
Figure 6 shows SEM images of the woven fabrics after different plasma treatment times. The surface of the fibers is almost identical and uniform in terms of morphology regardless of the treatment time. However, in the smaller magnification SEM image of a 3 min treated fabric (Figure 7.a), a series of ripped yarns situated in a line on an extended section can be ob- served. In fact, these correspond to the transparent stripes seen on the photos in Figure 5.
At a higher magnification (Figure 7.b), the shape of the fiber ends in the damaged yarns sug- gesting that the failure has probably occurred due to the plasma etching. Borcia et al. also reported on degradation of plasma treated polymers (PET, nylon) [1], however, they found visible evidence for melting, rather than etching, as the main reason for degradation. They
7
attributed the degradation to corona effect where more energetic discharges are localized on certain spots at the yarn crossover points. In our study, such melted fiber segments could not be detected.
Figure 5. Optical images of untreated, respectively 30, 120 and 180 s plasma treated PET fabric samples. (1:6 magnification)
Figure 6. SEM pictures of untreated, respectively 30 s and 180 s plasma treated PET fabric samples
Figure 7. SEM pictures of the failures attributed to 180 s plasma etching in two different magnifications
Surface roughness
In order to follow the surface changes at a smaller length scale, a more detailed morphologi- cal investigation was performed by AFM on untreated and 30 s treated individual fibers. Fig- ure 8 shows typical side view height images of both untreated and 30 s treated samples in two scan sizes.
Figure 8. Representative side view (0°) of untreated, respectively 30 s plasma-treated sam- ples scanned in two scan sizes. Note that the height scale range is 160 nm for all images Significant differences in the roughness of the untreated and 30 s treated samples can be observed only in the case of the smaller, 4 μm2 scan areas. Figure 9 summarizes the results of roughness measurements before and after 30 s plasma treatment presented in boxplot charts of three roughness parameters (Rq, Ra, and Rmax) as a function of the scanned area.
Both the median and the mean values became higher after 30 s plasma treatment as com- pared to the untreated sample. In order to assess whether the roughness parameters of the untreated and treated samples significantly differ, univariate Mann–Whitney tests [45] were performed on the corresponding datasets. The outcome was that the roughness parameters were significantly different at the 0.05 error level only at the smaller scan size (4 μm2), whereas at the larger scan sizes, the roughening effect of the 30 s plasma treatment could not be ascertained.
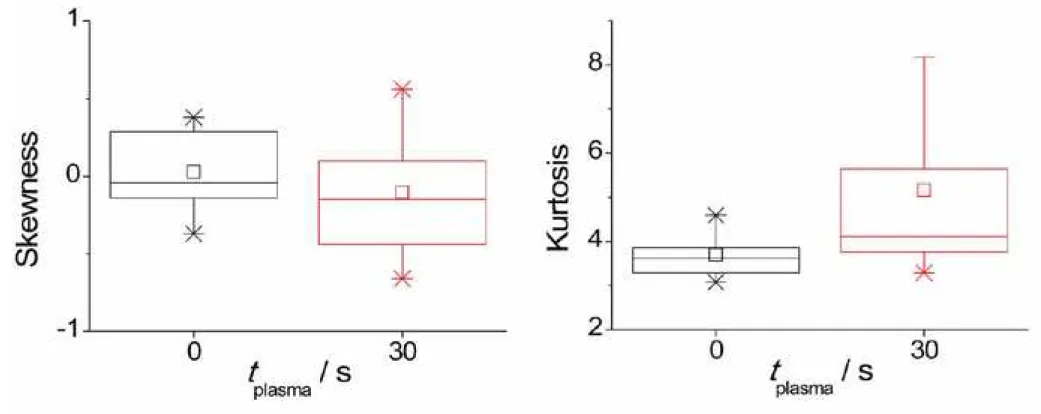
Figure 10 illustrates the skewness and kurtosis values (Ssk, Sku) for the samples measured before and after 30 s plasma treatment in a boxplot charts. The skewness of the surface height (0.03) is very close to that of a symmetric distribution (0). After plasma treatment, the skewness slightly decreases (-0.10), suggesting the dominance of valleys, rather than peaks.
8
The kurtosis of the surface height is larger (3.697) than what would correspond to a Gaussi- an distribution (3) slightly increased after plasma treatment (4.114). Such leptokurtic distri- bution suggests the presence of sharp peaks and steep valleys before, and their further in- tensification after plasma treatment.
Figure 9. Roughness parameters (Rq, Ra, Rmax) of the PET fibers before (black) and after (red) a 30 s plasma treatment measured on 4 (upper row), respectively 64 μm2 areas (lower row).
Boxplot statistics representing the 25, 50 and 75% percentiles in the box, 1 and 99% percen- tiles as the whiskers and means as squares
Figure 10. Skewness and kurtosis parameters (Ssk, Sku) of the PET fibers before (black) and after (red) a 30 s plasma treatment measured on 4 μm2 areas
Roughening effect of various cold plasma treatments on polymers shows different outcome in the literature. Al-Maliki et al. [46] found significant decrease in the mean roughness after 1 min of DCSBD treatment of a PET sheet (and poly(ether-ether ketone) (PEEK), likewise). A 30 s low-pressure RF water vapor plasma treatment of alkaline scoured, bleached and mer- cerized cotton fibers caused the increase of Ra from 3.1 to 9.6 nm, measured on 1 × 1 μm2 areas [47]. The Rq surface roughness (RMS) of PET fibers, measured on 2 × 2 μm2 areas, in- creased from 17 nm to 55 nm after an O2 plasma treatment of 30 min at 0.5 torr [48]. Ra of lyocell fibers increased from 0.2 nm to 3.8 nm after a 20 min O2 plasma treatment [49]. Ra of ultra-high-molecular-weight polyethylene fibers increased from 95 nm to 227 nm after a low temperature oxygen-plasma treatment, as measured by 3D laser scanning confocal micro- scope on 4 × 4 μm2 areas [50]. Takke et al. found that the direction and extent of the chang- es in the roughness varied with treatment time and applied specific energy [51]. Similar find- ings were reported by Poletti et al [14]. The roughness sharply increased within the first mi- nute of treatment reaching a plateau followed by a decreasing trend over 5 min of treat- ment. The reason of these phenomena, however, was left unanswered. Regardless of the significant changes in the roughness during the various plasma treatments, the absolute val- ues of the roughness seem negligible as compared to the thickness of the treated fibers. Yet, the roughness cannot be neglected as it can have considerable influence both on the me- chanical properties [2] and wettability [52] of the fabrics.
3.4. Mechanical properties
Figure 11 illustrates the tensile properties of PET fabric in the function of exposure time. A definite relationship can be noticed between tensile strength and treatment time. Both ten- sile strength and elongation gradually decrease with longer treatment time. Within 30 s
9
treatment, a rather high, approximately 10% drop occurred, which increased up to 50% till the end of the 3 min plasma treatment. In parallel, the standard deviation of the measured quantities also increased indicating that the fabrics became less homogeneous in terms of mechanical properties. Although plasma treatment is considered to induce changes only in the surface while leaving the bulk unaffected [53], which is one of its main advantages over conventional chemical methods, this is seemingly not the case when it comes to prolonged plasma treatments.
Figure 11. Tensile properties of the PET fabric as a function of treatment time 4. Discussion
According to the wicking tests, the wettability of the fabric was greatly improved after DCSBD plasma treatment. Similar findings were reported in earlier papers on cold plasma treatment of PET films [54]. The improved wettability basically can be reasoned by two fac- tors. On the one hand, the surface of polymers is typically contaminated with a hydrophobic CH type layer that was completely removed by the plasma treatment. On the other hand, the surface became more oxidized due to radicals present in the plasma. The plasma may induce the fragmentation of the polymer chain and formation of new functional groups [55- 57].
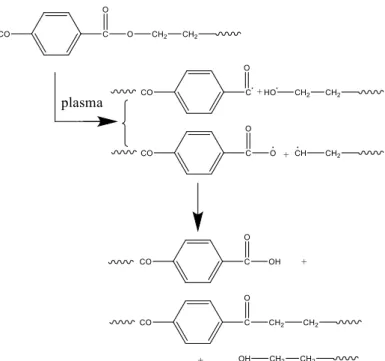
Possible reactions taking place during air plasma treatment is given on Scheme 1. [58]. While we could not detect new functional groups by XPS, the number of the oxidized groups was significantly increased. This is clearly indicated by the O/C ratio, which was increased from the theoretical 0.4 to 0.46 after plasma treatment (Table 2). However, compared to the O/C ratio of 0.25, characteristic for the untreated sample with organic contamination, the in- crease is even higher. We believe that the elimination of the adventitious carbon contamina- tion from the surface has much higher contribution to the overall wettability than the for- mation of new oxidized groups on the surface. This assumption is also confirmed by the in- significant changes of the surface composition with respect to treatment time (Figure 12).
10
Scheme 1. The possible reactions taking place during air plasma treatment
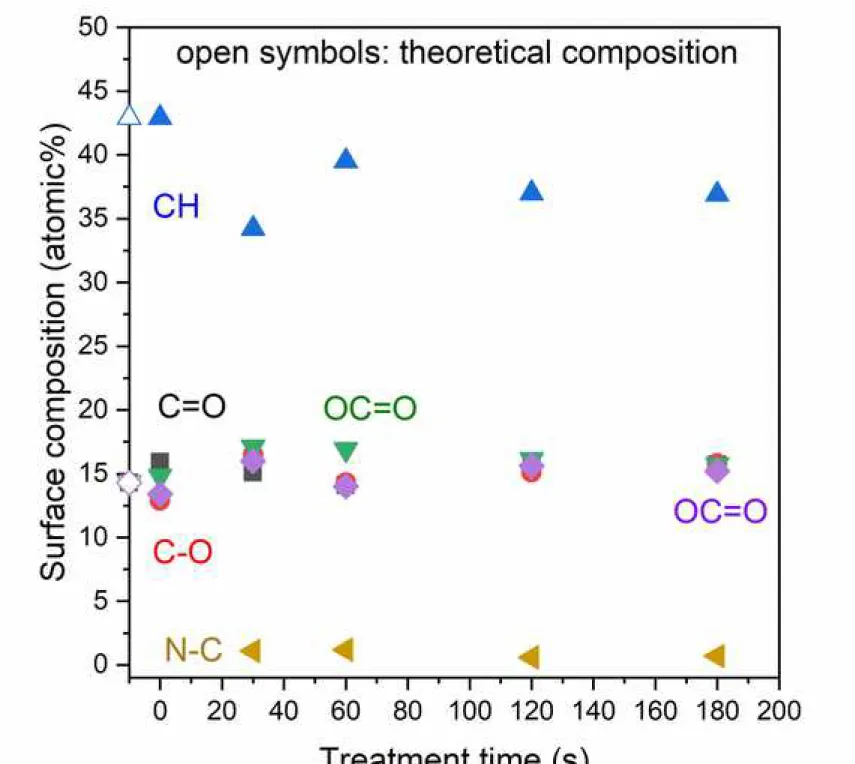
Figure 12. Change of the surface chemical composition of PET samples during plasma treatment. Composition of the untreated sample is corrected for the adventitious carbon [33]
The most significant changes in the composition occur within 30 s, while beyond only minor variations can be detected. Even relatively long treatment times (2-3 min) have left the composition unchanged. The composition profile and the fact that all of the adventitious carbon was removed at short treatment time suggest a steady state matter transport off the surface. The compositions at 0.5 min and 1 min treatment may present a transitional state between the pristine sample and materials with prolonged treatment, when the surface is more oxidized but the oxygen containing volatile species are still bonded (at least partially) to the surface.
FTIR analysis is commonly considered as less reliable technique for tracking the changes in the polymer after plasma treatment since it provides information not only from the surface but also the deeper regions. Yet, the obtained results, which indicated the same functional groups before and after plasma treatment are suitable to confirm that the plasma did not affect the composition of the bulk. On the other hand, SEM images revealing ripped sections in the fabric suggest that plasma treatment induced severe changes in the morphology. In- terestingly, disruption of fiber bundles occurs at the intersection of crossing yarns. In addi- tion, ripping stretches over several yarns in a length of a few millimeters. However, the seemingly ripped fibers were not subjected to any stress and we assume that rupture in conventional sense did not take place. Instead, plasma exerted a more extensive etching effect on the fiber in certain points.
11
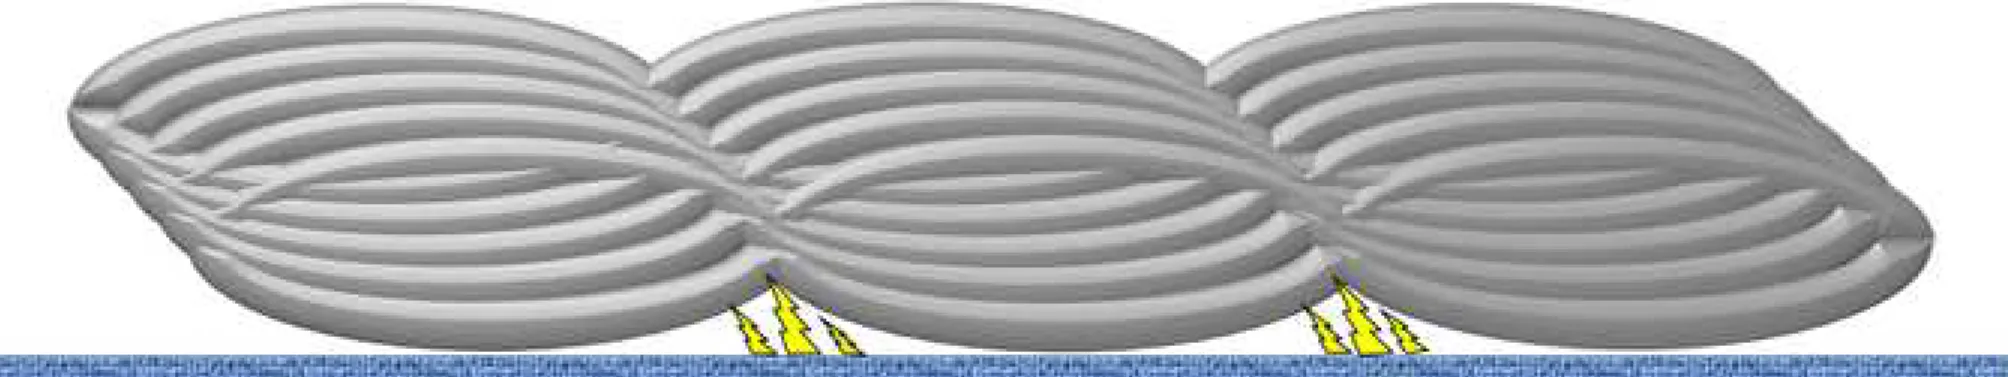
Etching commonly occurs during cold plasma treatments and its effect is manifested by changes in the roughness. However, these changes typically do not exceed a few hundred nanometers. Accordingly, AFM measurements showed that the roughness increased only slightly. In parallel, the fibers get gradually thinner close to the point of discontinuity but the surface roughness is not indicative for such concentrated, macroscopic scale etching. Photos and SEM images reveal that discontinuities are situated parallel to one another, occur invari- ably at yarn crossings, and their number increases with treatment time. Although it is diffi- cult to give a definite explanation for these observations, we assume that the discharges are more intensive and effective at yarn crossings. This is because tiny gaps may occur between the parallel yarns at the edges of crossing yarns leaving more space available for the dis- charges (Figure 13). Although extension of the plasma layer above the electrode is around 0.3-0.4 mm [59], we found that discharges are not generated on spots where the material directly touches the electrode plate or even the gap in between is less than a few tenths of millimeter. The DCSBD plasma is considered to yield quasi-homogenous plasma, however, unlike other designs (such as corona) the discharges are strictly parallel to each other (Fig- ure 14).
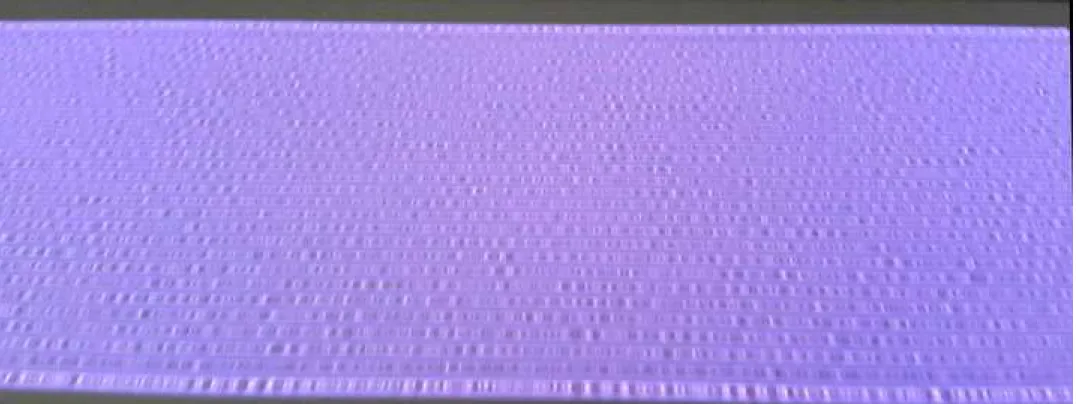
Figure 13. Schematic picture of plasma treatment of the PET fabric
Figure 14. The DCSBD plasma during operation
The parallel pattern of ruptures is most probably related to the direction of the discharges.
The detrimental effect of the ruptures on the mechanical properties of the fabric is clearly seen in Figure 10. The tensile strength of the fabric gradually decreases with respect to pro- longed treatment time and thus the increasing number of rupture. After 3 min of treatment, the tensile strength dropped to its half. It was reported earlier that harsh low-pressure plasma treatment resulted in greater degradation in the fiber and lead to a decreased tensile strength of the fabrics especially at high power and long exposure time [53][60]. However, regarding the mechanical properties of atmospheric plasma treated fibers, controversial findings were reported. In atmospheric pressure plasma, the active species have shorter mean free path and thus lower energies as compared to low pressure plasma [61]. This might be the explanation why atmospheric plasma left the fabrics unaffected in several stud- ies. In contrast, Hwang et al. reported on even a slight enhancement of the tensile strength [53], which could be attributed to the increasing interfiber and interyarn frictions developed due to the surface etching effect of the plasma [60]. Finally, deterioration of the mechanical
12
strength in presence of filamentary microdischarges due to weakening of the fibers was also suggested [61], although no evidence was provided for that.
5. Conclusions
In this work, we have studied the effect of DCSBD cold plasma treatment of PET fabric on its chemistry and morphology with respect to the length of treatment time. The wettability was rapidly increased by the DCSBD plasma treatment; however, a prolonged treatment did not enhance it further. XPS analysis showed that wettability is principally improved not by the higher number of polar groups or the formation of new polar groups on the surface, but much rather by the removal of adventitious carbon, which occurred within a short time.
While etching took place on the whole surface, it exerted increased degrading effect on cer- tain points on the fabric, typically at the edges of crossing yarns, where tiny gaps between parallel yarns on the woven pattern have formed. Degradation was more significant for pro- longed treatment time that resulted in discontinuity of the yarns in several points in the fab- rics. As a result the fabrics were gradually weakened in terms of tensile strength with respect to treatment time.
Considering some practical aspects of the results, we conclude that DCSBD plasma treatment is a very effective technique for increasing the wettability of PET fabrics in a continuous manner. However, prolonged treatment is not recommended since it does not significantly improve wettability any further but considerably weakens the mechanical properties.
Acknowledgements
This work was partially funded by the National Competitiveness and Excellence Program, Hungary (NVKP_16-1-2016-0007).
13 Captions to Figures
Figure 1. C1s, O1s and N1s photoelectron spectra of the untreated (upper row) and the 180 s plasma treated (lower row) PET samples. For the untreated sample, the CH component coin- cides with the adventitious carbon
Figure 2. Infrared spectra of PET fabric samples. Black: untreated, red: 30 s treated, blue:
180 s treated
Figure 3. Wetting time of PET fabric as a function of plasma treatment time Figure 4. Effect of plasma treatment time on the water wicking rate of PET fabric
Figure 5. Optical images of untreated, respectively 30, 120 and 180 s plasma treated PET fabric samples
Figure 6. SEM pictures of untreated, respectively 30 and 180 s plasma treated PET fabric samples
Figure 7. SEM pictures of the failures attributed to 3 min plasma etching in two different magnifications
Figure 8. Representative side view (0°) height maps of untreated, respectively 30 s plasma- treated samples scanned in two scan sizes. Note that the height scale range is 160 nm for all images
Figure 9. Roughness parameters (Rq, Ra, Rmax) of the PET fibres before (black) and after (red) a 30 s plasma treatment measured on 4 (upper row), respectively 64 μm2 areas (lower row).
Boxplot statistics representing the 25, 50 and 75% percentiles in the box, 1 and 99% percen- tiles as the whiskers and means as squares
Figure 10. Skewness and kurtosis parameters (Ssk, Sku) of the PET fibers before (black) and after (red) a 30 s plasma treatment measured on 4 μm2 areas
Figure 11. Tensile properties of the PET fabric as a function of treatment time
Figure 12. Change of the surface chemical composition of PET samples during plasma treat- ment. Composition of the untreated sample is corrected for the adventitious carbon [28]
Figure 13. Schematic picture of plasma treatment of the PET fabric Figure 14. The DCSBD plasma during operation
14 References
[1] G. Borcia, C.A. Anderson, N.M.D. Brown, Surface treatment of natural and synthetic textiles using a dielectric barrier discharge, Surf. Coatings Technol. 201 (2006) 3074–
3081. doi:10.1016/j.surfcoat.2006.06.021.
[2] F. Leroux, A. Perwuelz, C. Campagne, N. Behary, Atmospheric air-plasma treatments of polyester textile structures, J. Adhes. Sci. Technol. 20 (2006) 939–957.
doi:10.1163/156856106777657788.
[3] L.S. Penn, H. Wang, Chemical modification of polymer surfaces: a review, Polym. Adv.
Technol. 5 (1994) 809–817. doi:10.1002/pat.1994.220051207.
[4] C.M. Chan, T.M. Ko, H. Hiraoka, Polymer surface modification by plasmas and photons, Surf. Sci. Rep. 24 (1996) 1–54. doi:10.1016/0167-5729(96)80003-3.
[5] S. S. Muthu, Textiles and Clothing Sustainability Nanotextiles and Sustainability, Springer, Singapore, 2017.
[6] L. Bárdos, H. Baránková, Cold atmospheric plasma: Sources, processes, and
applications, Thin Solid Films. 518 (2010) 6705–6713. doi:10.1016/j.tsf.2010.07.044.
[7] T. Desmet, R. Morent, N. De Geyter, C. Leys, E. Schacht, P. Dubruel, Nonthermal plasma technology as a versatile strategy for polymeric biomaterials surface modification: A review, Biomacromolecules. 10 (2009) 2351–2378.
doi:10.1021/bm900186s.
[8] A. Haji, M. Naebe, Cleaner dyeing of textiles using plasma treatment and natural dyes:
A review, J. Clean. Prod. 265 (2020)121866. doi.:10.1016/j.jclepro.2020.121866 [9] C. Borcia, I.L. Punga, G. Borcia, Surface properties and hydrophobic recovery of
polymers treated by atmospheric-pressure plasma, Appl. Surf. Sci. 317 (2014) 103–
110. doi:10.1016/j.apsusc.2014.08.066.
[10] J. Lai, B. Sunderland, J. Xue, S. Yan, W. Zhao, M. Folkard, B.D. Michael, Y. Wang, Study on hydrophilicity of polymer surfaces improved by plasma treatment, Appl. Surf. Sci.
252 (2006) 3375–3379. doi:10.1016/j.apsusc.2005.05.038.
[11] E. Gogolides, V. Constantoudis, G. Kokkoris, D. Kontziampasis, K. Tsougeni, G.
Boulousis, M. Vlachopoulou, A. Tserepi, Controlling roughness: from etching to
nanotexturing and plasma-directed organization on organic and inorganic materials, J.
Phys. D. Appl. Phys. 44 (2011) 174021. doi:10.1088/0022-3727/44/17/174021.
[12] T. Schuman, R.A. Wolf, Effects of a DBD plasma discharge on bond strength, Surf.
Interfaces. 18 (2020). doi:10.1016/j.surfin.2020.100461
[13] M. Parvinzadeh, J. Willoughby, P. Agrawal, Surface and Bulk Modification of Synthetic Textiles to Improve Dyeability, Text. Dye. (2012). doi:10.5772/18706.
[14] G. Poletti, F. Orsini, A. Raffaele-Addamo, C. Riccardi, E. Selli, Cold plasma treatment of PET fabrics: AFM surface morphology characterisation, Appl. Surf. Sci. 219 (2003) 311–
316. doi:10.1016/S0169-4332(03)00703-7.
15
[15] F. Palumbo, C. Lo Porto, P. Favia, Plasma Nano-Texturing of Polymers for Wettability Control: Why, What and How, Coatings. 9 (2019) 640. doi:10.3390/coatings9100640.
[16] J.H. Oh, T.J. Ko, M.W. Moon, C.H. Park, Nanostructured fabric with robust
superhydrophobicity induced by a thermal hydrophobic ageing process, RSC Adv. 7 (2017) 25597–25604. doi:10.1039/c7ra03801a.
[17] M.O.H. Cioffi, H.J.C. Voorwald, R.P. Mota, Surface energy increase of oxygen-plasma- treated PET, Mater. Charact. 50 (2003) 209–215. doi:10.1016/S1044-5803(03)00094- 9.
[18] C. Cheng, Z. Liye, R.J. Zhan, Surface modification of polymer fibre by the new
atmospheric pressure cold plasma jet, Surf. Coatings Technol. 200 (2006) 6659–6665.
doi:10.1016/j.surfcoat.2005.09.033.
[19] P. Esena, C. Riccardi, S. Zanini, M. Tontini, G. Poletti, F. Orsini, Surface modification of PET film by a DBD device at atmospheric pressure, Surf. Coatings Technol. 200 (2005) 664–667. doi:10.1016/J.SURFCOAT.2005.02.188.
[20] J. Lv, Q. Zhou, T. Zhi, D. Gao, C. Wang, Environmentally friendly surface modification of polyethylene terephthalate (PET) fabric by low-temperature oxygen plasma and carboxymethyl chitosan J. Clean. Prod. 118 (2016)187-196.
doi:10.1016/j.jclepro.2016.01.058.
[21] A. Vesel, I. Junkar, U. Cvelbar, J. Kovac, M. Mozetic, Surface modification of polyester by oxygen- And nitrogen-plasma treatment, Surf. Interface Anal. 40 (2008) 1444–
1453. doi:10.1002/sia.2923.
[22] R. Morent, N. De Geyter, J. Verschuren, K. De Clerck, P. Kiekens, C. Leys, Non-thermal plasma treatment of textiles, Surf. Coatings Technol. 202 (2008) 3427–3449.
doi:10.1016/j.surfcoat.2007.12.027.
[23] K. Chi-wai, C. Kwong, M.Y. Chun-wah, The possibility of low-temperature plasma treated wool fabric for industrial use, Autex Res. J. 4 (2004) 37–44.
[24] M.G. McCord, Y.J. Hwang, P.J. Hauser, Y. Qiu, J.J. Cuomo, O.E. Hankins, M.A. Bourham, L.K. Canup, Modifying nylon and polypropylene fabrics with atmospheric pressure plasmas, Text. Res. J. 72 (2002) 491–498. doi:10.1177/004051750207200605.
[25] R. Zhongfu, T. Xiaoliang, W. Hong’en, Q. Gao, Continuous modification treatment of polyester fabric by Ar-O2 (10:1) discharge at atmospheric pressure, J. Ind. Text. 37 (2007) 43–53. doi:10.1177/1528083707078082.
[26] C. Jensen, C. Zhang, Y. Qiu, The aging of atmospheric plasma-treated ultrahigh- modulus polyethylene fibers, Compos. Interfaces. 10 (2003) 277–285.
doi:10.1163/156855403765826919.
[27] L. Románszki, S. Klébert, K. Héberger, Estimating Nanoscale Surface Roughness of Polyethylene Terephthalate Fibers, ACS Omega. 5 (2020) 3670–3677.
doi:10.1021/acsomega.9b04211.
16
[28] E.S. Gadelmawla, M.M. Koura, T.M.A. Maksoud, I.M. Elewa, H.H. Soliman, Roughness parameters, J. Mater. Process. Technol. 123 (2002) 133–145. doi:10.1016/S0924- 0136(02)00060-2.
[29] Ș. Țălu, Micro and nanoscale characterization of three dimensional surfaces. Basics and applications. Napoca Star Publishing House: Cluj-Napoca, Romania, 2015.
[30] M. Mohai, XPS MultiQuant: multimodel XPS quantification software, Surf. Interface Anal. 36 (2004) 828–832. doi:10.1002/sia.1775.
[31] S. Evans, R.G. Pritchard, J.M. Thomas, Relative differential subshell photoionisation cross-sections (MgKα) from lithium to uranium, J. Electron Spectros. Relat.
Phenomena. 14 (1978) 341–358. doi:10.1016/0368-2048(78)80008-5.
[32] R.F. Reilman, A. Msezane, S.T. Manson, Relative intensities in photoelectron spectroscopy of atoms and molecules, J. Electron Spectros. Relat. Phenomena. 8 (1976) 389–394. doi:10.1016/0368-2048(76)80025-4.
[33] Mohai M, Bertóti I, Correction for surface contaminations in XPS: A practical
approach, In: Mathieu HJ, Reihl B, Briggs D (eds.) ECASIA 95, pp. 675–678, John Willey
& Sons, Chichester, 1996.
[34] AATCC Test Method 79–2000, Absorbency of bleached textiles, American Association of Tex-tile Chemists and Colorists
[35] E. Kissa, Wetting and Wicking, Text. Res. J. 66 (1996) 660–668.
doi:10.1177/004051759606601008.
[36] E. Csiszar, Surface properties and residual chromophore content of differently pretreated linen fabrics, Text. Res. J. 82 (2012) 2030–2040.
doi:10.1177/0040517512444329.
[37] Beamson G, Briggs D, High resolution XPS of organic polymers: The Scienta ESCA300 Data-base, John Wiley & Sons, Chichester, 1992 doi:10.1021/ed070pa25.5.
[38] M. Mohai, I. Bertóti, Calculation of overlayer thickness on curved surfaces based on XPS intensities, Surf. Interface Anal. 36 (2004) 805–808. doi:10.1002/sia.1769.
[39] A.P. Dos Santos Pereira, M.H.P. Da Silva, É.P. Lima, A. Dos Santos Paula, F.J.
Tommasini, Processing and characterization of PET composites reinforced with geopolymer concrete waste, Mater. Res. 20 (2017) 411–420. doi:10.1590/1980-5373- MR-2017-0734.
[40] B.J. Holland, J.N. Hay, The thermal degradation of poly(vinyl acetate) measured by thermal analysis-Fourier transform infrared spectroscopy, Polymer (Guildf). 43 (2002) 2207–2211. doi:10.1016/S0032-3861(02)00038-1.
[41] G.Socrates, Infrared and Raman Characteristic Group Frequencies: Tables and Charts, 3rd Edition, Wiley, https://www.wiley.com/en.
[42] J. Friedrich, The Plasma Chemistry of Polymer Surfaces: Advanced Techniques for Surface Design, John Wiley and Sons, Weinheim, Germany, 2012.
17 doi:10.1002/9783527648009.
[43] L. Románszki, M. Mohos, J. Telegdi, L. Nyikos, Contact angle measurement is an efficient tool for the characterization of corrosion protection nanolayers on copper alloys and stainless steel, Proceedings of the International Conference Nanomaterials:
Applications and Proper-ties, 2013, 2, Paper 01PCSI04.
http://nbuv.gov.ua/UJRN/princon_2013_2_1_47
[44] O.E. Szabo, E. Csiszar, B. Koczka, A. Toth, S. Klebert, Enhancing the accessibility of starch size and cellulose to enzymes in raw cotton woven fabric by air-plasma pretreatment, Text. Res. J. 86 (2016) 868–877. doi:10.1177/0040517515599739.
[45] H.B. Mann, D.R. Whitney, On a test of whether one of two random variables is stochastically larger than the other, Ann. Math. Stat. 18 (1947) 50–60.
doi:10.1214/AOMS/1177730491.
[46] H. Al-Maliki, L. Zsidai, P. Samyn, Z. Szakál, R. Keresztes, G. Kalácska, Effects of
atmospheric plasma treatment on adhesion and tribology of aromatic thermoplastic polymers, Polym. Eng. Sci. 58 (2018) E93–E103. doi:10.1002/pen.24689.
[47] J. Vasiljević, M. Gorjanc, B. Tomšič, B. Orel, I. Jerman, M. Mozetič, A. Vesel, B.
Simončič, The surface modification of cellulose fibres to create super-hydrophobic, oleophobic and self-cleaning properties, Cellulose. 20 (2013) 277–289.
doi:10.1007/s10570-012-9812-3.
[48] B. Paosawatyanyong, K. Kamlangkla, S.K. Hodak, Hydrophobic and hydrophilic surface nano-modification of PET fabric by plasma process, in: J. Nanosci. Nanotechnol., 2010:
pp. 7050–7054. doi:10.1166/jnn.2010.2849.
[49] N.W.M. Edwards, E.L. Best, S.D. Connell, P. Goswami, C.M. Carr, M.H. Wilcox, S.J.
Russell, Role of surface energy and nano-roughness in the removal efficiency of bacterial contamination by nonwoven wipes from frequently touched surfaces, Sci.
Technol. Adv. Mater. 18 (2017) 197–209. doi:10.1080/14686996.2017.1288543.
[50] L.N.B. Wen Yu Wang, Xin Jin, Bo Wang, Effects of oxygen-plasma treatment time on the properties of UHMWPE fiber, Adv. Mater. Res. 781–784 (2013) 2605–2608.
https://www.scientific.net/AMR.781-784.2605 (accessed April 11, 2020).
[51] V. Takke, N. Behary, A. Perwuelz, C. Campagne, Studies on the atmospheric air-plasma treatment of PET (polyethylene terephtalate) woven fabrics: Effect of process
parameters and of aging, J. Appl. Polym. Sci. 114 (2009) 348–357.
doi:10.1002/app.30618.
[52] A. Jordá-Vilaplana, V. Fombuena, D. García-García, M.D. Samper, L. Sánchez-Nácher, Surface modification of polylactic acid (PLA) by air atmospheric plasma treatment, Eur. Polym. J. 58 (2014) 23–33. doi:10.1016/j.eurpolymj.2014.06.002.
[53] Y.J. Hwang, M.G. McCord, B.C. Kang, Helium/oxygen atmospheric pressure plasma treatment on poly(ethylene terephthalate) and poly(trimethylene terephthalate) knitted fabrics: Comparison of low-stress mechanical/surface chemical properties, Fibers Polym. 6 (2005) 113–120. doi:10.1007/BF02875601.
18
[54] K. Gotoh, A. Yasukawa, Y. Kobayashi, Wettability characteristics of poly(ethylene terephthalate) films treated by atmospheric pressure plasma and ultraviolet excimer light, Polym. J. 43 (2011) 545–551. doi:10.1038/pj.2011.20.
[55] M. Strobel, C.S. Lyons, The role of low-molecular-weight oxidized materials in the adhesion properties of corona-treated polypropylene film, J. Adhes. Sci. Technol. 17 (2003) 15–23. doi:10.1163/15685610360472411.
[56] Z. Károly, G. Kalácska, J. Sukumaran, D. Fauconnier, Á. Kalácska, M. Mohai Sz. Klébert, Effect of Atmospheric Cold Plasma Treatment on the Adhesion and Tribological Properties of Polyamide 66 and Poly (Tetrafluoroethylene), Materials, 12 (2019) 658 doi: 10.3390/ma12040658
[57] Z. Károly, G. Kalácska, L. Zsidai, M. Mohai, Sz. Klébert, Improvement of Adhesion Properties of Polyamide 6 and Polyoxymethylene-Copolymer by Atmospheric Cold Plasma Treatment, Polymers, 10(12), 1380 (2018), doi: 10.3390/polym10121380 [58] L. Gou, C. Campagne, A. Perwuelz, F. Leroux, Zeta Potential and Surface Physico-
chemical Properties of Atmospheric Air-plasma-treated Polyester Fabrics, Text. Res. J.
79 (2009) 1371–1377. doi: 10.1177/0040517509103950
[59] V. Stepanova, J. Kelar, O. Galmiz, M. Zemanek, P. Slavicek, A. Bucek, M. Cernak, Areal homogeneity verification of plasma generated by diffuse coplanar surface barrier discharge in ambient air at atmospheric pressure, Contrib. to Plasma. Phys. 57 (2017) 182-189 doi: 10.1002/ctpp.201600093
[60] D. Ferrante, S. Iannace, T. Monetta, Mechanical strength of cold plasma treated PET fibers, J. Mater. Sci. 34 (1999) 175–179. doi:10.1023/A:1004467002761.
[61] Roth JR, Industrial Plasma Engineering, Vol. II. Applications to Nonthermal Plasma Pro- cessing, Bristol, Institute of Physics Publishing, Philadelphia, 2001.
[62] K.K. Samanta, M. Jassal, A.K. Agrawal, Improvement in water and oil absorbency of textile substrate by atmospheric pressure cold plasma treatment, Surf. Coatings Technol. 203 (2009) 1336–1342. doi:10.1016/j.surfcoat.2008.10.044.
19 Appendix
Sz. Klébert, S. Tilajka, L. Románszki, M. Mohai, E. Csiszár, Z. Károly:
Degradation phenomena on atmospheric air plasma treatment of polyester fabrics.
Details of the XPS data processing
Spectral processing was performed by the Kratos Vision 2 data system.
The scheme of the peak decomposition based on the literature data of PET [37], which was recorded by higher spectral resolution than our spectra. Shirley type background and Gauss- ian-Lorenzian peak shape with 70:30 ratio were applied.
Although the Rayleigh criterion for the peak resolution is not fulfilled by all component pairs, the shape of the composite peak, together with the literature data, suggest the applied posi- tions of the components. The peak positions were constrained around the literature values but the constrain window was relatively wide, comparing to the actual variation of peak po- sitions (none of the components was limited by the set values). Switching of the constrains would not have significantly change the results. Furthermore, the quantitative composition of the untreated sample is close to the theoretical one, which confirms the applied scheme.
The full width at half maximum (FWHM) values of the peaks were constrained according to the expected spectral resolution, measured on Au and Ag standard materials with same spectrometer settings.
Detailed data of the peak decomposition are enumerated in Tables A1, A2 and A3.
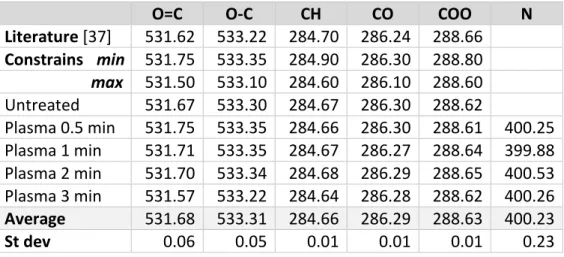
Table A1 Positions of the components (eV) of the decomposed XPS lines and the applied con- strains used for parameter fitting.
O=C O-C CH CO COO N
Literature [37] 531.62 533.22 284.70 286.24 288.66 Constrains min 531.75 533.35 284.90 286.30 288.80 max 531.50 533.10 284.60 286.10 288.60 Untreated 531.67 533.30 284.67 286.30 288.62 Plasma 0.5 min 531.75 533.35 284.66 286.30 288.61 400.25 Plasma 1 min 531.71 533.35 284.67 286.27 288.64 399.88 Plasma 2 min 531.70 533.34 284.68 286.29 288.65 400.53 Plasma 3 min 531.57 533.22 284.64 286.28 288.62 400.26 Average 531.68 533.31 284.66 286.29 288.63 400.23
St dev 0.06 0.05 0.01 0.01 0.01 0.23
20
Table A2 Full width at half maximum (FWHM) values (eV) of the components of the decom- posed XPS lines and the applied constrains used for parameter fitting.
O=C O-C CH CO COO N
Constrains min 1.70 1.70 1.70 1.70 1.70
max 2.00 2.00 1.90 1.90 1.90
Untreated 1.90 1.91 1.86 1.81 1.80
Plasma 0.5 min 1.99 1.99 1.85 1.89 1.89 2.19
Plasma 1 min 1.98 2.00 1.84 1.85 1.90 2.20
Plasma 2 min 2.00 1.99 1.84 1.85 1.90 2.19
Plasma 3 min 1.99 1.99 1.85 1.86 1.90 2.20
Average 1.97 1.98 1.85 1.85 1.88 2.19
St dev 0.04 0.03 0.01 0.03 0.04 0.00
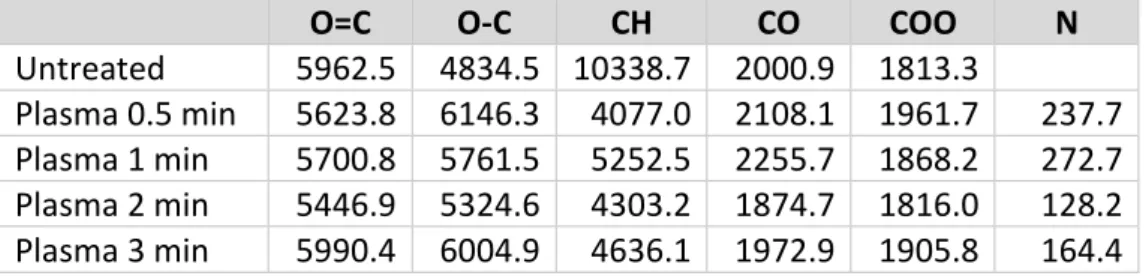
Table A3 The raw integral intensity (cps) of the components of the decomposed XPS lines af- ter Shirley type background subtraction.
O=C O-C CH CO COO N
Untreated 5962.5 4834.5 10338.7 2000.9 1813.3 Plasma 0.5 min 5623.8 6146.3 4077.0 2108.1 1961.7 237.7 Plasma 1 min 5700.8 5761.5 5252.5 2255.7 1868.2 272.7 Plasma 2 min 5446.9 5324.6 4303.2 1874.7 1816.0 128.2 Plasma 3 min 5990.4 6004.9 4636.1 1972.9 1905.8 164.4
Quantitative correction for the adventitious carbon contamination was performed by the method of Mohai [33]; the approximation of the thickness of the contaminant layer by ap- plying the Layers-on-Cylinder geometry model [38], using the XPS MultiQuant program [31].
Inelastic mean free path data of the system were calculated by the TPP-2M formula [R1].
Literature
31. M. Mohai, XPS MultiQuant: multimodel XPS quantification software, Surf. Interface Anal.
36 (2004) 828–832. doi:10.1002/sia.1775. http://aki.ttk.hu/XMQpages/
33. Mohai M, Bertóti I, Correction for surface contaminations in XPS: A practical approach, In: H.J. Mathieu, B. Reihl, D. Briggs (eds.) ECASIA 95, pp. 675–678, John Willey & Sons, Chichester, 1996.
37. G. Beamson, D. Briggs, High resolution XPS of organic polymers: The Scienta ESCA300 Data-base, John Wiley & Sons, Chichester,1992.
38. M. Mohai, I. Bertóti, Calculation of overlayer thickness on curved surfaces based on XPS intensities, Surf. Interface Anal. 36 (2004) 805–808. doi:10.1002/sia.1769.
R1. S. Tanuma, C. J. Powell, D. R. Penn: Calculations of Electron Inelastic Mean Free Paths. 5.
Data for 14 Organic-Compounds Over the 50-2000 eV Range, Surf. Interface Anal. 21 (1994) 165.
Click here to access/download;Figure;Fig 1.jpg
Click here to access/download;Figure;Fig 2.jpg
Click here to access/download;Figure;Fig 3.jpg
Click here to access/download;Figure;Fig 4.jpg
Click here to access/download;Figure;Fig 5.tif
Click here to access/download;Figure;Fig 6.tif
Click here to access/download;Figure;Fig 7.tif
Click here to access/download;Figure;Fig 8.tif
Click here to access/download;Figure;Fig 9.tif
Figure 11 Click here to access/download;Figure;Fig 11.jpg
Figure 12 Click here to access/download;Figure;Fig 12.jpg
Figure 13 Click here to access/download;Figure;FIg 13.tif
Figure 14 Click here to access/download;Figure;Fig 14.jpg
Figure 10 Click here to access/download;Figure;Fig10.jpg