Contents lists available atScienceDirect
Environment International
journal homepage:www.elsevier.com/locate/envint
Exposure to indoor air contaminants in school buildings with and without reported indoor air quality problems
Camilla Vornanen-Winqvist
a,⁎, Kati Järvi
a, Maria A. Andersson
a, Caroline Duchaine
b,c, Valérie Létourneau
c, Orsolya Kedves
d, László Kredics
d, Raimo Mikkola
a, Jarek Kurnitski
a,e, Heidi Salonen
aaAalto University, Department of Civil Engineering, PO Box 12100, FI-00076 Aalto, Finland
bUniversité Laval, Département de Biochimie, de Microbiologie et de Bio-informatique, 2325, rue de l'Université, Québec G1V 0A6, Canada
cCentre de Recherche de l’Institut Universitaire de Cardiologie et de Pneumologie de Québec, 2725, chemin Sainte-Foy, Québec G1V 4G5, Canada
dUniversity of Szeged, Faculty of Science and Informatics, Department of Microbiology, Közép fasor 52, H-6726 Szeged, Hungary
eTallinn University of Technology, Department of Civil Engineering and Architecture, Ehitajate tee 5, 19086 Tallinn, Estonia
A R T I C L E I N F O
Handling Editor: Hefa Cheng Keywords:
Indoor air quality School Trichoderma Microbes
Online questionnaire
A B S T R A C T
Reported indoor air quality (IAQ) complaints are common even in relatively new or renovated school buildings in Finland. However, detecting the causes for complaints with commonly used indoor air measurements is difficult. This study presents data on perceived and measured IAQ in six comprehensive school buildings in Finland. The aim of this study was to discover the possible differences of perceived and measured IAQ between schools with reported IAQ complaints and schools without reported IAQ complaints. The initial categorisation of schools with (‘problematic schools’) and without (‘comparison schools’) complaints was ensured via a validated indoor climate survey and a recently developed online questionnaire, which were completed by 186 teachers and 1268 students from the six schools. IAQ measurements of physical parameters, gaseous pollutants, particulate matter and bioaerosols were conducted in four problematic school buildings (26 classrooms) and two com- parison school buildings (12 classrooms). Using air sampling as well as exhaust airfilters and classroom settled dust to detect the presence of elevated concentrations of airborne cultivable microbes and pathogenic, toxigenic and mycoparasiticTrichodermastrains were the most indicative methods in distinguishing problematic schools from comparison schools. Other IAQ-related measurements did not detect clear differences between problematic and comparison schools, as the concentration levels were very low. The results indicate that the complaints reported by occupants could have been related to excess moisture or mould problems that had not been found or repaired. Ventilation pressure condition investigations and simultaneous exhaust and supply airfilter dust culture should be addressed precisely in future studies.
1. Introduction
Schools are places with a high level of activity and population density of children, where different pollutants from both indoor and outdoor sources may be introduced and persist for a long time (Chithra and Nagendra 2018). Additionally, school buildings are often char- acterised by infrequent interventions for building maintenance and environmental remediation (Theodosiou and Ordoumpozanis 2008, Ruggieri et al. 2019).
Indoor air quality (IAQ) in school buildings is characterised by various pollutants, such as volatile organic compounds (VOCs), alde- hydes, particulate matter (PM2.5 and PM10), fungi and bacteria
(Madureira et al. 2009, Salonen et al. 2015, Madureira et al. 2012).
Relationships between specific indoor exposures—even at low le- vels—and the development or exacerbation of respiratory symptoms and asthma have been shown among allergic persons, in particular, and individuals who have not been sensitised before (Madureira et al. 2009, Madureira et al. 2015, Kanchongkittiphon et al. 2015). In addition to occurring indoor air pollutants, indoor environmental conditions and contributors such as high temperature, low relative humidity and the ventilation quality strongly affect IAQ and may cause or contribute to health effects and affect the comfort in indoor environment (Turunen et al. 2014, Mendell and Mirer 2009, Lan et al. 2011, Torresin et al.
2018).
https://doi.org/10.1016/j.envint.2020.105781
Received 18 October 2019; Received in revised form 17 April 2020; Accepted 30 April 2020
⁎Corresponding author.
E-mail address:camilla.vornanen@aalto.fi(C. Vornanen-Winqvist).
0160-4120/ © 2020 The Authors. Published by Elsevier Ltd. This is an open access article under the CC BY-NC-ND license (http://creativecommons.org/licenses/BY-NC-ND/4.0/).
T
Children are more susceptible to the effects of air contaminants than adults, due to their immature immune and respiratory system, inferior body mass index and breathing pattern (Yassin and Pillai 2018, Chithra and Nagendra 2018, WHO 2006, Mendell and Heath 2005, Faustman et al. 2000). As a result of the time spent in schools, indoor environ- mental conditions are among the major contributors of total exposure for children to various air pollutants (Lai et al. 2015, Sheehan et al.
2012, Jacobs et al. 2013, Yassin and Pillai 2018, Bennett et al. 2019, Salthammer et al. 2016).
In addition to the increased chance of long- and short-term health problems for students and staff, air pollutants and poor IAQ reduce children’s school attendance, academic performance (Mendell and Heath 2005, Annesi-Maesano et al. 2013) and comfort level (Chithra and Nagendra 2018). They also reduce teachers’productivity and in- crease sick leaves (Ervasti et al. 2012, Chithra and Nagendra 2018).
Thus, the characterisation of different indoor air pollutants and their effects on measured and perceived IAQ in school environments is of critical public health concern, given the potential long-term adverse consequences of the exposures. However, the available IAQ data from school buildings regarding the characterisation of simultaneously oc- curred pollutants and situation-related perceived disadvantage and symptom mapping are limited. For example, studies regarding IAQ in Finnish comprehensive schools typically focused on microbial in- vestigations (Peitzsch et al. 2012, Haverinen-Shaughnessy et al. 2012, Meklin et al. 2005, Husman et al. 2002), and none have collected wide, simultaneous data of perceived and measured IAQ in the Helsinki me- tropolitan area.
The aim of the present study was to conduct a comprehensive characterisation of the IAQ in school buildings with and without re- ported IAQ complaints and detect measurable differences between the buildings. Occupants’perceptions were recorded to ensure the initial categorisation of buildings with and without perceived IAQ problems.
Characterisation was done by measuring ventilation, physical para- meters and the above-mentioned main air pollutants: gaseous pollu- tants, particulate matter, and indoor microbiota, focusing on toxigenic, mycoparasitic and potentially pathogenic moulds.
2. Material and methods
2.1. Study design and school characteristics
The present study was conducted as part of Finnish research projects (EURA, TOXICPM and Indoor Air Police) investigating the chemical, physical and microbiological IAQ in comprehensive school buildings.
The study was carried out at six public schools in the Helsinki me- tropolitan area—two schools in Helsinki (P4 and C6) and four schools in Vantaa (P1, P2, P3 and C5). The suitable buildings were selected with the help of indoor air specialists from Real Estate Centre of Vantaa and Built Assets Management of City of Helsinki, as officials responsible for building and IAQ problem management and for ensuring proper
working environment for the employees and students. Four of the se- lected buildings were designated as‘problematic schools’(P1–P4) and two were comparison schools (C5 and C6) based on the occupants’IAQ complaints or lack of complaints, respectively, received by the indoor air specialists and work health personnel.
The indoor air specialists and the experts they consult from several fields had the best knowledge of the buildings under study since they had controlled all the information related to, for example, maintenance and repair actions, IAQ investigations, building technology data and problem reports, as well as IAQ questionnaire and work place in- vestigation reports implemented by occupational health. The com- plaints from the schools were reported directly or via occupational health care personnel to them. Therefore, the information about the buildings' perceived and measured problems received from the indoor air specialists of the two cities was accurate and reliable for this study and was also confirmed by each school's principal.
Complaints had been received by the indoor air specialists and oc- cupational health personnel from the problematic schools for at least one to two years. They included, for example, perceptions of poor, stuffy and warm air, dust, bad odours, headaches, nausea, skin symp- toms, and respiratory symptoms, such as dry cough, hoarseness, stuffy nose or dry throat. Seasonal and psychosocial factors affect the per- ceptions of symptoms and discomfort, but in these buildings the variety of symptoms, inconvenience, and their continuation over a long period of time suggested other causes for the symptoms. According to the in- door air specialists, several investigations and ventilation, sealing and structural repairs had been conducted in these buildings over the past few years; however, complaints continued and a clear reason for oc- cupants’perceptions had not been found. Thus, the selected proble- matic schools were considered buildings with prolonged, unsolved IAQ problems. Comparison schools were selected because there were no IAQ-related complaints and no existing repair needs, or work health issues were known by the school principals or indoor air specialists.
Before the study began, school personnel and parents were informed about the aims of this study and whether their school was categorized as problematic or was a comparison school.
The number of studied buildings was determined by the number of suitable schools that were available for the study and by project re- sources. Since the circumstances in the problematic schools were the focus of this study, the lower number of comparison schools was ac- cepted. In addition to comparison schools, the available decrees on indoor conditions and recommended limit values provided reference information of good or acceptable indoor conditions, however, not re- placing the valuable information from real school environments.
All schools were in urban population centres approximately 20–50 m from main traffic routes, but not in direct proximity of heavy traffic. School C6 was the nearest building to busy city routes. Sparse forest cover or plants existed in all the school areas. The study was conducted between October 2016 and March 2017, that is, during the winter season. Meteorological conditions of the various schools during
Table 1
Information on the studied schools.
School Approx. no. of students
No. of employees
Year of construction Year of renovation
Type of ventilation Measurement period Median outdoor T (°C) *
Median outdoor RH(%)*
P1 840 79 2006 – mv 7.−21.11.2016 −1.4 93
P2 840 75 2006 – mv 21.11.−7.12.2016 −0.2 91
P3 680 56 1968, extension 2002 2003–2005 mv 30.1.−13.2.2017 −2.4 89
P4 700 74 2009 – mv (classroom 6f), nv
(6a-6e)
6.−20.3.2017 0.8 88
C5 570 68 1980s, extension
2013–2014
– mv 24.10.−7.11.2016 1.2 85
C6 800 40 1955 2010–2012 mv 16.−30.1.2017 0.2 94
P: problematic building (reported indoor air complaints); C: comparison building (no reported indoor air complaints); mv: mechanical supply and extract ventilation;
nv: fan-assisted natural ventilation; *outdoor temperature (T) and relative humidity (RH) during the measurement period.
the measurement periods were comparable (median temperature from
−1.4 °C to 1.2 °C and median relative humidity from 85% to 94%), as shown in Table 1, therefore not causing bias in the result analysis.
Primary and upper comprehensive school education was given in the buildings, mainly from grades one to nine. Information on the studied schools is presented inTable 1.
From each school, six classrooms (a–f, later combined with the number of the school) were selected for the study by the school prin- cipals and personnel. In school P2, however, two additional classrooms (2 g and 2 h) were studied. The studied classrooms presented a com- prehensive sample of indoor spaces from each building and could be studied simultaneously within the project's device and time resources.
Classrooms were selected from different floors and sections of the schools. Locations of the studied classrooms in the layouts of the school buildings are presented inFig. S1in thesupplementary material.
Principals were asked to select classrooms that were the most oc- cupied during the school week and that the students taught in the classrooms would be from grades seven to nine (upper comprehensive school) to be mature enough to answer the online questionnaire. In addition, most of the selected classrooms complied with the request that any special emitting materials (arts, physics and chemistry) would not be used in the classrooms, with few exceptions, which have been noted in result analyses.
In problematic schools, the classrooms associated with the most severe reported indoor air problems were selected. The principals made these selections because they had the best viewpoint of the school's overall circumstances, perceived problems, previously conducted in- vestigations and user questionnaires, and reports from the occupational and school healthcare in use. In all problematic schools, the escalated situation of prolonged and numerous complaints of perceived and un- resolved IAQ problems negatively affected the working environment.
Therefore, the personnel and principals had a strong will to contribute in studies providing new information about such difficult cases and tended to select the most problematic classrooms for this study.
Association between school's IAQ problems and student-perceived so- cial climate and the psychosocial atmosphere of the work community have been shown in previous studies (Finell et al. 2018, Lahtinen et al.
2002).
In the comparison schools, principals selected some classrooms in which some IAQ-related discomfort, such as too warm or stuffy air, had occurred. This classroom selection might have weakened the distinction between problematic and comparison schools. However, problems in comparison schools were not considered as frequent or as severe as in the problematic schools, thus the classrooms presented a ‘normal’
school environment at an acceptable level.
Although surface cleaning was done daily in those classrooms in- volved in the study, the daily classroom cleaning was not performed for four days before the measurement period. Since measurements were made on Mondays, classrooms were not to be cleaned after Thursday. In the ‘walk-through’ inspection prior to the sampling, the classrooms appeared clean and no visible sand, dust or other dirt could be seen on thefloors, although mice excrement was observed in classrooms 3a and 3b. Dust on upper surfaces was common in all studied schools.
Surface materials in all the classrooms included plasticflooring as well as painted walls and ceilings. There were no animals or visible moisture or mould inside the classrooms. Visible sources for man-made vitreousfibres could be seen in the ceiling structures of classrooms 6a and 3c. Air cleaners were in use in classrooms 1e, 2b, 3c and 4a, but, according to teachers, were kept offduring the measurement period.
2.2. Indoor climate questionnaires 2.2.1. Questionnaire for the employees
Employees’indoor air-related discomfort and symptoms, which had occurred during the past three months in the work environment, were recorded with the validated and frequently used indoor climate survey
of the Finnish Institute of Occupational Health (FIOH) in January 2017.
The survey is based on the Örebro (MM40) Indoor Climate Ques- tionnaire (Andersson 1998). Occupants working throughout the schools were asked to participate during the two weeks allotted for responses.
The schools’ principals were responsible for delivering the ques- tionnaires, while the FIOH collected and reported the answers.
Results presented in this study were based on the school-specific indoor climate survey reports received from the FIOH. In the reports, results (percentage of respondents reporting an occurrence of a certain symptom or work environment factor) were compared to reference data collected from 122 office and healthcare workplaces in Finland (Reijula and Sundman-Digert 2004, Hellgren 2008), presenting IAQ in a
‘normal’working environment. However, it must be noted that schools have some differences from those environments in, for example, noi- siness and ventilation sufficiency. Additionally, the psychosocial load or other factors related to work environment or personal conditions can worsen the perceptions of IAQ (Runeson-Broberg and Norbäck 2013, Lahtinen et al. 2004); therefore, the questionnaire surveys work-related stress (i.e., tasks, responsibilities and office hierarchy) and allergic ill- nesses (Andersson 1998, Reijula and Sundman-Digert 2004).
2.2.2. Online questionnaire for the students and teachers
Symptoms and perceived IAQ were recorded during the two-week measurement period in the studied classrooms using a simple and short online questionnaire developed in the related research project,‘Indoor Air Police’(Järvi et al. 2018). The aim of the questionnaire develop- ment was to create an easy tool for time- and space-specific reporting of the occurring problems and to involve students as an important group of school occupants. Questions were selected based on previous ques- tionnaires on IAQ, for example, the Örebro MM-60 and MM-80 (Andersson 1998). Both teachers and students from grades seven to nine responded the questionnaire following each class via a personal link by using a cell phone or a tablet computer. Paper questionnaires were available in case of technical problems. Questions addressed perceived symptoms and comfort during the previous class with simple answer options, such as‘no’,‘little’, and‘a lot’. When responding for the first time, background information including personal health (e.g., perceived health, allergic diseases and smoking) and home environ- ment factors (e.g., pets, type of accommodation and moisture damage at home) were covered as well. Statistical differences between proble- matic and comparison schools and between classrooms were studied from the collected responses. This study was based solely on self-re- ports, and no objective measurements of occupants' health were con- ducted.
2.3. Sampling and instrumentations
Data acquisition consisted of one-minute samplings and long-term measurements for up to two weeks, as well as recordings of perceptions both on a real-time basis and retrospectively. Thefilter and settled dust and endotoxin samples and the two-week monitoring represented long- term accumulation and exposure. The aim was to form an encom- passing outlook of multiple parameters in the studied schools with the available resources. Altogether, 14 different parameters were mea- sured. Measured factors, measurement methods, devices and their ac- curacy, measurement locations and times are presented inTable S1in thesupplementary material.
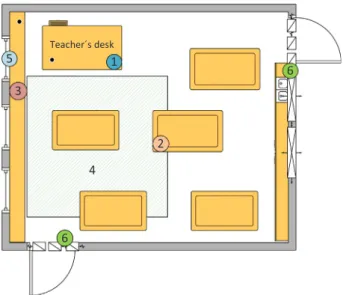
A schematic diagram of one classroom and its measurement loca- tions are presented inFig. 1. All classrooms were shaped and furnished differently, but the measurement set-up was analogous in each.
2.3.1. Ventilation and physical parameters
Differential pressures (dPa) across the building envelope were measured in each classroom with SWEMA 3000md device (Swema, Stockholm, Sweden) as 60-second average measurements to observe the current pressure conditions in the rooms. Measurements were
conducted with a plastic tube and a copper core placed outside of a closed window. Supply and extract air flow rates were evaluated as real-time readings from the ventilation terminal units in the classrooms where reliable measurements were possible during the visit.
Temperature (T), relative humidity (RH) and carbon dioxide (CO2) concentrations were recorded as continuous measurements for a two- week period in each classroom with Rotronic CL11 meter (Rotronic AG, Bassersdorf, Zürich, Switzerland), see Fig. S2 in the supplementary material. Measurement devices were placed on the teacher’s desk at the front of the room, away from the teacher’s breathing zone when seated and as close to the horizontal central area of the room as possible.
T and RH were compared to simultaneous regional outdoor condi- tions. The outdoor data were taken from the open access weather sta- tistics of the Finnish Meteorological Institute (2019), measured at weather stations located approximately 1.5–10 km from the schools (10.0 km from P1, 8.2 km from P2, 4.5 km from P3, 1.5 km from P4, 4.5 km from C5 and 6.0 km from C6). In the database, data are avail- able as 10-minutely values. Outdoor medians were calculated from the data collected during the corresponding school measurement period.
2.3.2. Gaseous pollutants and particulate matter
VOC sampling and analysis were carried out in each classroom ac- cording to the ISO 16000-6 standard (ISO 16000-6:2011). Duplicate air samples were taken from the central area of an empty and closed room in the main working zone at a height of 1.5 m. Samples of 8 dm3were collected in stainless steel tubes (Markes International Ltd., Llantrisant, UK) packed with Tenax TA (60/80 mesh) and Tenax TA-Carbograph 5TD at a flow rate of 0.20 dm3/min using GilAir Plus air sampling pumps (Sensidyne, St. Petersburg, FL, USA). Analyses were conducted at Aalto University or the FIOH. Sampling of VOCs is shown inFig. S3in thesupplementary material.
Formaldehyde concentrations of indoor air were evaluated in classrooms 1e, 2g, 3a, 4d, 5b and 6d using a formaldehyde meter FM- 801 (Graywolf Sensing Solution, Sheldon, IA, USA) for a two-week period. Carbon monoxide (CO), hydrogen sulphide, arsine, ammonia and ozone were measured in classrooms 1e, 2g, 3a, 4d and 5b as con- tinuous two- to four-day measurements with TG-501 and IQ-610 probes and stored in a palm computer and online service (Graywolf Sensing
Solution, Sheldon, IA, USA).
Fine particulate matter (PM2.5) was measured in classrooms 1e, 2g, 3a and 5b, and coarse particulate matter (PM10) was measured in classrooms 1e, 2g, 5b and 6d for a two-week period using an MIE pDR- 1500 nephelometer equipped with a PM2.5 or PM10 size-selective inlet cyclone (Thermo Fisher Scientific, Franklin, MA, USA).
The measurement devices were placed in the back or front of the room at a height of 1.5 m and as close to the central area as possible.
Measurement units are shown inFig. S4in thesupplementary material.
2.3.3. Endotoxin loads in settled surfacefloor dust
The endotoxin samples were collected from the classroom floors using a vacuum cleaner (Volta Equipt or Electrolux ZB5003, AB Electrolux, Stockholm, Sweden) with disposable wipers as filters (Kimwipes, Kimtech Science Wipers, Merck KGaA, Darmstadt, Germany). A total of 36 samples were collected from six schools (six classrooms in each school) representing long-term accumulation and exposure. Before sampling, the inside and outside of the vacuum cleaner nozzle were disinfected with 70% ethanol. Dust was vacuumed in an empty classroom during a regular school day forfive minutes and from an approximately 10 m2 area near children's desks or working areas (seeFig. 1). After sampling,filters were put into clean plastic bags (Minigrip, Amer Plast, Tampere, Finland) and frozen (−20 °C) (Duquenne et al. 2013, Letourneau et al. 2009, Spaan et al. 2008, 2007) until analysis.
The samples were analysed at the Centre de Recherche de l’Institut Universitaire de Cardiologie et de Pneumologie de Québec, Canada, using a Kinetic-QCL™ Kinetic Chromogenic LAL Assay (Lonza, Walkersville, MD, USA). The loads of endotoxins infloor dust were then expressed as EU/m2. Briefly, endotoxins were extracted by vortexing (maximum speed, Multi-Pulse Vortexer, Glas-Col, Terre Haute, IN, USA) filters for 1 h at 4 °C in 30 mL of sterile pyrogen-free salt solution (0.9%
NaCl) supplemented with 0.025% Tween 20. Solutions were then cen- trifuged at 500g for 10 min at 4 °C, and supernatants were used for endotoxin quantification. Inhibition/enhancement tests were per- formed, and the detection limit of the method was 0.47 EU/m2. The method’s efficiency, reproducibility and sensitivity for endotoxin quantification have been evaluated in previous studies (Duquenne et al.
2013, Letourneau et al. 2009, Spaan et al. 2007, Spaan et al. 2008).
2.3.4. Airborne cultivable microorganisms
Airborne cultivable microorganisms were monitored at indoor (two samples per each classroom, 12 samples per each school) and outdoor locations (two samples per each school) with a RCS®High Flow Touch Microbial Air Sampler (Merck KGaA, Darmstadt, Germany, Ser. No.
41877) and agar media contained in aflexible foil (HYCON®, Merck KGaA, Darmstadt, Germany), seeFig. S5in thesupplementary material.
The sampling volume used was 0.10 m3.
Tryptic Soy Agar (TSA, with no added fungicide) strips were used to identify the total cultivable microorganisms (TC, Total count (941105), HYCON®), and Rose Bengal Agar strips with streptomycin and chlor- amphenicol were used to selectively isolate and enumerate cultivable yeasts and moulds (YM, Yeasts and moulds (941196), HYCON®) ac- cording to the manufacturer’s guidelines. Agar media blanks were taken into thefield but not opened (Bartlett et al. 2004). All samples were collected within a 30 min time period in empty classrooms during regular school hours and in between normal room activities to reflect the building-related conditions that occupants are exposed to during the school day. Measurements were taken at a height of 1.0 m above floor or ground level, and by walking around the classroom or outdoors at the front area of the school facade. Strips were then incubated at two different temperatures (30 °C for total cultivable microorganisms and 21 °C for cultivable yeasts and moulds) prior to counting the visible colonies (after four days for TC, seeFig. S6in thesupplementary ma- terial, and after seven days for YM).
Fig. 1.Measurements in a classroom. (1) temperature, relative humidity and carbon dioxide measurement, (2) volatile organic compound sampling, (3) sampling of other gaseous pollutants and particulate matter, (4) endotoxin sampling area, (5) differential pressure measurement through window and (6) airflow rate measurement from the supply and extract air diffuser. In addition, airborne cultivable microorganisms were collected from air near the classroom walls, and in some classrooms, settled dust was wiped from the available sur- faces near walls or above door height.
2.3.5. Characterisation of the cultivable moulds in indoor airborne and settled indoor dust with special focus on toxigenic Trichoderma strains
Moulds in indoor airborne dust were extracted from the exhaust air filters of air handling units serving the building sections where the studied classrooms were located. Airborne moulds captured by the air filters (collecting a sample offilter dust to be cultivated is shown inFig.
S7 in the supplementary material) were cultivated directly on malt extract agar (MEA) inoculated by shaking the filters above the agar plates (malt extract 15 g: Sharlab, Barcelona, Spain; agar 12 g: Amresco, Solon, Ohio, USA, in 500 mL of H2O). Settled dust was also collected by clean plastic bags (Minigrip, Amerplast, Tampere, Finland) from sur- faces 1.5–2.0 m above thefloor level of the classrooms under study in schools P3, P4 and C6, and cultivated on MEA.
Fungal colonies representing dominant morphotypes after four weeks of incubation were characterised and identified to the genus or species level by macroscopic and microscopic observations. Colonies of cultivable moulds were screened for toxicity. Sampling and character- isation methods, as well as toxicity screening, were described by Vornanen-Winqvist et al. (2018a). Attention was focused especially on the diversity of toxigenic Trichodermastrains, potentially pathogenic versus non-pathogenic Rhizopus strains, toxigenic Fusarium and toxi- genic versus non-toxigenicChaetomium-like strains.
Fungal colonies were grouped into nine morphotypes, based on their morphology on MEA, ability to grow at 37 °C, light microscopy results for conidia and conidiophores, mycoparasitic growth and re- sponses to the two toxicity assays: the boar sperm motility inhibition
assay and the inhibition of cell proliferation assay. The isolates were compared to the reference strains from the HAMBI culture collection (Microbial Domain Biological Resource Centre HAMBI, University of Helsinki, Finland) or identified according to the process described by Samson et al. (2004). Representatives of the morphotypes of toxigenic Trichoderma and Chaetomium strains were further identified by se- quence analysis of the ribosomal RNA gene cluster’s internal tran- scribed spacer region and/or a fragment of the gene encoding for translation elongation factor 1 alpha (tef1) (Castagnoli et al. 2018).
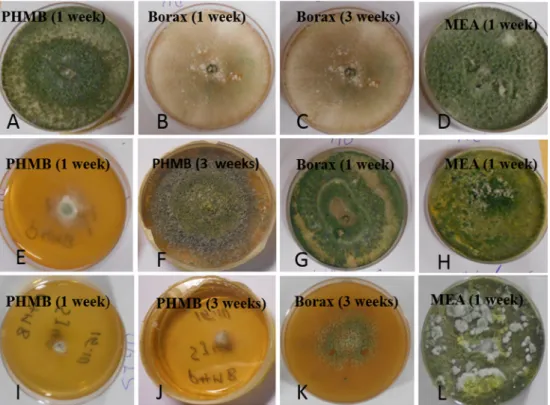
The biocide resistance of the isolatedTrichodermastrains was tested with polyhexamethylene biguanide (PHMB, 30 µg mL−1) and borax (600 µg mL−1) MEA plates (15 g malt extract and 12 g agar per 500 mL of H2O). PHMB-containing MEA plates were prepared by adding 15 mg of PHMB to 500 mL of the water used to prepare the 500 mL of the MEA medium. Borax-containing plates were prepared via the process de- scribed byMikkola et al. (2015). The plates were inoculated with about 5 mg of spores, incubated for two weeks at 22 °C and kept in daylight to optimise sporulation. Growth and sporulation were inspected after one and three weeks. Three tests were repeated per strain, and MEA control plates were inoculated in parallel.
2.4. Statistical analysis
Statistical parameters were calculated with Microsoft Office Excel.
The statistical analyses of the differences between the online ques- tionnaire results were performed by cross tabulation, Pearsonχ2-test Fig. 2.Perceived work environment and symptoms according to the FIOH's indoor climate survey.
and Fisher’s exact test (SPSS-25.0 for Windows, SPSS, Inc., Chicago, IL, USA).
3. Results and discussion 3.1. Indoor climate questionnaires 3.1.1. Questionnaire for the employees
The number of employees in each school (P1: 45, P2: 75, P3: 56, P4:
59, C5: 37, and C6: 40 employees) fulfilled the applicable criteria of minimum of 20 full-time employees involved in the survey (FIOH 2020). The average response rate was 68% (P1: 85%; P2: 69%; P3: 70%;
P4: 73%; C5: 46%; and C6: 65%), being at the same level than the response rate (average about 70%; range 40–100%) in other studies utilizing the FIOH’s questionnaire (Tähtinen et al. 2019, Reijula and Sundman-Digert 2004, Pasanen et al. 2002). Although the moderately low response rate may weaken the reliability of the results in school C5 and the possibility of self-selection bias cannot be eliminated, results can still be considered important indicative signals. Higher sensation of symptoms and poor IAQ could motivate the occupants to respond to questionnaires in problematic schools. In a study regarding family-ad- ministered questionnaires, the families having greater number of re- ported symptoms from the child and other family members were more inclined to participate in the study (Bornehag et al. 2006).
The perceived work environment and symptoms in each school based on the FIOH’s indoor climate survey are presented inFig. 2. More detailed results are available inTable S2in thesupplementary material.
As shown inFig. 2andTable S2, the work-related symptoms were clearly more prevalent in the problematic schools than in the compar- ison schools. Less than 20% of responses from the comparison schools reported symptoms, complying with the reference values, whereas in the problematic schools, symptom prevalence was higher. In school C5, occupants reported more tiredness (19%), hoarse or dry throat (18%) and skin symptoms of hands (18%) compared to reference values.
However, altogether in the problematic schools, higher number of oc- cupants reported these symptoms (16–37%, 28–46% and 13–26%, re- spectively). It has been shown that the subjective IAQ is more based on building-related factors in schools with indoor air problems, and in schools without IAQ problems it may reflect psychosocial factors (Finell et al. 2017). In school C5, occupants reported a lot of stress, too much work and poor possibilities to effect own work.
Work environment-related discomfort was also reported less in comparison schools; however, in general, the difference between pro- blematic and comparison schools was not so clear than in symptoms. In school C5, occupants reported stuffy air and insufficient ventilation which might be explained by the low airflow rates (seeSection 3.2). In school C6, high temperature was reported more than in other schools.
Higher temperatures in this school were supported also by the tem- perature measurements (seeSection 3.2). In school P2, occupants re- ported only temperature-related discomfort and otherwise seemed to be satisfied with the work environment compared to the reference values.
Noise and poor lighting or reflections are not indoor air -related factors as such but are affecting the holistic perception of personal wellbeing in the workplace; therefore, the results are presented here alongside the other results. Noise was reported in all schools, and poor lighting or reflections only in school C5.
Based on the occupants’perceptions of both work environment and symptoms, schools P1 and P3 seemed to have most IAQ problems;
however, the symptoms in P2 and P4 were also clearly elevated when compared to both the reference data and comparison schools. The re- lative humidity of indoor air was very low in all the schools, particu- larly in school P3 (see Section 3.2), which could have affected the perceived symptoms and discomfort (Wolkoff 2018, Wolkoff and Kjærgaard 2007). Perceptions related to stuffy or dry air and in- sufficient ventilation, and symptoms related to eye or nose irritation, hoarse throat or cough, difficulties in breathing or facial or hand skin
symptoms were emphasized in problematic schools. These are all fac- tors that could be related to the cold season and dry indoor air. Fur- thermore, feeling heavy-headed, tiredness and headaches were pre- valent especially in problematic schools. Increased reporting of especially respiratory (i.e., runny nose, stuffy nose, cough, hoarseness, and sore throat) and general symptoms (i.e., fatigue, concentration difficulties, and headache) have been found to correlate with expert- assessed indoor environment quality problems in a previous study (Savelieva et al. 2019). In addition, in schools P1 and P2, self-reported stress, other psychosocial factors and asthma were more prevalent than in the reference data (Reijula and Sundman-Digert 2004), possibly in- creasing symptom perceptions.
Occupants' worry about perceived IAQ problems had been present in all problematic schools over a longer period, negatively affecting the atmosphere at work. This kind of work environment-related psycho- social stress is known to cause more complaints and symptoms re- garding the indoor environment (Lahtinen et al. 2004, Brauer and Mikkelsen 2010), and the role of worry and socioemotional difficulties in increased symptom perceptions have been shown recently in several studies (Nissilä et al. 2019, Finell et al. 2018). Also, knowledge of an ongoing study may considerably affect the reporting of symptoms (Brauer and Mikkelsen 2003). At the beginning of this study, the oc- cupants were told whether their school was considered a problematic or a comparison school. Therefore, it is possible that occupants who had more symptoms were overrepresented in this study.
3.1.2. Online questionnaire for the students and teachers
The online questionnaire results were detailed and compared to measurements of temperature, relative humidity and CO2inJärvi et al.
(2018). In the problematic schools, teachers and students reported more symptoms and inconveniences than in comparison schools. Differences were significant for symptoms and discomfort reported by teachers and for symptoms reported by students during the last hour (p-values <
0.001). The results indicated that the most problems occurred in schools P3 and P4. Many significant differences occurred between the classrooms in both problematic and comparison schools (Järvi et al.
2018).
The results of the online questionnaire confirm those of the FIOH’s questionnaire, with some exceptions. It must be noted that these two questionnaires gave a different perspective to the studied buildings: the online questionnaire provided information only from the studied classrooms during a specific timeframe, whereas the FIOH’s ques- tionnaire covered the whole building and addressed long-time percep- tions. Moreover, the respondent groups were different, with only a group of teachers and students completing the online questionnaire and employees throughout the building completing the FIOH’s ques- tionnaire.
3.2. Ventilation and physical parameters
Differential pressures and airflow rates are shown inTable S3in the supplementary material. The sufficiency of the supply air rate was calculated by dividing the supply airflow rate by the required design airflow rate 6 dm3/(s person) (Ministry of the Environment, Finland 2017). Airflow rates could be measured during the visits to schools P2, P3, P4 and C5, excluding classrooms 2b, 4f, 5a, 5b and 5f. The supply airflow rates were considered sufficient in most of these classrooms (sufficient for 21–48 people), except in C5, where the ventilation was sufficient for only 11–15 people, and P4, where the ventilation was sufficient for only 15–27 people. These occupancy rates are likely ex- ceeded on occasion, since the typical number of students per class is 20–30 people.
In the majority of the classrooms (66%), dPa values were moder- ately negative (max.−10 Pa) from−9.3 Pa to−0.7 Pa. Negative dPa from−10.2 Pa to−18.7 Pa occurred in 21% of the classrooms (1b–d, 3f, 4c–e and 5e), and moderate positive dPa from 3.5 Pa to 8.0 Pa
occurred in 13% of the classrooms (2a, 2b, 2e, 3e and 6f). Ergo, high negative dPa values (over−10 Pa) were established mostly in schools P1 and P4, and positive dPa established mostly in school P2. According to the national decree, high negative dPa should be avoided to prevent the infiltration of possible harmful impurities inside building structures (Ministry of the Environment, Finland 2017). Positive differential pressure might prevent the infiltration (Vornanen-Winqvist et al.
2018a).
T, RH and CO2in the classrooms during school days, between the working hours of 8 am and 5 pm (median, min and max values) are shown inTable S4in thesupplementary material. Medians of T and RH during the two weeks measurement period are shown as a function of median outdoor temperature and relative humidity inFig. 3.
From 8 am to 5 pm, schools P3, C5 and C6 had the highest median temperatures (21.9, 22.6 and 21.9 °C, respectively), and school P1 had the lowest one (20.4 °C). However, all the schools’indoor temperatures were within the limits of +20 °C (min) and +26 °C (max) during the heating season (Ministry of Social Affairs and Health, Finland 2015).
Low RH values were typical for the cold season, especially in well- ventilated buildings. RH was lowest in the P3 classrooms (median be- tween 8 am and 5 pm: 16.1%) and highest in the C5 classrooms (median: 24.5%). In other schools, median RH values were between 21% and 23%. RH of about 40% is suggested for the well-being of eyes and upper airways (Wolkoff and Kjærgaard 2007). In particular, ex- cessively dry indoor with RH below 20% for a long time is known to cause irritation and symptoms (Fang et al. 2004, Sunwoo et al. 2006), and a low relative humidity of 20–35% also favours the spread of in- fluenza viruses (Lowen et al. 2007, Kudo et al. 2019). Therefore, the low RH values could contribute to some symptoms observed by the occupants, especially in school P3.
From 8 to 5 pm, schools C6 and P1 were characterised by higher median CO2concentrations (564 and 520 ppm, respectively) compared to schools P2, P3, P4 and C5 (458, 466, 443 and 482 ppm, respectively).
In comparison schools, more classrooms reached high maximum CO2
concentrations than in problematic schools. The limit for indoor CO2is 1,150 ppm higher than outdoors (approx. 400 ppm) (Ministry of Social Affairs and Health, Finland 2015), which was not exceeded in any of the classrooms.
3.3. Gaseous pollutants and particulate matter
VOC and TVOC concentrations detected in air samples are presented in Table S5 in the supplementary material. TVOC concentrations were < 10–30 µg/m3(school P1), < 10–20 µg/m3(P2), < 10–40 µg/
m3 (P3), < 10–20 µg/m3(P4), 20–30 µg/m3(C5) and 30–50 µg/m3 (C6). These concentrations were higher in the comparison schools (averages 22 (C5) and 37 (C6) µg/m3) than in the problematic schools (12 (P1), 9 (P2), 8 (P3) and 12 (P4) µg/m3), and interestingly, a greater variety of VOCs were detected in the comparison schools. In all studied classrooms, TVOC and single VOC concentrations were below the na- tional decree’s reference values (400 µg/m3for TVOC and 10–50 µg/m3 for single compounds), except for classroom 3b, where the ethanol concentration (75 µg/m3) exceeded the action limit of 50 µg/m3 (Ministry of Social Affairs and Health, Finland 2015).
The major compound groups detected were aromatic hydrocarbons, alcohols and aldehydes. The median concentration of 69% of all de- tected compounds was ≤1 µg/m3. Benzene (median concentration 0.5 µg/m3), toluene (0.5 µg/m3), nonanal (1 µg/m3), 2-ethyl-1-hexanol (2 µg/m3), benzaldehyde (1 µg/m3), decanal (1 µg/m3), 1-butanol (1 µg/m3), p,m-xylenes (0.5 µg/m3), decamethylcyclopentasiloxane (2 µg/m3) and acetone (3 µg/m3) were the most commonly found compounds in the classrooms.
The measured TVOC concentrations in the present study were si- milar to those observed in 144 mechanically ventilated classrooms in the USA, with concentrations of 10.12–45.89 µg/m3 during winter measurements (Zhong et al. 2017), and lower than 73 naturally venti- lated Portuguese classrooms with a TVOC median of 140.3 µg/m3 (Madureira et al. 2009) or a review study of 104 classrooms with 60%
of the values between 80 and 200 µg/m3(Chatzidiakou et al. 2012).
Benzene, toluene and p,m-xylene were also among the most ob- served VOCs in 144 American classrooms, with median concentrations of 0.3, 0.7 and 0.4 µg/m3, respectively (Zhong et al. 2017). In that study, aromatics, alkanes and terpenes were the major compound groups detected, and most VOCs’ mean concentrations were below 5 µg/m3(Zhong et al. 2017), similar to our results. In the 73 Portuguese classrooms, meanwhile, the median concentrations were 2.5 µg/m3for benzene and 6.4 µg/m3for toluene (Madureira et al. 2015).
VOC emissions in schools originate from a combination of indoor building materials, human activities and outdoor sources (Chatzidiakou et al. 2012). Cleaning products and art and craft activities are typical sources for elevated VOC concentrations in schools (Mishra et al. 2015, Śmiełowska et al. 2017). Art activities took place in classrooms 1d, 2c and 3f; thus, the teachers and students in these classrooms were more exposed to VOC-containing teaching materials than in the other class- rooms. In classroom 2c, 2-ethyl-1-hexanol (4 µg/m3) and nonanal (2 µg/m3) were detected. Art classroom 3f had higher TVOC con- centration (40 µg/m3) compared to the other P3 classrooms (≤10 µg/
m3), consisting of numerous compounds with concentrations of < 2 µg/
m3. Classroom 1d showed no difference to the other classrooms in the same school.
Toluene in classrooms 4d and 4e; 2-phenoxyethanol in classrooms 2c, 5a, 5b, 5c and 5e; and propylene glycol in classroom 2c exceeded the recommended limit values for workplaces published by theFIOH (2017). Repeated VOC-samplings would be necessary to confirm their long-term presence in the visited classrooms.
Formaldehyde concentrations were under the Finnish action limit of 50μg/m3(Ministry of Social Affairs and Health, Finland 2015). Spe- cifically, measurements were below the device’s detection limit of 10 ppb (equal to approximately 12μg/m3) in schools C6 and P4 and reached a maximum of 13 ppb (equal to approximately 16 µg/m3) in the other schools. These results were in the range of formaldehyde concentrations found in past school studies. For example, a median formaldehyde concentration of 6.0μg/m3had been reported in me- chanically ventilated American school buildings (Zhong et al. 2017) and a 17.5 μg/m3 concentration had been reported in naturally Fig. 3.Temperature and relative humidity in the classrooms presented as
medians and as a function of median outdoor temperature and relative hu- midity during the measurement periods. *Finnish Meteorological Institute (2019).
ventilated Portuguese buildings (Madureira et al. 2015).
Neither ammonia, arsine, ozone nor hydrogen sulphide were found in the indoor air of the studied schools. CO varied from 0.1 to 1.3 ppm, which is fairly below the Finnish action limit of 7 mg/m3(equivalent to 6.0 ppm) (Ministry of Social Affairs and Health, Finland 2015) and WHO (2010)guidelines of 6.1 ppm for a 24-hour exposure. Research on CO levels in school classrooms is limited, but some epidemiological studies have associated mean CO levels of 2.73 ppm (range:
0.65–6.23 ppm) with an approximately 4.0% increase in absenteeism with no lagged effects (Chen et al. 2000, Currie et al. 2009). CO is a colourless, odourless toxic gas formed by incomplete combustion of organic matter, and in most of the school studies, the concentrations were low, since CO mainly originates from outdoor vehicular emissions (Chithra and Nagendra 2018).
Fine and coarse particulate matter (PM2.5and PM10) concentrations are shown inTable 2.
PM concentrations were low compared to the action limits of 25 µg/
m3for PM2.5and 50 µg/m3for PM10(Ministry of Social Affairs and Health, Finland 2015). Daily recommended WHO guidelines are 20 µg/
m3for PM10and 10 µg/m3for PM2.5(WHO 2010). The medians varied from 0.5 to 2.2 µg/m3(PM2.5) and from 1.8 to 2.8 µg/m3(PM10) during school hours. Curiously, in school C5, the median concentrations were the highest among the studied schools. However, multiple peaks of PM2.5and PM10concentrations occurred in schools P1 and P2.
The results of the present study are lower than those found in European classrooms (mean daily PM2.5concentration of 20.2 µg/m3 and PM10concentrations from 43 to 169 µg/m3) (Chatzidiakou et al.
2012) and school studies in different climatic regions (median of 24 µg/
m3for PM2.5and of 105 µg/m3for PM10) (Salthammer et al. 2016). The studied schools’cleanliness, ambient environment and proper ventila- tion likely promoted their low PM concentrations.
3.4. Endotoxin loads in settled surfacefloor dust
Endotoxin concentrations in each visited classroom are presented in Table 3.
Compared to the concentrations reported previously in literature, the endotoxin levels of the present study were extremely low. The average endotoxin concentrations in schools P1, P2, C5 and C6 (1.5, 7.3, 1.1 and 15.8 EU/m2, respectively) were relatively low compared to schools P3 and P4 (77.5 and 56.4 EU/m2, respectively). According to Salonen et al. (2016), endotoxin levels in school settled dust may vary between 2180 and 48,000 EU/m2. In the HITEA study, mean con- centrations of 1100–3300 EU/m2 were reported from the Finnish (Jacobs et al. 2014a,b). However, in the HITEA study, the dust was collected for eight weeks which is a major difference compared to this study.
Endotoxin levels are affected by several factors, such as the build- ing’s age, cleaning,flooring materials, ventilation system, presence of animals, relative humidity and temperature (Salonen et al. 2013, Jacobs et al. 2014a,b). These factors contributed to low endotoxin concentrations in the present study: the schools had plasticflooring and
other hard-surfaced indoor materials; there were no animals, and de- spite the few days long cleaning break, regular cleaning activities were in place. In addition, the buildings were relatively new or renovated, the RH of indoor air was low (medians from 15% to 27%), outdoor temperatures were low and indoor temperatures were rather uniform between schools.
The data variability between classrooms was quite high, especially in schools P3 and P4 (standard deviations of 63.0 and 49.5, respec- tively). In schools C5 and P1, variability between classrooms was low (1.0 and 1.5, respectively). Classroom use and occupancy following the latest cleaning could explain the differences and data variability. For example, in classrooms 2c and 2e, normal cleaning activities were conducted without the requested cleaning break, and endotoxin levels were lower compared to the other rooms. In contrast, the endotoxin levels were high in classrooms 3a and 3b, in which mice excrement was observed daily, according to the teacher, and during the measurement visit.
Single endotoxin measurements may be used to estimate annual endotoxin levels in schools (Jacobs et al. 2014a,b). However, previous research data indicate that although endotoxin quantification infloor settled dust is generally accepted, the measurements of endotoxins in air samples might better represent inhaled endotoxins (Noss et al. 2008, Park et al. 2006, Jacobs et al. 2014a,b).
3.5. Airborne cultivable microorganisms
Concentrations of airborne cultivable microorganisms and indoor/
outdoor (I/O) ratios in the studied problematic and comparison schools are shown inTable 4.
Differences between classrooms were especially notable in schools P2–P4. P1 was left out of the statistical evaluation since the outdoor microbial concentration was not available.
An I/O ratio > 1 might indicate indoor sources of microbes in buildings, and if I/O ratio is close to 1, the microbial concentrations are Table 2
Average, median, minimum and maximum values of PM2.5and PM10concentrations in the studied classrooms on school days between 8 am and 5 pm.
PM2.5[µg/m3] PM10[µg/m3]
School P1 P2 P3 P4 C5 C6 P1 P2 P3 P4 C5 C6
Classroom 1e 2g 3a ND 5b ND 1e 2g ND ND 5b 6d
Total measurement time [days] 14 16 4 14 2 16 14 3
Average 2.7 1.0 2.3 2.4 3.4 2.5 3.1 1.8
Median 2.1 0.5 2.1 2.2 3.3 1.8 2.8 1.5
Min 0.5 0.0 0.7 0.3 2.4 0.4 0.6 0.8
Max 24.2 24.9 4.3 6.2 6.8 24.1 11.2 11.5
ND: no data.
Table 3
Loads of endotoxin (EU/m2) in the settledfloor dust of the six studied schools.
Endotoxins [EU/m2] P1 P2 P3 P4 C5 C6
Classroom
a – 4.9 89.3 8.3 0.9 3.5
b 3.7 1.1 192.3 132.6 0.5 9.3
c 0.5 1.7 9.9 15.3 0.5 16.1
d – 1.0 36.9 67.4 3.1 7.6
e 1.4 7.4 76.9 23.2 0.9 46.8
f 0.6 6.1 59.6 91.4 1.0 11.4
g 13.2
h 23.0
Field blank 1.3 2.7 3.9 3.2 – 2.9
Average 1.5 7.3 77.5 56.4 1.1 15.8
Median 1.0 5.5 68.2 45.3 0.9 10.3
Std 1.5 7.5 63.0 49.5 1.0 15.8
Min 0.5 1.0 9.9 8.3 0.5 3.5
Max 3.7 23.0 192.3 132.6 3.1 46.8
generally similar in indoor and outdoor air (Salonen et al. 2015). The I/
O ratio (total count) was > 1 in most P2 and P3 classrooms, in two P4 classrooms, and in one C6 classroom. The I/O ratio (yeast and mould) was < 1 in all schools, except one classroom in P3.
Elevated total count concentrations in problematic schools may indicate microorganism sources indoors and consequently require ad- ditional environmental investigations. Concentrations could also be elevated due to occupants, particularly bacteria, if the classrooms had poor ventilation; however, the airflow rate measurements (seeSection 3.2) did not support this suggestion.
Climatic conditions are the determinants of airborne viable fungal concentrations (Salonen et al. 2015, Pyrri and Kapsanaki-Gotsi 2017).
In the subarctic region, differences between damaged and non-damaged buildings are more obvious during winter than other seasons with higher outdoor fungal concentrations (Meklin 2002). The space–time variation of airborne viable fungal concentrations in the outdoor en- vironment is high (WHO 2009), and data interpretation should be based on multiple air sampling campaigns (Salonen et al. 2015). Therefore, repeated samples and longitudinal studies are necessary to confirm airborne microbial exposure in an occupational setting.
3.6. Characterisation of the cultivable moulds in indoor airborne and settled dust with special focus on toxigenic Trichoderma strains
The categorisation of indoor fungal colonies into morphotypes and identification to the species level of morphotypes representing the genera Trichoderma, Rhizopus, Chaetomium, Dichotomophilus and Fusarium are summarised inTable S6in thesupplementary material.
Aspergillus, Eurotium, PaecilomycesandPenicilliummorphotypes are de- scribed inVornanen-Winqvist et al. (2018a, 2018b).
The dominance and occurrence of each fungal species, genus or morphotype in each school were estimated based on the frequency of plates recorded positive for growth, since overgrowth of fungal genera, such asRhizopus, prevented colony quantification. Frequently occurring fungal colonies of toxigenic morphotypes belonged to the genera
Trichoderma, Aspergillus, Penicillium, Fusarium and Chaetomium.
Potentially pathogenic strains able to grow at 37 °C were identified as Trichoderma (T. citrinoviride, T. longibrachiatum), Aspergillus (A.flavus, Aspergillussp. sectionNigri),Rhizopus(R. oryzae) andPaecilomycessp.
Non-toxigenic and non-pathogenicRhizopusandPenicilliumstrains were also present in the indoor dust in all six studied schools. The results are presented inTable 5.
Table 5shows that toxigenicTrichodermastrains were found on 38%
of the 52 plates inoculated with airborne and settled dust collected from schools P1–P4, but not on any of the 21 plates associated with schools C5 and C6, indicating an incidence of < 5%. The problematic schools associated with IAQ complaints shared toxigenic representatives of the genusTrichoderma: the mycoparasitic speciesT. atroviride(Druzhinina et al. 2011, Seidl et al. 2009) andT. trixiaeand the potentially patho- genic speciesT. longibrachiatumandT. citrinoviride. T. trixiaehas been documented once in a Finnish indoor environment, whileT. atroviride was the most frequent Trichoderma species isolated from Finnish buildings (Castagnoli et al. 2018).
Mycoparasitically and mycotrophically growingTrichoderma pro- duce many biologically active substances participating in the myco- parasitic process, as proteases, chitinases and peptaibols (Druzhinina et al. 2011). Trichorzianins and trilongins, peptaibols fromTrichoderma toxic to mammalian cells inin vitroandex vivoassays, are emitted as liquid-containing vesicles by indoorT. atrovirideandT. trixiaestrains (Castagnoli et al. 2018). Biologically active metabolites could therefore be airborne in buildings showingTrichodermagrowth.
Toxigenic and potentially pathogenicAspergillusstrains were found in schools P3, P4, C5 and C6. ToxigenicChaetomium globosumand non- toxigenicDichotomophilussp. strains were detected in school C5, while toxigenicFusarium sp. strains were the dominant colonisers of plates from school C6. Our results indicate that viable conidia of toxigenic and potentially pathogenic mould species may also be found in healthy buildings or buildings where health symptoms have not evolved.
A summary of the found toxigenic and/or pathogenic moulds in the six studied schools is presented inTable 6.Tables 5 and 6show that Table 4
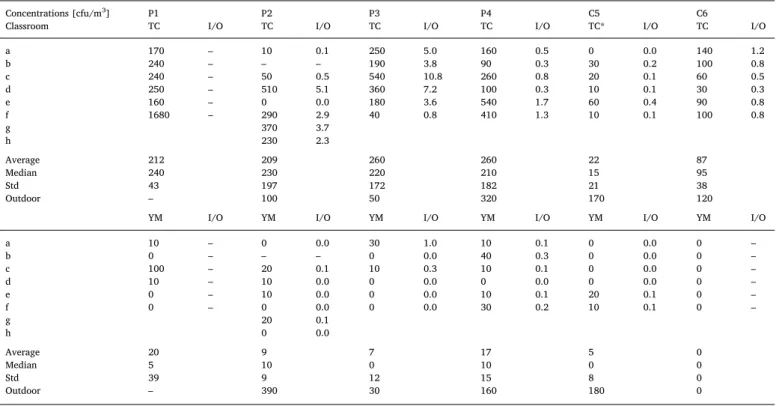
Concentrations of airborne cultivable microorganisms and indoor/outdoor (I/O) ratios in the studied schools P1–C6.
Concentrations [cfu/m3] P1 P2 P3 P4 C5 C6
Classroom TC I/O TC I/O TC I/O TC I/O TC* I/O TC I/O
a 170 – 10 0.1 250 5.0 160 0.5 0 0.0 140 1.2
b 240 – – – 190 3.8 90 0.3 30 0.2 100 0.8
c 240 – 50 0.5 540 10.8 260 0.8 20 0.1 60 0.5
d 250 – 510 5.1 360 7.2 100 0.3 10 0.1 30 0.3
e 160 – 0 0.0 180 3.6 540 1.7 60 0.4 90 0.8
f 1680 – 290 2.9 40 0.8 410 1.3 10 0.1 100 0.8
g 370 3.7
h 230 2.3
Average 212 209 260 260 22 87
Median 240 230 220 210 15 95
Std 43 197 172 182 21 38
Outdoor – 100 50 320 170 120
YM I/O YM I/O YM I/O YM I/O YM I/O YM I/O
a 10 – 0 0.0 30 1.0 10 0.1 0 0.0 0 –
b 0 – – – 0 0.0 40 0.3 0 0.0 0 –
c 100 – 20 0.1 10 0.3 10 0.1 0 0.0 0 –
d 10 – 10 0.0 0 0.0 0 0.0 0 0.0 0 –
e 0 – 10 0.0 0 0.0 10 0.1 20 0.1 0 –
f 0 – 0 0.0 0 0.0 30 0.2 10 0.1 0 –
g 20 0.1
h 0 0.0
Average 20 9 7 17 5 0
Median 5 10 0 10 0 0
Std 39 9 12 15 8 0
Outdoor – 390 30 160 180 0
TC: total cultivable microorganisms, YM: yeast and mould. Classroom 1f (TC) concentration was not included in statistical calculations. *TC after 7 days.