On Finding Better Wavelet Basis for Bearing Fault Detection
Lajos Tóth
Department of Electrical and Electronic Engineering University of Miskolc
H-3515 Miskolc-Egyetemváros, Hungary e-mail: elklll@uni-miskolc.hu
Tibor Tóth
Department of Information Engineering University of Miskolc
H-3515 Miskolc-Egyetemváros, Hungary e-mail: toth@ait.iit.uni-miskolc.hu
Abstract: This paper considers the comparision of the Meyer and Morlet wavelet for bearing fault diagnosis. We created a wavelet based upon a transient vibration signal model established for signals generated in deep-groove ball bearings with pitting (spalling) formulation on their inner race. The wavelet creation used the sub-optimal algorithm devised by Chapa and Rao that matches a Meyer wavelet to a band limited signal in two steps. We tested the applicability of the matched wavelet for identifying this kind of bearing failure. The Morlet wavelet was used as a benchmark for evaluating the performance of the matched wavelet since many publications show its successful application. It was shown that for analysing exponentially or near-exponentially damped vibration responses like the vibration produced by spalling on the inner race of a deep-groove ball bearing, the Morlet wavelet is a reasonable choice and gives better results than the Meyer wavelet.
Keywords: Wavelet analysis; bearing vibration analysis; wavelet matching; condition monitoring
1 Introduction
It is known that the Discrete Fourier Transform (DFT) is most suitable for testing finite-energy, periodic, time-discrete quantities. The reason why the DFT is still used effectively for the vibration analysis of bearings is that most of the complex
vibrations show periodicity in time. This periodicity is closely related to the geometry and rotational speed of the bearing. Thus, the vibration components can be determined with reasonable accuracy.
Wavelet Analysis is a relatively new tool that has been successfully applied in many areas of science. In recent years, several researchers have proposed the use of wavelet transform to test bearing vibration signals where the FFT was ineffective [1-3]. Some scientists recommend the use of existing wavelet basis functions, while others create new wavelet bases. The proposed methods also differ in applied analysis techniques as well. These are Continuous Wavelet Transform (CWT), Discrete Wavelet Transform (DWT), Wavelet-packet analysis, Matching Pursuit, etc.
Junsheng et al. [4] used an impulse response wavelet to analyse faults in a roller bearing with CWT. Their wavelet is simply an exponentially damped sinusoid.
Jiang et al. [5] proposed a hybrid method that combines the Morlet wavelet filter and sparse code shrinkage. Kankar et al. [6] compared three machine learning techniques for bearing fault diagnosis. These methods were the support vector machine (SVM), the artificial neural network (ANN) and self-organizing maps (SOM). For feature extraction they used a Meyer and Morlet wavelet. They found that the Meyer wavelet performs better with SVM classifier. Sheen [7] effectively applied the Morlet wavelet in the envelope detection for the vibration signal and found it also useful in the defect diagnosis of bearing vibrations. The application of the complex Morlet wavelet with SVM classifier is suggested in [8] for fault diagnosis of ball bearings having localized defects on various bearing components. Liu et al. [9] suggested an automatic feature extraction algorithm for bearing fault diagnosis using a correlation filter-based matching pursuit.
In wavelet analysis the choice of a wavelet is crucial from an analysis point of view. The analysing wavelet is usually independent of the signal investigated.
Since the wavelet transformation and its derived energy distributions use convolution, one can obtain the highest output from these transformations when the signal and the wavelet are similar.
Over the past decade many publications [10-13] have considered creation of a matching wavelet to a given signal. Tewfik et al. [10] worked out a design method that matches a wavelet to the time domain form of a signal. Chapa and Rao [11]
developed an algorithm that searches for a matching wavelet in frequency domain.
Their method is capable of designing Meyer wavelets that approximate the wavelet amplitude and phase spectra separately. The cost function is the minima of the Mean Squared Error (MSE), calculated from the amplitude spectra and group delay of the signal and the wavelet.
Our aim was to decide whether the Meyer or the Morlet wavelet is the better choice for analysing bearing failure.
We used Chapa and Rao’s algorithm to create a matching wavelet to the signal model of transient vibration generated by an artificially created fault on the inner race of a deep groove ball bearing. To evaluate its performance, we used the vibration data of a pitted single row deep-groove ball bearing of type 6209. This bearing was earlier subjected to an endurance test. We calculated the scalogram of the vibration data using the newly created wavelet and the Morlet wavelet as well.
Then we compared the results and found the better representation with Morlet wavelet.
2 Methods
2.1 Wavelets, Continuous Wavelet Transform and Scalogram
Wavelets [14] are functions constructed by translating and dilating a basic function called a mother wavelet Ψ (see Eq. (1)). The parameters a and b are called scale (dilation) and translation parameters, respectively. The wavelet is a normalised 1 function.
1 , 0
,
a
a b ψ t a
a
t
b(1) For Ψ(t) to be a wavelet function and to recover f(t) from its CWT, Ψ(t) should satisfy some conditions. If Ψ(t) has a zero average, i.e.:
0
ˆ 0 t dt
(2) and satisfies the admissibility condition:
ˆ
2,
d
C
(3) where CΨ is a constant that depends on the choice of wavelet, then there exists a Continuous Wavelet Transform (CWT) - Inverse Wavelet Transform (IWT) analysis-synthesis pair [15].
The CWT of a function f(t) is defined as
1 .
, dt
a b ψ t t a
f f,ψ
a b f
CWT
b,a
*
(4)
The benefit of CWT is that by changing the scale parameter, the duration and bandwidth of wavelet are both changed, providing better time or frequency resolution, but its shape still remains the same. The scale parameter can be linear or dyadic. The CWT uses short windows at high frequencies and long windows at low frequencies.
The scalogram [14], defined as the squared magnitude of CWT (Eq. (5)), always has non-negative, real-valued time-frequency (scale) distribution. This transformation conserves energy. Its resolution in the time-frequency plane depends on the scale parameter.
,
,
2
1 * dt2a b t t a
f b
a f CWT b
a f
SC
(5) Wavelets can be classified as orthogonal, bi-orthogonal, semi-orthogonal or non- orthogonal wavelets.
The Morlet wavelet is a non-orthogonal wavelet given as:
1
2 2,
4
2 2 0 0
t t
j
e e
e
t
(6) where 0 is the centre frequency.
In the case of
0 5
, Eq. (6) is simplified to (7): 1
2.
4
2 0
t t
j
e
e
t
(7)Orthogonal wavelets can be constructed from polynomial spline functions or by solving for the filter coefficients such that its Fourier transform, frequency response function, satisfies orthogonality and moment conditions [14]. Such wavelets are the Shannon, Meyer, Battle-Lemarie and Daubechies compactly supported wavelets.
The Meyer wavelet is defined through the scaling function
as: ,
0
3 4 3
1 2 2
3 cos 2
3 1 2
ˆ :
otherwise
(8)where
is a tapering function.2.2 Matching Wavelet to a Given Signal
Chapa and Rao worked out a method that is capable of designing Meyer wavelets to match band-limited signals. Their method directly matches a wavelet to the signal. The method requires some conditions on the wavelet spectrum amplitude and phase. They define the theorem of band-limited scaling function and the band- limited wavelet as necessary and sufficient conditions for an Orthonormal Multiresolution Analysis (OMRA). They introduce a method by which a wavelet in OMRA is expressed in terms of scaling function. They also derive constraints on the structure of the wavelet phase. The matching algorithm is sub-optimal in the sense that it matches the wavelet amplitude and phase independently [11].
2.2.1 Matching Wavelet Amplitude
The starting point of amplitude matching algorithm is the discrete form of the refinement equation by which a scaling function can be expressed from a wavelet:
lp
p l
k k
0
2 2
2 ˆ 2 2
ˆ
(9) They define the condition on the wavelet spectra
ˆ
to guarantee orthonormality (Eq. (11)) and an error function (Eq. (10)) as:
38
3 2
2
,
) , (
aY d W
a Y E
(10) where:
F
2 W ˆ
2Y
a = scaling coefficient.
It is shown in [11] that this wavelet construction is Meyer’s spectrum amplitude construction exactly. The algorithm searches for the extreme value of cost function in a discrete form. Using the symmetric property of the wavelet function, their design equation can be expressed in the form:
2 1 ,
2 2
0
1
l
p m
l p l
m k
Y
(11)
where:
2 2 / 3
2 3 2 /
2
l1
plk
l1m
l2 (12)1 = vector of all ones.
Equation (11) can be rewritten in matrix form as
,
1 Y
A
(13)where:
ij 0 , 1 , 2 ; i 1 , . . ., L ; j 1 , . . ., 2
l
A
This amplitude matching algorithm is a constrained optimization problem that can be solved by Lagrange multipliers [11].
The error function (Eq. (10)) can be given by
W . W
aY W aY
E W
TT
(14) Matching amplitudes are given in the form of
1 ,
1
1
W
W a
Y a A
TA A
T1 A
(15) where
1.
1
1 A A 1
A A A 1
T TT
T
W
a
(16) 2.2.2 Matching Wavelet Phase
The phase matching algorithm is similar to the amplitude matching since it is based on MSE criteria, but instead of signal phase, it uses group delay. The group delay of a signal is defined as the first order, negative derivative of the phase
d
d
.
There are specific constraints on the structure of the wavelet phase (Eq. (20)), which is expressed in terms of the phase of the scaling function [11]:
,
2 2 2
2
(17) where
is the phase of scaling function
and
is the phase of wavelet
.The wavelet phase is a symmetric, 2 periodic, even function. The method models one period of the negative of the group delay, denoted by
T
as a polynomial of order R [11]: ,
2
2
0
2
R
r
r r
T
c
(18) where
otherwise ,
0
2 1 2
, 1
1
cr = polynomial coefficients.
By replicating one period of the group delay at every 2 interval, the group delay of the wavelet is modelled as the 2 periodic polynomial of order R [11]:
k R
r
r r
k T
k k c
k
2 /
0
2
2 2 2
2
(19) The discrete form of Eq. (19) can be written as (20), where
T
2
,T P N
,N is the number of samples,
2 2
n N N
.
/20
1 2 /
2 / R 2
r P
P k
r
r
T
kT kT n
n c
n
(20) Using vector notation, the group delay is expressed as
c
B
, (21)where
.
2
2
2
,
P
k P
r r
n
T
T k T n
k n b
(22) Negatives of the group delays ψ and can be expressed in terms of
.Applying
2
1
substitution [11], we get, 2 2
1
2 2
2
m
q m T
q
m
c B B
D
(23)
. 2
1 2
m
q m
m
c B
D
(24) The matching process minimizes the weighted error (Eq. (25)) between the group delay of the wavelet
and the desired signal
F [11]. The approximation is performed only in the pass-band [11], thus a weighting function Ω (n) is calculated from the result of the amplitude matching process:
,
1 2 /
2 /
2
NN n
F
n n
n
(25) where
.
Y n
n n Y
The optimal values of the polynomial coefficients can be obtained by solving
.
c
0
(26)2.2.3 Matching a Wavelet to Signal Model of Bearing Vibration
We used the above-mentioned algorithm to create a matching wavelet to the transient vibration generated by an inner race fault – a pitting or spalling formulation – in a deep groove ball bearing. It is shown in [16] that the rolling elements generate a series of amplitude modulated transient pulses when they pass over the fault. The amplitude modulation is caused by load distribution; that is, the closer the fault is located to the load zone, the higher the amplitude of the transient is. One of these impulses can be described as:
t A t
ne C t t t
nf
ny , 0 , 2
sin 0
(27) where fn is the nth natural frequency of bearing system, C is a damping factor, A is the initial amplitude and n is an exponent influencing the rise time of the transient.
In order to create a new wavelet basis function, we used 512 samples of time domain data of a transient vibration signal (Fig. 1) described by Eq. (27) with A=68.74, n=1.851, C=6.78, and ω0=18.85.
Figure 1
Transient signal model (A=68.74, n=1.851, C=6.78, ω0=18.85)
We applied Chapa and Rao’s amplitude and phase matching algorithm [11] on the transient signal model of the bearing vibration. The results are shown in Fig. 2.
The new wavelet amplitude spectra match the amplitude spectra of the transient very well in the passband. The MSE of the matching is 0.011. For phase matching we used a 16th-degree polynomial. The matched group delay shows satisfactory characteristics in the passband. These plots are very similar to the plots introduced in [11], since the applied transient pulses are similar in both cases.
Figure 2
Matching the wavelet amplitude and the group delay in the neighbourhood of the passband (matched wavelet amplitude spectra and group delay: continuous line; amplitude spectra and group delay of the
transient: dashed line)
Combining the amplitude and phase spectra together, it is possible to obtain the time domain form of wavelet function [11]. It can be seen in Fig. 3 that the new wavelet adequately fits the original transient data.
Figure 3
Transient signal and the new wavelet in the time domain (transient signal: dotted line; wavelet:
continuous line)
Since the new wavelet basis cannot be given in closed form we gave the filter coefficients in Table 1. The time- and frequency behaviour of the wavelet and the impulse responses of filters are shown in Figs. 4 and 5.
Figure 4
The new wavelet and scaling function in the frequency and time-domain
Figure 5
The impulse responses of filters corresponding to new wavelet
From Table 1, one can conclude that these Quadrature Mirror Filters (QMF) have no compact support. Their effective support is approximately [-10, 10]. But by limiting the filter coefficients to this range, we cannot reconstruct the original data from the wavelet coefficients completely. The fewer coefficients we use, the more error we get during reconstruction. The opposite is also true; that is, more coefficients are needed to reconstruct the original data from the wavelet coefficients. Since this wavelet was created to match the vibration signal of a bearing with a specified fault, it can be used to detect this kind of defect in a bearing.
Table 1
The new wavelet Ψ(t) filter coefficients {h[k]} and {g[k]}
k h(n) g(n)
± 0 0.7948 -0.7948
± 1 0.4260 0.4260
± 2 -0.0760 0.0760
± 3 -0.0872 -0.0872
± 4 0.0474 -0.0474
± 5 0.0115 0.0115
± 6 -0.0166 0.0166
± 7 0.0068 0.0068
± 8 -0.0028 0.0028
± 9 -0.0024 -0.0024
± 10 0.0069 -0.0069
± 11 -0.0045 -0.0045
± 12 -0.0012 0.0012
3 Application of Matched and Morlet Wavelet for Detection of Spalling in a Bearing
We examined the applicability of the matched and the Morlet wavelet for detecting pitting formulation on the inner race of a deep-groove ball bearing. Our aim was to detect transient pulses generated in the bearing to indicate the presence of a pitted raceway, i.e. the time of the last possible maintenance before catastrophic failure.
Figure 6
A single row deep-groove ball-bearing of type 6209 used as test specimen
Figure 7
Pitting formulated on the inner raceway during endurance test
We used two 6209-type, single-row, deep-groove, radial ball bearings as test specimens (Fig. 6). One of them was earlier subjected to an endurance test. As a consequence of the repetitive load on the bearing elements, pitting formed on the inner ring of the bearing (Fig. 7). The other bearing was free of faults.
For the test rig we used a turning machine of E1N type. The inspected bearing was mounted on a shaft which was fixed in the chuck. We used a rod fixed in the tool post as the support. The rotating nature of the tool post made it possible to apply radial load on the outer ring of bearing, where the force was set to be perpendicular to the rotating shaft. Our primary goal was to minimize the force/vibration transmission path, since noise can come from a number of different sources. Mechanical noises can be eliminated by properly set up measurement device configuration, while electrical noises usually come from the test rig. A portion of the outer ring of bearing was machined by grinding. An accelerometer of KISTLER 8702B50 type was attached to its flat area by beeswax.
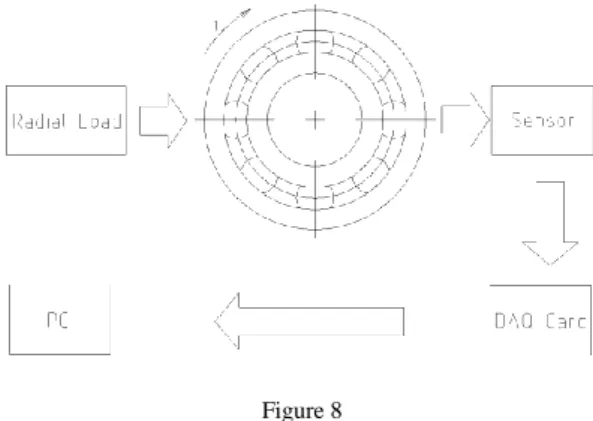
Figure 8 The measurement setup
For data acquisition (Fig. 8) we used the following devices:
HAMEG, HM507 analog-digital oscilloscope, 100 Ms/s real-time sampling rate,
KISTLER accelerometer 8702B50,
KISTLER 5108 charge amplifier,
PCI 6063E PCMCIA DAQ card, 500 ks/s sampling rate.
The DAQ card was controlled by software developed under the NI LabWindows/CVI programming environment. Validation of our software was performed using a HITACHI VG-4429 function generator and digital oscilloscope.
Sampling was performed at a constant inner ring speed of 1812 min-1. This value satisfies the specifications of American ANSI [17] and German DIN [18]
standards (1800 min-1 ±2%) concerning bearing vibration measurements. The outer ring was stationary, as it delivered radial load. The sampling frequency was set to be 20 kHz since the accelerometer’s frequency range ends at 10 kHz. The gain was set to unity.
The time series data of sampled bearing vibration signal is shown in Fig. 9 and Fig. 10.
Figure 9
Vibration data of the good bearing, fsampling=20 kHz
Figure 10
Vibration data of the pitted bearing, fsampling=20 kHz
The vibration data are the results of two distinct measurements, where we could not provide exactly the same load on the bearings. Therefore one cannot make a final decision comparing the numerical values of vibration amplitudes. These figures qualitatively indicate the vibration signals. However, the difference is obviously shown. One can notice the repetitive transient pulses with an average periodicity of 30 ms. This variation in repetition time is the result of the motion of the bearing elements, which are rolling and sliding.
Figure 11
Time-frequency distribution of signal energy of good (left) and pitted bearing (right) using the matched wavelet
The scalogram of the good bearing clearly shows the time-frequency location of transients. These pulses do not appear at each rotation. They seem to be random signals that might come from the test rig. In contrast, periodically repeating transient pulses are clearly seen on the scalogram of the pitted bearing. Their time- period and frequency can be numerically given. The application of this method reduces the incorrect evaluation of vibration data and can be a valuable supplement to conventional condition monitoring methods.
We calculated the scalogram of the same vibration data using the Morlet wavelet as well (Fig. 12). The choice of this wavelet is obvious, since many authors report its successful application to bearing vibration analysis [5, 7, 8, 15, 19-21].
Figure 12
Time-frequency distribution of signal energy of the pitted bearing using the Morlet wavelet Comparing the two time-frequency representations that were calculated using the matched wavelet (Fig. 11) and the Morlet wavelet (Fig. 12), we notice that the Morlet wavelet provided a more realistic result. The Morlet wavelet gave better energy concentration. The scalogram calculated by the matching wavelet provided better time localization, but its frequency localization is less accurate than that of the Morlet wavelet. This raises the question of the cause of better representation using the Morlet wavelet, since the matched wavelet was designed using the signal model of this type of failure in bearings.
4 Examination of the Wavelets and the Signal Model
The time and frequency domain plots of the matched and the Morlet wavelet are shown in Figs. 13 and 14. The wavelet amplitudes were normalized to facilitate comparison.
Figure 13
Time plot of the matched and the Morlet wavelet
The matched and the Morlet wavelet follow almost the same pattern between the [-1.5, 1.5] time interval, where the matched wavelet approximates the Morlet wavelet. Most of the signal energy is concentrated in this area.
Figure 14
Amplitude spectrum of the matched and Morlet wavelet
The frequency domain form of these wavelets shows their bandpass behaviour.
The bandwidth of the Morlet wavelet is narrower than that of the matched; that is, the Morlet wavelet concentrates more of the signal energy around the centre frequency. The wider bandwidth gives shorter time extent; thus the time localization ability of the matched wavelet is better. This is also clearly seen in Fig. 11. and Fig. 12.
Comparing the real part of the complex Morlet wavelet in Eq. (7) to the signal model of transient vibration produced by a pitting formulation on the inner race of
a deep groove ball bearing (Eq. (27)), one can notice the similarity. These waveforms are shown in Figs. 15 and 16. The resemblance is clearly seen.
The frequency domain form of these waveforms shows their bandpass behaviour (Fig. 16). The phase characteristics of these waveforms are also similar except for the dilation caused by unwrapping their phase.
Several papers report the successful application of the Morlet wavelet in the field of bearing vibration analysis without clarifying the reason for their choice. Since the signal model of transient pulses generated by pitting on the inner raceway of a deep-groove ball bearing was very similar to the Morlet wavelet, and since the wavelet transform and its derived energy distributions give more output when the signal and the analysing wavelet are similar, we can conclude that for analysing exponentially or near-exponentially damped vibration responses like the bearing vibration signal caused by pitting formulation on the inner raceway of a deep- groove ball bearing, the Morlet wavelet is a reasonable choice that is sure to yield good results.
Figure 15
Signal model of bearing vibration (Eq. (30)) and the Morlet wavelet in the time domain
Figure 16
Amplitude and phase spectrum of the signal model and Morlet wavelet
Conclusions
This paper showed the creation of a new wavelet that matches the transient vibration response generated by pitting on the inner race of a deep-groove ball bearing. Wavelet creation is based on Chapa and Rao’s method, where the Meyer wavelet amplitude and phase spectra are matched independently to the signal. It was shown that the new wavelet can be used for detecting transient pulses generated in a bearing. We compared the results with those calculated using the Morlet wavelet since many application reported its successful application. We found the Morlet wavelet superior to this matched wavelet in representing transient signals of bearing vibration where pitting is formulated in the inner raceway of a deep groove ball bearing. It was shown that the signal model of this kind of bearing failure is very similar to the Morlet wavelet; thus its scalogram gives a more accurate time-frequency representation than the Meyer wavelet.
Acknowledgement
This research was carried out as part of the TAMOP-4.2.1.B-10/2/KONV-2010- 0001 project with support by the European Union, co-financed by the European Social Fund.
References
[1] CJ Li, J Ma, Wavelet Decomposition of Vibrations for Detection of Bearing-localized Defects. NDT & E International Vol. 30(3) (1997) pp.
143-149
[2] S. Prabhakar, A. R. Mohanty, A. S. Sekhar, Application of Discrete Wavelet Transform for Detection of Ball Bearing Race Faults, Tribology International, Vol. 35 (2002) pp. 793-800
[3] N. G. Nikolaou, A. I. Antoniadis, Rolling Element Bearing Fault Diagnosis Using Wavelet Packets, NDT & E International, Vol. 35 (2002) pp. 197- 205
[4] C. Junsheng, Y. Dejie, Y. Yu., Application of an Impulse Response Wavelet to Fault Diagnosis of Rolling Bearings, Mechanical Systems and Signal Processing, Vol. 21 (2007) pp. 920-929
[5] W. He, Z. Jiang, K. Feng, Bearing Fault Detection Based on Optimal Wavelet Filter and Sparse Code Shrinkage, Elsevier - Meausrement, Vol.
42 (2009), pp. 1092-1102
[6] P. K. Kankar, S. Sharma, S. P. Harsha, Fault Diagnosis of Ball Bearings Using Continuous Wavelet Transform, Elsevier - Applied Soft Computing, Vol. 11 (2011) pp. 2300-2312
[7] Yuh-Tay Sheen, On the Study of Applying Morlet Wavelet to the Hilbert Transform for the Envelope Detection of Bearing Vibrations, Mechanical Systems and Signal Processing, Vol. 23 (2009) pp. 1518-1527
[8] P. K. Kankar, S. Sharma, S. P. Harsha, Rolling Element Bearing Fault Diagnosis Using Wavelet Transform, Elsevier - Neurocomputing, Vol. 74 (2011) pp. 1638-1645
[9] X. Liu, L. Bo, X. He, M. Veidt, Application of Correlation Matching for Automatic Bearing Fault Diagnosis, Journal of Sound and Vibration, Vol.
331 (2012) pp. 5838-5852
[10] A. H. Tewfik, D. Sinha, and P. Jorgensen, On the Optimal Choice of a Wavelet for Signal Representation, IEEE Transactions on Information Theory, Vol. 38, pp. 747-765, March 1992
[11] J. O. Chapa, R. M. Rao, Algorithms for Designing Wavelets to Match a Specified Signal, IEEE Transactions on Signal Processing, Vol. 48, No. 12, December 2000, pp. 3395-3406
[12] N. Tandon, A. Choudhury, An Analytical Model for the Prediction of the Vibration Response of Rolling Element Bearings Due to a Localized Defect, Journal of Sound and Vibration, Vol. 205 (1997) pp. 275-292 [13] A. Gupta, S. D. Joshi, Surendra Prasad, On a New Approach for Estimating
Wavelet Matched to Signal. In Proceedings of Eight National Conference on Communications, Bombay, January 2002
[14] S. Mallat, A Wavelet Tour of Signal Processing, Second Edition, Academic Press, 1998
[15] J. C. Goswami, A. K. Chan, Fundamentals of Wavelets, John Wiley &
Sons, Inc., 1999
[16] L. Tóth, Identification of a Transient Vibration Signal Model, microCAD 2008, International Science Conference, Section J: Electrotechnics and Electronics, pp. 83-88
[17] American National Standard ANSI/AFBMA Std 13-1970, ANSI B3.13- 1970, Rolling Bearing Vibration and Noise (Methods of Measuring) [18] Deutsches Institut für Normung DIN 5426, Laufgeräusche von Wälzlagern,
Prüfverfahren
[19] R. Rubini, U. Meneghetti, Application of the Envelope and Wavelet Transform Analyses for the Diagnosis of Incipient Faults in Ball Bearings, Mechanical Systems and Signal Processing, Vol. 15 (2001) pp. 287-302 [20] S. Prabhakar, A. R. Mohanty, A. S. Sekhar, Application of Discrete
Wavelet Transform for Detection of Ball Bearing Race Faults, Tribology International, Vol. 35. (2002) pp. 793-800
[21] N. G. Nikolaou, A. I. Antoniadis, Demodulation of Vibration Signals Generated by Defects in Rolling Element Bearings Using Complex Shifted Morlet Wavelets, Mechanical Systems and Signal Processing, Vol. 16 (2002) pp. 677-694