117
D-Glucose
Determination with Hexokinase and Glucose-6-phosphate Dehydrogenase**
Milton W. Slein Principle
The optical method for the determination of glucose-6-phosphate o n which the following method is based was developed by O. Warburg and his collaborators. Hexokinase catalyses the phosphorylation of glucose by adenosine triphosphate ( A T P ) :
(1) Glucose -f- A T P — — > glucose-6-phosphate + A D P
Glucose-6-phosphate is oxidized in the presence of triphosphopyridine nucleotide (TPN) by glucose- 6-phosphate dehydrogenase:
(2) Glucose-6-phosphate + T P N + > 6-phosphoglucono-S-lactone + T P N H + H
+
For all practical purposes, both reactions proceed stoichiometrically and quantitatively, although reversibility has been demonstrated under special conditions
1 - 3
> . The T P N H arising in equation (2) is determined spectrophotometrically at 340 or 366 m\i and serves as a measure of the glucose- 6-phosphate formed from glucose in equation (1).
Reagents
1. Zinc sulphate, Z n S 0 4 - 7 H 2 0 , A. R.
2. Barium hydroxide, Ba(OH) 2 • 8 H 2 0 , A. R.
3. Tris-hydroxymethyl-aminomethane, tris 4. Magnesium chloride, M g C l 2 - 6 H 2 0 , A. R.
5. Serum albumin
crystalline.
6. Adenosine triphosphate, ATP
disodium salt, ATP-Na2H2-3 H2O; commercial preparation, see p. 1006.
7. Triphosphopyridine nucleotide, TPN
monosodium salt, T P N - N a- H 2 ; commercial preparation, see p. 1029.
8. Hexokinase, HK
crystalline, from baker's yeast; commercial preparation, see p. 983.
9. Glucose-6-phosphate dehydrogenase, G6P-DH
purified from brewer's yeast; commercial preparation, see p. 975.
Purity of the e n z y m e preparations
Hexokinase: The preparation need not be crystalline, but must be relatively free from compounds which interfere with the glucose determination. Sometimes the preparations still contain glucose,
*) For the determination with hexokinase, pyruvic kinase and lactic dehydrogenase, see "Gly
cogen", p. 59.
1) / . L. Gamble jr. and V. A. Najjar, Science [Washington] 120, 1023 [1954]; J. biol. Chemistry 217, 595 [1955].
2) S. Kaufman, J. biol. Chemistry 216, 153 [1955].
*) B. L. Horecker and P. Z. Smymiotis, Biochim. biophysica Acta 12, 98 [1953].
118 Section B: Estimation of Substrates
which has been added as a stabilizing agent during purification
4
.
5
). It can be removed from highly purified hexokinase by dialysis. The least interference from contaminating enzymes occurs, if the specific activity of the hexokinase preparation used approaches that of the crystalline enzyme (ca.
3 0 0 0 B S C C
4
) units/mg. or 1400 K M
5
) units/mg.*)). Hexokinase of this purity catalyses the phos
phorylation of ca. 32 mg. glucose/min./mg. protein at 30°C and p H 8.0. A n improved method for the purification of hexokinase which results in a yield of crystalline enzyme representing 15 % of the activity of the crude extract (instead of 1 % by other m e t h o d s
4
.
5
) ) is described by Darrow and Colo
wick^.
Glucose-6-phosphate dehydrogenase: The enzyme must be essentially free from 6-phosphogluconic dehydrogenase, otherwise with known glucose concentrations values for T P N H will be too high and reaching of the end-point will be delayed. On the other hand addition of a large amount of 6-phosphogluconic dehydrogenase would increase the sensitivity of the determination, as 2 moles of T P N H would be formed for each mole of glucose. T o obtain a G 6 P - D H preparation sufficiently free from 6-phosphogluconic dehydrogenase activity, the purification should be carried through the step involving precipitation at p H 4.5 in the method of Romberg
1
^or elution from a starch-celite column in the method of Glaser and Brown^.
The presence of enzymes which catalyse the oxidation or destruction of T P N H is indicated when the optical density reaches a maximum value and then decreases. Normally a stable end-point for T P N reduction according to equation (2) is obtained in 5—20 min.
Phosphoglucose isomerase and phosphomannose isomerase do not usually interfere with the deter
mination of glucose except to delay the attaining of an end-point, since part of the glucose-6-phosphate is temporarily and reversibly converted to fructose and mannose-6-phosphate respectively. However- if phosphofructokinase is also present, then low values for glucose are obtained owing to the irreversible formation of fructose diphosphate. Both isomerases interfere with the determination when the sample contains fructose-6-phosphate, mannose-6-phosphate, fructose or mannose, because these compounds are converted to glucose-6-phosphate. Similarly, invertase interferes when the sample contains sucrose. If the enzyme preparations are contaminated with phosphoglucomutase the presence of glucose-1-phosphate in the sample causes interference. However, phosphate esters are removed by the B a ( O H ) 2 and Z n S 0
4
used in the deproteinization procedure. It is possible to estimate both hexose monophosphates and glucose by use of a deproteinization procedure which does not remove the phosphorylated compounds (see "Other methods of deproteinization" and "Other Determinations").Phosphorylase does not interfere with the glucose determination as long as, phosphoglucomutase, inorganic phosphate, arsenate or polysaccharides (starch, glycogen) are absent. Polysaccharides can be removed by deproteinization with a mercuric salt and H
2
S (see "Other methods of deproteinization"). Phosphate buffers should be avoided or be diluted out, since phosphate ions inhibit G 6 P - D H 8 - i o ) . Small amounts of arsenate or phosphate are removed by deproteinization with B a ( O H ) 2 and Z n S 0
4
.In order to check the reliability of the glucose assay system it is tested for the possible presence of the following enzymes: 6-phosphogluconic dehydrogenase (with glucose); enzymes which oxidize
*) Conversion to other units, see p. 545.
4
) L. Berger, M. W. Slcin, S. P. Colowick and C. F. Cori, J. gen. Physiol. 29, 379 [1946].
5) M. Kunitz and M. R. McDonald, J. gen. Physiol. 29, 393 [1946]; in S. P. Colowick and N. O. Kaplan:
Methods in Enzymology. Academic Press, N e w York 1955, Vol. I, p. 269.
6
) R. A. Darrow and S. P. Colowick in S. P. Colowick and TV. O. Kaplan: Methods in Enzymology.
Academic Press, N e w York, 1962, Vol. V, p. 226.
7) A. Kornberg, J. biol. Chemistry 182, 805 [1950]; in S. P. Colowick and N. O. Kaplan: Methods in Enzymology. Academic Press, N e w York 1955, Vol. I, p. 323.
8) L. Glaser and D. H. Brown, J. biol. Chemistry 216, 67 [1955].
9) H. Theorell, Biochem. Z. 275, 416 [1935].
io) E. Negelein and E. Haas, Biochem. Z. 282, 206 [1935].
1.2. c D-Glucose 119
or destroy T P N H (with glucose or glucose-6-phosphate); phosphoglucose and phosphomannose iso
merase (with fructose and mannose, which are phosphorylated by A T P and yeast hexokinase)
u
) ; phosphoglucomutase (with glucose-1-phosphate); invertase (with sucrose).
Preparation of Solutions
I. Zinc sulphate (ca. 4.5% w/v Z n S 0 4 - 7 H 2 0 ) :
Dissolve ca. 4.5 g. Z n S 0 4 - 7 H 2 0 in distilled water and make up to 100 ml.
II. Barium hydroxide (ca. 0.3 N):
Dissolve ca. 4.7 g. Ba(OH) 2 -8H 2 0 in distilled water and make up to 100 ml. Store in a bottle protected from atmospheric C 0 2 by means of a soda-lime tube attached to the stopper. For convenience in drawing off small quantities of solution it is best stored in a Mariotte bottle.
III. Tris buffer (ca. 0.1 M; pH 8.0):
Dissolve 1.21 g. tris-hydroxymethyl-aminomethane (buffer or A. R. quality, or else recrystallized
1 2 , 1 3
>) in distilled water, add 5.36 ml. 1.0 N HC1 and make up to 100 ml.
IV. Magnesium chloride (ca. 0.1 M):
Dissolve ca. 0.5 g. M g C l 2 - 6 H 2 0 in distilled water and make up to 25 ml.
V. Serum albumin:
a) Dissolve ca. 20 mg. crystalline serum albumin in 5 ml. distilled water. This serves as a protective protein for hexokinase at high dilutions
4
*.
b) Dilute solution (a) 40-fold with distilled water.
VI. Adenosine triphosphate (ca. 0.01 M ATP):
Dissolve ca. 60 mg. ATP-Na 2 H 2 • 3 H 2 0 in distilled water and make up to 10 ml.
VII. Triphosphopyridine nucleotide (ca. 3 x 1 0 -3
M |3-TPN):
Dissolve ca. 13 mg. TPN-NaH 2 in distilled water and make up to 5 ml.
VIII. Hexokinase, HK (ca. 300 BSCC 4
) units or 140 K M 5)
units/ml.):
1 BSCC unit catalyses the phosphorylation of ca. 10 ug. glucose in 1 min. at 30°C, and pH 8.0. Dilute 1 mg. of crystalline protein (3000 BSCC units) or its equivalent with 10 ml. serum albumin solution (Vb). The presence of serum albumin as a pro
tective protein 4
* may not be essential, especially with less highly purified enzyme preparations. However, its presence is advisable at the high dilution of the test system.
IX. Glucose-6-phosphate dehydrogenase, G6P-DH (ca. 2 K 7)
units or 1 GB 8
> unit/ml.):
1 GB unit catalyses the oxidation of 1 umo\o glucose-6-phosphate in 1 min. at 25° C and pH 8.0. Dilute 0.1 mg. of the purified enzyme ( = 7 GB units) or its equivalent in distilled water and make up to 7 ml.
Stability of the s o l u t i o n s
The solutions of the inorganic reagents may be stored at room temperature if well stoppered. Store buffer at 5°C, it is usable as long as no bacterial growth is evident. Lyophilized preparations of hexokinase and G 6 P - D H retain their activity for long periods when kept in a desiccator at 5°C.
The enzyme solutions may be stored for several weeks at — 15°C without much loss of activity. They should be carefully thawed without excessive shaking and be kept in an ice bath while in use. The remaining solutions are stable for long periods at — 15°C.
n) M. W. Skin, G. T. Cori and C. F. Cori, J. biol. Chemistry 186, 763 [1950].
12) T. P. Wang, H. Z. Sable and / . O. Lampen, J. biol. Chemistry 184, 17 [1950].
13) J. H. Fossum, P. C. Markunas and A. Riddick, Analytic. Chem. 23, 491 [1951].
120 Section B : Estimation of Substrates
Procedure
Experimental material
The method may be used for the determination of glucose in blood, plasma, serum, tissue extracts, or enzyme systems which form or utilize glucose. In the following description the determination of glucose in blood will be used as an example.
D e p r o t e i n i z a t i o n
Preliminary remarks: Deproteinization with Ba(OH)2 and ZnSC>4 was developed for the preparation of blood samples for the determination of reducing s u g a r
1 4 1 5
) . Careful use of these reagents allows the removal of protein and phosphate esters from the sample to be analysed. Excess ZnSC>4 inhibits the enzymatic assay system, excess Ba(OH)2 leads to in
complete deproteinization. With blood and serum this is indicated by foaming when the sample is shaken, and by the presence of haemoglobin or an opalescence in the supernatant after centrifuging the sample. If the experimental material contains ions which precipitate with ZnSC>4 or Ba(OH)2, then it is necessary to choose ratios of both reagents which will compensate for the loss. The concentration of the Ba(OH)2 and ZnSC>4 solutions must be so adjusted that, when a mixture of equal volumes of both reagents is diluted with 10 volumes of water, the supernatant fluid is neutral (about pH 7). The ratio of ZnSC>4: Ba(OH)2 used in the deproteinization may then be varied from about 1:1 to 1 :1.1, so that the supernatant fluid is about pH 7.0—7.5 (glass electrode) and therefore does not interfere with the enzymatic assay method. It is advisable to check whether the deproteinized sample inhibits the enzyme system by preparing a control containing added glucose. There must be no marked delay in reaching an end-point. Blood and serum samples appear to contain about 10% less glucose when analysed by the specific enzymatic determination method than when the same deprotein
ized samples are analysed by the copper reduction method of Nelson 1
^. This may be due to the presence of other reducing substances in the blood sample, since both methods give the same results with a standard glucose solution.
Method: Mix
0.1 ml. blood and 1.5 ml. distilled water in a centrifuge tube. To this add
0.2 ml. Ba(OH) 2 solution (II), mix well and add
0.2 ml. Z n S 0 4 solution (I).
After thorough mixing, centrifuge for ca. 5 minutes at ca. 500 g. The supernatant must be clear and colourless. If particles should be floating on the surface of the liquid, filter solution, or withdraw a sample using a pipette, the tip of which carries a very small amount of twisted cotton wool.
Other methods of deproteinization: Biological samples or enzymatic reaction mixtures which are to be analysed for sugar phosphates and free sugars can be deproteinized by the addition of sufficient HCIO4 to give a final concentration of 3 — 5 %(w/v). The supernatant is neutralized with KOH to remove most of the perchloric acid as the insoluble KCIO4.
14) N. Nelson, J . biol. Chemistry 153, 375 [1944].
15) M. Somogyi, J. biol. Chemistry 160, 69 [1945].
I.2.c
D-Glucose 121 Since the trichloroacetate ion inhibits G6P-DH it is not advisable to use this acid for de
proteinization. However, in certain cases it is possible to remove most of the trichloroacetic acid from the deproteinized sample by ether extraction or decomposition by boiling, as long as the products of the decomposition of acid or heat labile substances do not interfere with the glucose assay.
Deproteinization by addition of an equal volume of 2.5 % (w/v) HgCb in 0.5 N HC1 (Schenck's reagent i
6
*), followed by filtration, treatment with H2S, filtration, aeration and neutralization, does not remove sugar phosphates, but the precipitated HgS adsorbs polysaccharides like glycogen
17
*.
The use of ca. 0.2 volumes of another mercury reagent (West's reagents 1 8
*: 28% w/v
Fe2(SC>4)3 • H 2 O
+ 34% w/v
HgSC>4in 1.5 N
H 2 S O 4 )removes protein, polysaccharides and hexosephosphates, when solid BaCC>3 (A. R.) is added with vigorous shaking to a mixture of the reagent and the sample, until the solution gives a neutral reaction with bromothymol- blue paper. The filtrate is acidified with a trace of
H 2 S O 4 ,treated with H 2 S, filtered, aerated and neutralized.
Spectrophotometric m e a s u r e m e n t s
Preliminary remarks: To increase the accuracy of the reagent additions use pipettes with drawn-out, ground tips. The solutions are mixed with a thin glass rod which has been flattened at one end to form a disc. If it is necessary for any reason to take more than 1.2 ml. of the sample, then the concentrations of the reagents may be correspondingly increased. A mixture of solutions III—VI may be prepared if several samples are to be analysed. Veronal or glycylglycine buffer may be used instead of tris buffer, but phosphate ions inhibit G6P- DH
8 - 1
*)).
Method: Wavelength: 340 mu; light path: 1 cm.; final volume: 3.0 ml.
Pipette solutions into the cuvettes in the given order and before addition of the enzymes mix well:
1.2 ml. deproteinized sample or distilled water 1.0 ml. buffer (solution III)
0.2 ml. MgCl 2 solution (IV) 0.1 ml. albumin solution (Va) 0.1 ml. ATP solution (VI) 0.1 ml. hexokinase solution (VIII) 0.1 ml. G6P-DH solution (IX).
After addition of the enzymes mix again and read initial optical density Ei against water. Add 0.2 ml. TPN solution (VII)
mix, read optical density at ca. 1 min. intervals until stable end-point E2 is reached. Once it has been established in a control experiment that after reaching a maximum value, no decrease in the optical density occurs within a reasonable period, several determinations may be set up at the same time. Their final optical densities are then read after a fixed time has elapsed.
16) F. Schenck, Prlugers Arch. ges. Physiol. Menschen Tiere 55, 203 [1894J.
17) G. T. Cori and J. Lamer, J. biol. Chemistry 188, 17 [1951].
13) A. Steiner, Proc. Soc. exp. Biol. Med. 32, 968 [1935].
122
Section B: Estimation of Substrates
Calculations
The initial optical density Ei is corrected for the volume change caused by the addition of T P N solution, by multiplying by 2.8/3.0. If an increase in optical density on addition of T P N solution has been observed in a control cuvette containing distilled water instead of the sample, then this value is added to the corrected Ei. The resulting value E i ' is subtracted from the final optical density E2.
The difference AE is divided by 0.0115 to obtain the \ig. glucose/3 ml. reaction mixture. The factor 0.0115 is calculated from the molecular weight of glucose and the extinction coefficient for T P N H 0 = 6.22 X 10
6
c m
2
. / m o l e with 1 cm. light path and 3 4 0 m ( j i )
1 9 )
. This corresponds to an optical density of 2.07 for each (i.mole T P N reduced or glucose phosphorylated (also refer to p. 36).
Example
Rabbit blood was deproteinized as described above to give a 1 : 20 dilution of blood. 0.2 ml. ( + 1.0 ml.
distilled water) of this was taken for analysis. Ei before addition of T P N solution: 0.018. Corrected for 0.2 ml. T P N solution:
— X 0.018 = 0.017 2 8 3.0
The increase in optical density o n addition of T P N solution to a control containing water instead of sample: 0.010.
Ei' = 0.017 + 0.010 = 0.027. Final optical density E
2
= 0.142.A E = E
2
- E ' i = 0 . 1 4 2 - 0 . 0 2 7 = 0.115 0.115= 10 uig. glucose/0.2 ml. blood ( 1 : 2 0 dilution) 0.0115 ^
This is equivalent to 1 mg. glucose/ml. whole blood or 100 mg. %.
Range of the Method
Under the stated conditions the amount of glucose which can be measured depends o n the T P N concentration. This is sufficient for estimation of 0.6 pimoles (108 fig.) glucose. However, with this amount of glucose the time for reaching a final optical density would be unduly delayed, as towards the end of the reaction the enzymes would no longer be saturated with respect to T P N
2
°) and A T P
2 l
\ Furthermore, the final optical density E
2
(ca. 1.242) would lie on the portion of the spectrophotometer scale from which it is not possible to obtain accurate readings. Suitable E2
values are obtained over the range of 5 ug. (AE = 0.057 in ca. 5 min.) to 60 ug. (AE = 0.690 in ca. 20 min.) glucose. Of course the range of the method can be extended by use of more T P N , A T P and enzymes. The time for reaching an end-point may also be shortened by use of larger quantities of the enzymes.Other Determinations
The same system without hexokinase or A T P can be used for the determination of glucose-6-phosphate.
Other hexose monophosphates (glucose-1-phosphate, fructose-6-phosphate (see p. 134), mannose- 6-phosphate) can be assayed if sufficient amounts of the corresponding auxiliary enzymes are added, namely, p h o s p h o g l u c o m u t a s e
2 2
) , phosphoglucose i s o m e r a s e
2 3
.
2 4
) and phosphomannose 19) B. L. Horecker and A. Romberg, J . biol. Chemistry 775, 385 [1948].
2
«) The dissociation constant for T P N with G 6 P - D H is ca. 2 X 10~5 M
8 ) 2 1 )
.The dissociation constant for A T P with hexokinase and glucose as substrate is ca. 1.5 X 10
4
M
1 1 ) 22
.) V. A. Najjar, J. biol. Chemistry 175, 281 [1948]; in S. P. Colowick and N. O. Raplan: Methods in Enzymology. Academic Press, N e w York 1955, Vol. 1, p. 294.
2 3
) (from muscle) M. W. Slein in S. P. Colowick and N. O. Raplan: Methods in Enzymology. Aca
demic Press, N e w York 1955, Vol. I, p. 304.
2
4
) (from yeast) E. Noltmann and F. H. Bruns, Biochem. Z. 331, 436 [1959].
I.2.c D - G l u c o s e 123
i s o m e r a s e
2 5
. 2 6 ) , Similarly fructose and mannose may be determined after phosphorylation with hexokinase and A T P to give fructose and mannose-6-phosphate, respectively. Sucrose can be assayed after the addition of invertase to the complete system. If phosphoglucose isomerase is added to this system then the sensitivity of the sucrose assay is doubled since for each mole of fructose a mole of T P N will be reduced. Other oligosaccharides can be analysed similarly with the aid o f hydrolytic enzymes. The method is also suitable for the determination of A T P (see p. 543) and T P N .
Sources of Error
These have already been described in the sections o n "Purity of the enzyme preparations" and
" Deproteinization".
Specificity
In the absence of contaminating enzymes the method is specific for glucose and glucose-6-phosphate.
The latter is removed by deproteinization with Ba(OH)2 + Z n S 0
4
or with West's reagent.Other Methods for the Enzymatic Determination of Glucose
Glucose can also be assayed with glucose oxidase (glucose aerodehydrogenase, notatin) 2 7 , 2 8 ) (
s e
ebelow) or glucose dehydrogenase
29
K
Determination with Glucose Oxidase and Peroxidase
Hans-Ulrich Bergmeyer and Erich Bernt
Glucose oxidase ( G O D ) specifically oxidizes fi-D-glucopyranose
1 - 5
). A t 20° C a-D-glucose is oxidized 150 times more slowly
5
). In spite o f this, the enzyme can be used to determine glucose in solutions containing an equilibrium mixture of the isomers, because even highly purified G O D preparations still usually contain mutarotase
6
). A l s o the time taken for the reaction is so chosen that all the a-glucose is oxidized.
Glucose was first determined with G O D manometrically
4
) and then later c o l o r i m e t r i c a l l y
7 - 9
) . The optimum conditions, limits of error and range of application for the routine determination of
25) (from muscle) M. W. Slein in S. P. Colowick and N. O. Kaplan: Methods in Enzymology. Aca
demic Press, N e w York 1955, Vol. I, p. 299.
26) (from yeast) E. Noltmann and F. H. Bruns, Biochem. Z. 330, 514 [1958].
27) C . E. Coulthard, R. Michaelis, W. F. Short, G. Sykes, G. E. H. Skrimshire, A. F. B. Standfast, J. H. Birkinshaw and H. Raistrick, Biochem. J. 39, 24 [1945].
28) R. Bentlev in S. P. Colowick and N. O. Kaplan: Methods in Enzymology. Academic Press, N e w York 1955, Vol. I, p. 340.
2 9 )
H. J. Strecker in S. P. Colowick and N. O. Kaplan: Methods in Enzymology. Academic Press, N e w York 1955, Vol. I, p. 335.
1) W. Franke and M. Deffner, Liebigs A n n . Chem. 541, 117 [1939].
2) D. Keilin and E. F. Hartree, Biochem. J. 39, 293 [1945].
3) D. Keilin and E. F. Hartree, Biochem. J. 42, 221 [1948].
4
> D. Keilin and E. F. Hartree, Biochem. J. 42, 230 [1948].
5
> D. Keilin and E. F. Hartree, Biochem. J. 50, 331 [1952].
6) D. Keilin and E. F. Hartree, Biochem. J. 50, 341 [1952].
7) E. R. Froesch and A. E. Renold, Diabetes 5, 1 [1956].
8) A. S. Keston, Abstracts of Papers, 129th Meeting Amer. chem. Soc. 1956, 31 C.
9) / . D. Teller, Abstracts of Papers, 130th Meeting Amer. chem. Soc. 1956, 6 9 C .
124 Section B : Estimation of Substrates
glucose in blood have been extensively studied (e.g. refer t o
1 0 - 1 6
) ) . With the colorimetric method the measurements can be made with simple colorimeters. A s no dissacharides are present in blood the
"true glucose" value is obtained even with impure glucose oxidase preparations (see p. 130 and 974).
For the analysis of mixtures o f sugars it is necessary to use highly purified enzyme preparations.
Glucose in blood, urine (e.g.
17
)), corn s y r u p
1 8
) , hydrolysates of polysaccharides
1 9
) and fermentation liquors
2
°) has been determined with glucose oxidase.
Principle
Glucose oxidase ( G O D ) catalyses the reaction:
(1) f}-D-Glucose + H
2
0 -f- O2 > D-gluconic acid + H2O2 S-Gluconolactone which is first formed is spontaneously hydrolysed to D-gluconic a c i d2 1
) . The hydrogen peroxide is decomposed in the indicator reaction (2) with peroxidase ( P O D ) and the oxygen liberated oxidizes a hydrogen donor DH2 (e.g. o-dianisidine) to a coloured derivative D :
(2) H
2
02
+ D H2
> 2 H2
0 + DThe amount of the dye D formed from DH2 is a measure of the glucose oxidized. The absorption spectrum of the dye formed from o-dianisidine has a wide maximum around 460 mfji. The extinction coefficient depends on the experimental conditions, therefore the measured optical density is related to a glucose standard. The measurements are made at 436 m\i or an adjacent wavelength.
The method described here is based on the procedure of Hugget and Nixon
2 2
) (other authors use, for example, 0-toluidine
2 3
) or 2.6-dichlorophenolindophenol
2 4
) as the dye).
Reagents
1.
Sodium dihydrogen phosphate,
N a H 2 P 0 4 - 2 H 2 02. Disodium hydrogen phosphate, Na2HP04-2H20 3. D-Glucose, A. R.
4. 0-Dianisidine hydrochloride
commercial preparations of o-dianisidine (free base) are usually very coloured. It can be recry- stallized from 25 % acetone with the addition of charcoal. T o prepare the hydrochloride dissolve 10 g. of the recrystallized base in 200 ml. distilled water + 8.5 ml. cone. HC1 and add about 1 000 ml. acetone. Filter off the crystals, wash with acetone and ether, and dry in vacuo over K O H
5. Perchloric acid, A. R., sp. gr. 1.67; ca. 70% (w/w)
10) H. Schon and B. Bucke, Arztl. Lab. 4, 49 [1958].
n) C. H. Mellinghoff and W. Kohleick, Med. Klin. 54, 712 [1959].
12
) /. Eismann, Dtsch. med. J. 10, 534 [1959].
13) / . E. Middleton, Brit. med. J. 4, 824 [1959].
14) L. Kramer Jacobsen, Scand. J. clin. Lab. Invest. 12, 76 [I960], is) H. Siidhofand P. K. Riegel, Klin. Wschr. 38, 138 [I960].
16) E. Raabo and T. C. Terkildsen, Scand. J. clin. Lab. Invest. 12, 402 [I960].
17) V. Marks, Clin. chim. Acta 4, 395 [1959].
18) R. L. Whisder, L. Hough and / . W. Hylin, Analytic. Chem. 25, 1215 [1953].
1
9
) H. H. Schlubach and K. Repenning, Angew. Chem. 71, 193 [1959].
2
0) M. Damodaran and K. Singh, J. sci. Ind. Res. (India) 13B, 419 [1954].
21
) R. Bentley and A. Neuberger, Biochem. J. 45, 584 [1949].
22) A. St. G. Hugget and D. A. Nixon, Biochem. J. 66, 12P [1957].
23) L. L. Salomon and / . E. Johnson, Analytic. Chem. 31, 453 [1959].
24) L. A. Dobrick, J. biol. Chemistry 231, 403 [1958].
I.2.c D-Glucose
125 6. Glucose oxidase, GOD
dry powder; commercial preparation, see p. 9 7 4 . Crude preparations often contain insoluble ma
terial which should be centrifuged or filtered off.
7. Peroxidase, POD
dry powder; commercial preparation, see p. 9 9 0 .
Purity of the e n z y m e preparations
For the procedure described here, especially because o f the ratio of G O D : POD used, the POD preparation should have a k 4 value*) of at least 3 5 0 0 0 , which corresponds to a purpurogallin number**) of about 7 0 . The GOD should have a QQ
2
of > 7 0 0 0 ( s e e p. 9 7 4 ) . The catalase content of the G O D preparation should be below 3 units ***)/mg.
If the sample to be analysed contains starch, sucrose, lactose or maltose, then the GOD prepar
ation should not contain more than 0.1 % amylase, invertase, lactase or maltase (relative to the specific activity of the GOD).
Preparation of Solutions ****) (for ca. 20 determinations) Prepare all solutions with fresh, doubly distilled water.
I. Buffer-enzyme mixture (0.12 M phosphate; pH 7; 40 ag. POD/ml.; 250 ag. GOD/ml.):
Dissolve 2.07 g. N a 2 H P 0 4 - 2 H 2 0 , 1.09 g. N a H 2 P 0 4 - 2 H 2 0 , 6mg. POD and 38 mg.
GOD in doubly distilled water and make up to 150 ml.
II. Chromogen (5 mg. 0-dianisidine hydrochloride/ml.):
Dissolve 10 mg. o-dianisidine hydrochloride in doubly distilled water and make up to 2 ml.
III. Glucose reagent:
Add 0.5 ml. solution II to 50 ml. solution I with vigorous stirring.
IV. Glucose standard solution (91 ag. D-glucose/ml.):
Commercially available glucose contains ca. 9% moisture. Dissolve 100 mg. glucose in doubly distilled water, add 25 ml. perchloric acid (sp. gr. 1.67; ca. 70% w/w) and make up to 1000 ml. For each new standard solution check the glucose concentration with hexokinase and glucose-6-phosphate dehydrogenase (see p. 117).
V. Perchloric acid (ca. 0.34 M):
Dilute 2.9 ml. 70% perchloric acid to 100 ml. with doubly distilled water.
*) According t o
2 5
) k
4
= — — X — . Where a0
= initial concentration of guaiacol in the assay, ao x e te = enzyme concentration, x/t = hydrogen peroxide decomposed per sec.
**) According t o
2 6
) the purpurogallin number is the amount of purpurogallin (mg.) which is formed from pyrogallol by 1 mg. peroxidase in 500 ml. assay mixture in 5 min. at p H 7.0.
***) According t o
2 7
) a unit is the amount of enzyme which liberates half the active oxygen contained in an H2O2 solution of any concentration in 100 sec. at 25° C.
****) Complete reagent kits are available commercially, see p. 1035.
2
5 ) P. George, J. biol. Chemistry 201, 413 [1953]; B. Chance and A. S. Maehly in S. P. Colowick and N. O. Kaplan: Methods in Enzymology. Academic Press, N e w York 1955, Vol. II, p. 764.
2
6 ) R. Willstatter and A. Stoll, Liebigs A n n . Chem. 416, 21 [1917].
2
?) H.-U. Bergmeyer, Biochem. Z. 327, 255 [1955].
126 Section B : Estimation of Substrates
Stability of the solutions
Prepare the glucose reagent freshly each day. In the preparation of the glucose reagent do not pipette solution I, but pour. If any precipitate forms the reagent can be filtered. Although the glucose standard solution is protected from bacterial contamination by the perchloric acid, it should be stored in a refrigerator. It is stable for at least a year.
Procedure
Experimental material
Blood:
Collect from the lobe of the ear with a blood sugar pipette (graduated to the tip).
Analyse venous blood as soon after collection as possible. Haemolysis does not interfere.
Addition of citrate, oxalate, fluoride or ethylene-diamine-tetra-acetate to blood in the normal concentrations has no significant effect on the determination. For reasons which are not at present known, 10mg.% more glucose is found if the supernatant after perchloric acid deproteinization is neutralized. Therefore neutralization must be avoided. Deproteinization with zinc sulphate-NaOH can be used directly without further modification and it gives the same values as with perchloric acid deproteinization without neutralization. Trichloroacetic acid can also be used for deproteinization.
If the blood sample cannot be determined immediately, it should be pipetted into perchloric acid solution (V), centrifuged and the clear supernatant decanted off. This can be stored in a refrigerator until the next day. After long storage in acid solution the polysaccharides contained in the sample slowly hydrolyse, resulting in glucose values which are too high.
We found in the deproteinized supernatant an increase in the glucose values of 6% per 24 hours. If the mixture was not centrifuged after deproteinization then the increase was ca. 10 % per 24 hours.
Serum and plasma:
If the samples are analysed immediately, then deproteinization is un
necessary. Dilute the samples 1:10 with distilled water.
Urine:
Urine which only contains small amounts of protein also need not be deproteinized.
Reducing compounds such as ascorbic acid, uric acid, glutathione, creatinine, etc. must be removed, because they would interfere with the analysis. According t o
2 3 )
anion and cation exchange resins are best for this purpose. We proceed as follows:
Preparation and regeneration of the resins: Treat the anion exchange resin, AmberliteIRA-400 with 5 % (w/v) NaOH and the cation exchange resin, Amberlite IR-120 with 5 % (w/v) HC1, wash with distilled water until the washings are neutral in reaction. Prepare a glass tube (10 cm. long, 1 cm. diameter, with a glass tap at the bottom) with a glass wool plug, ca. 3 ml.
Amberlite IR-120, another glass wool plug, ca. 3 ml. Amberlite IRA-400 and sufficient distilled water so that surface of the resin is covered.
Procedure: Introduce 0.5 ml. urine onto the column and allow to drop through at the rate of 5 drops/min. into a 50 ml. volumetric flask. Add sufficient distilled water to the column so that the resin is always covered with liquid. After about 20 ml. has run through the column, increase the flow rate to 50 to 100 drops/min. (washing the resin with distilled water). Collect a total of 50 ml. of eluate and mix thoroughly in the volumetric flask. Use 0.2 ml. of this deionized urine (which has been diluted 1 :100) for the analysis.
The amounts of resin given here are sufficient to remove at least 5 mg. ascorbic acid and
glutathione and >0.3 mg. uric acid (corresponding to a concentration in the urine of 1 %
or 0.06%, respectively). No loss of glucose occurs in the process.
I.2.c D-Glucose 127 Foodstuffs: According to the protein content (if it causes coloration of the sample) depro- teinize as for blood.
D e p r o t e i n i z a t i o n
Pipette successively into a 10 ml. centrifuge tube:
1.00 ml. perchloric acid (solution V) 0.10 ml. sample (e.g. blood).
Wash out the pipette by sucking the liquid up and down several times and mix thoroughly with a thin glass rod. Centrifuge for 5 — 10 min. at least at 3000 g, pour off the clear super
natant into a dry test tube and analyse 0.20 ml. of this.
Enzymatic reaction and colorimetric m e a s u r e m e n t s
Wavelength: 436 ma (430—480 ma); light path: 1 cm.; final volume: 5.2 ml.; room temper
ature. Each series of measurements requires a reagent blank and a glucose standard.
Bring the glucose reagent (solution III) to room temperature before use.
Pipette successively into test tubes:
Reagent blank: 5.00 ml. glucose reagent (solution III) 0.20 ml. distilled water
Glucose standard: 5.00 ml. glucose reagent (solution III) 0.20 ml. glucose standard solution (IV) Sample: 5.00 ml. glucose reagent (solution III)
0.20 ml. deproteinized sample.
Mix thoroughly and allow to stand for 30—40 min. at 20—22°C. For the measurements pour the solutions into cuvettes. Measure the optical densities E s a m p I e and E s t a n d a r d against the reagent blank.
Set up a series of measurements in such a way (e.g. addition of glucose reagent at minute intervals) that an average incubation time of 35 min. is obtained.
Calculations
Standard curves are linear up to ca. 80 ag. (ca. 0.45 (i.moles)/ml. This corresponds to a blood sugar concentration of ca. 450 mg. %. With optical densities above 0.600 (measured against the reagent blank) the accuracy of the photometer readings are too low. In this case, dilute the sample or depro
teinized supernatant with doubly distilled water and analyse again.
For the calculations the measured optical densities are related to that of the glucose standard. This contains 18.2 fig. glucose/tube, corresponding to 1 mg. glucose/ml. blood or serum under the given conditions of deproteinization.
Therefore E
S
ampieFstandard X 100 = mg. % glucose in blood or serum.
With samples which have not been deproteinized allow for any preliminary dilution and that the volume of sample is 0.2 ml.
General formula:
Esampie X 5 X 0.0182 x dilution factor _E
S
ampie x 0.091 X dilution factor^standard F
s t a n d a r d
where 5 = conversion from 0.2 ml. to 1 ml.
0.0182 = mg. glucose in the standard tube
mg. glucose/ml. sample
128 Section B : Estimation o f Substrates Example
1. Blood. 0.1 ml. of blood was collected in the morning, deproteinized and the clear supernatant was
poured into a test tube. Measurements were made in the afternoon: E
s a m p
ie
= 0.104; Es t a n d a r d =
0.170.
X 100 = 61 m g . % glucose. N o r m a l values (see below).
2. Hard caramels. 1.55g. were dissolved in doubly distilled water and made up to 100 ml. ( 1 5 - 5 mg./
ml.). Diluted 1 :10 for the assay; 0.2 ml. of this solution was analysed. E
s a m p
ie
= 0.245; Es t a n d a r d
- 0.185.
0.245 X 0.091 x 10 . . . .
— — = 1.20 mg. glucose/ml.
0.185
A s the weight taken was 15.5 mg./ml. the hard caramels contained 7.75% glucose.
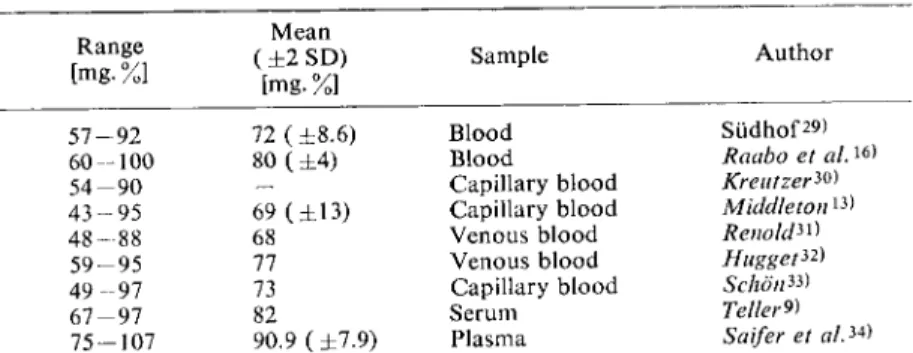
Normal Values in Blood, Serum and Plasma
As the method described here is specific for glucose, the measured values are lower than those ob
tained by measuring the reducing power. N o r m a l values for blood, serum and plasma are given in Table 1. Table 2 shows the differences between the values obtained with this method and those obtained by measurements of the reducing power (method of Hagedorn and Jensen
2
*)).
Table 1. Normal values for glucose in blood, serum and plasma.
Determined enzymatically with G O D - P O D Range
[mg. %]
Mean ( ± 2 SD)
[mg.%]
Sample
5 7 - 9 2 72 ( ± 8 . 6 ) Blood 6 0 - 1 0 0 80 ( ± 4 ) Blood
5 4 - 9 0 — Capillary blood
4 3 - 9 5 69 ( ± 1 3 ) Capillary blood
4 8 - 8 8 68 Venous blood
5 9 - 9 5 77 Venous blood
4 9 - 9 7 73 Capillary blood
6 7 - 9 7 82 Serum
7 5 - 1 0 7 90.9 ( ± 7 . 9 ) Plasma
Author
Sudhof29) Raabo et al.
16
>
Kreutzer^) Middleton
13
>
Renold^) Hugged Schdn*) Teller*) Saifer et al.
34
>
Table 2. Differences between the values for glucose determined by measurement of the reducing power 28)
a
n d those obtained enzymatically with G O D - P O D .Difference Mean
(residual reduction) ( ± 2 S D ) Sample Author [mg.%] [mg.%]
1 8 - 3 4 24 Blood Eismann^
2
) 4 - 5 4 25 ( ± 12) Blood Siidhof
2
*) - 27.9 ( ± 1 2 . 8 ) Blood Sudhof et al.") - 11.9 ( ± 8 . 6 ) Liquor Sudhof et al. is) 10—15 — Blood Kramer, Jacobsen
1
*) - 20 Blood Kreutzer™) 5 . 6 - 3 3 . 3 23.5 Blood Mellinghof et al.W
- 14.3 Blood SchdnetalA*) 28) H. C. Hagedorn and B. N. Jensen, Biochem. Z. 135, 46 [1923]; 137, 9 2 [1923].
29) H. Sudhof: Therapie des Monats. Boehringer, Mannheim (Germany) 1960, p. 203.
30) H. H. Kreutzer, Lecture Symp. d'Enzymologie, Gent (Belgium) April 2 n d , 1960.
3 D A. E. Renold, see ref. 13).
32) A. St. G. Hugget, see r e f .
i 3
) . 33) H. Schon, see ref.
1 3
>.
34) A. Saifer and S. Gerstenfeld, J. Lab. clin. Med. 57, 448 [1958].
1.2. c D-Glucose 129
Modifications
a) More accurate measurements
In spite of measuring against a reagent blank the glucose standard curves often d o not pass through the origin, but cut the ordinate. The point of intersection with the ordinate can be as much as E = 0.060 and depends o n the enzyme preparation. With samples in which the glucose content is very different from the standard (equivalent to 100 mg.%) this displacement of the standard curve is important.
In such cases, for accurate measurements it is not sufficient to relate the optical density of the un
known to that of the standard. Instead several standards containing 0.05, 0.10, 0.15 and 0.20 ml.
glucose standard solution (IV) should be prepared. Plot the optical densities (measured against the reagent blank) (ordinate) against the amounts of glucose (abscissa) and read off from this standard curve the amounts of glucose corresponding to the optical densities of the samples.
b) Rapid measurements
The G O D - P O D reaction goes to completion more rapidly at higher temperatures. On the other hand the colour fades more quickly; the optical density decreases after reaching an optimum value. A t 37° C the measurements are made after about 20 min. and the colour is fixed by addition of H
2
S 04
3
4 ) . A t the end of the reaction (ca. 20 min.) add to the tube
5.00 ml. 5 0 % (w/w) H
2
S 04
and mix (slight warming is not harmful). The red dye is stable. Measure at 546 mu against a reagent blank.
In cases of extreme urgency a reaction time of 5 min. can be used. A s the reaction is still proceeding, the sample, glucose standard and reagent blank must be stopped at exactly the same time by the addition o f 5 0 % (w/w) H 2 S O 4 . The errors in this method due to inaccurate timing are very large.
c) Series of measurements with automatic analysers The method has been adapted by Malmstedt and Hicks
25
) for automatic measurements. The mea
surements are made after 1 min. and the error is only 2 % . d) Semi-quantitative determination with test paper
Filter paper strips soaked with the enzymes and dye (o-toluidine) can be used for the semi-quantitative determination of glucose, especially of glucose in urine (e.g. refer t o
3 6 - 3 9
) ) . A modification for the determination in blood has been described by Kohn
4
°). For the measurements a few centimetres of the paper strip are dipped in the urine, allowed to react in the air and after a few minutes the colour of the paper is compared with a colour chart.
Commercial preparations: "Tes-Tape" (Eli Lilly Company, Indianapolis, Ind., U S A ) ; "Glucotest"
(C. F. Boehringer & Soehne G m b H . , Mannheim, Germany), colour: green. Paper in rolls in a plastic container. — "Clinistix" (Ames Comp., Nuffield House, Picadilly, L o n d o n W. 1., England), colour: blue. Separate strips in a carton.
Doyle et al.
41
) have determined glucose in the mucus of the cervix uteri (fertility test) by introduction o f " T e s - T a p e " bound to a plastic rod.
Specificity
The determination is specific for D-glucose. Mannose, altrose and galactose only give about 1 % of the value with glucose. Fructose, lactose, raffinose, maltose, arabinose, xylose, sorbose, inositol, 35) H. V. Malmstedt and G. P. Hicks, Analytic. Chem. 32, 394 [I960].
36) / . A. Hunt, C. H. Gray and D. E. Thorogood, Brit. med. J. 1956, 586.
37) / . p. Comer, Analytic. Chem. 28, 1748 [1956].
38) H. S. Seltzer, J. Amer. med. Assoc. 162, 1234 [1956].
39) /. R. Leonards, J. Amer. med. Assoc. 163, 260 [1957].
40) /. Kohn, Lancet 272, 213 [1957].
41) / . B. Doyle, F. J. Ewers jr. and D. Sapit, J. Amer. med. Assoc. 172, 1744 [I960].
130 Section B : Estimation of Substrates
melibiose, sucrose, a-methylglucoside and phosphorylated sugars do not react with G O D
4 2
) . Relative to P-glucose = 100 the reaction rates with other sugars are
5
): a-glucose 0.64: mannose 0.98; altrose 0.16; galactose 0.14; talose 0—0.015; allose 0; gulose 0; idose 0.018; 6-methylglucose 1.85; 4,6- dimethylglucose 1.22; according t o
4 3 )
: 2-deoxyglucose 2 5 ; 6-deoxy-6-fluoroglucose > 3 ; xylose > 0 . 4 .
Sources of Error
Interference with the analysis will occur if the sample (e.g. starch syrup) contains disaccharides and if the G O D preparation is contaminated with enzymes (e.g. maltase, invertase, lactase, amylase) which will liberate glucose from these disaccharides. In this case, the reaction does not c o m e to a stop; the optical density continues to increase. Interference due to small optical density increases after the end of the reaction can be corrected for: the optical density is read at 5 to 10 min. intervals and extrapolated to zero time (see p. 39).
A source of error in the determination of glucose in urine is the presence of large amounts of reducing substances in the sample (e.g. vitamin C
4 4
>
4 5
) , uric acid
4 5
) ) . For example, 25 mg. % ascorbic acid reduces the final value by 15%. These substances compete with the peroxidase for the hydrogen peroxide formed. Catalase competes in the same way (possible contaminant of the G O D preparation).
In such cases, the standard curves are non-linear even with relatively low glucose values.
Addition o f 1 — 3 g. fluoride, oxalate or formaldehyde to 100 ml. of blood interferes with the deter
mination. The glucose increases with time after the addition. Simultaneous addition of two of the substances in a concentration of 0.1 % leads to a considerable increase in the glucose values. The reason is not yet known.
42
) E. Bernt, unpublished.
43
) A. Sols and G. de la Fuente, Biochim. biophysica Acta 24, 206 [1957].
44
) H. H. Kreutzer and H. J. H. Kreutzer, Huisarts en Wetenschap 3, 1 [I960].
45
> H.-U. Bergmeyer and E. Bernt, unpublished.