Pepsin, Pepsinogen, Uropepsinogen
Wirnt Rick
The proteolytic enzyme pepsin is found in the gastric juice of all vertebrates. The central or chief cells of the gastric mucosa secrete the inactive precursor pepsinogen (molecular weight of pepsinogen from pig stomach: 42 500), which on cleavage of a peptide inhibitor (mol. wt. 3 242) and other neutral peptides (mol. wt. about 1000), is converted to the proteolytically active pepsin (mol. wt. 34 500) D.
The activation (pH < 5 . 0 ) is an autocatalytic p r o c e s s
2
) . The specificity o f pepsin is not yet fully k n o w n
3
) . The enzyme splits peptide bonds, but not amino acid esters or amides. Bonds in which the amino group o f phenylalanine or tyrosine and the carboxyl group of glutamic acid are concerned are especially easily hydrolysed
4
). In insulin bonds between leucine and valine are also hydrolysed
5
).
Methods of determination
6
): Viscosity measurements with protein solutions; determination of the nitrogen content of the trichloroacetic acid-soluble compounds liberated; formol titration of the amino groups formed after the action of the enzyme on gelatine, casein, edestin, milk proteins, etc.
?
);
determination of the tyrosine and tryptophan content o f the hydrolysis products with the phenol reagent of Folin and Ciocalteu^ after the action of the enzyme o n h a e m o g l o b i n
9
.
1 0
) ; determination of the rennin activity of the e n z y m e
1 1
.
1 2
.
1 9
) ; release of labelled material from isotopically labelled serum a l b u m i n
1 3
) ; decrease of ribonuclease activity after the action of p e p s i n
1 4
) .
Principle
Pepsin hydrolyses fragments from denatured haemoglobin which are soluble in trichloroacetic a c i d
1 0
.
1 5
) . The tyrosine and tryptophan content of these substances is determined according to Folin and Ciocalteu^. The method of Anson
10
** is described below for the measurement of pepsin activity in gastric juice.
Optimum Conditions for Measurements
The optimum p H for proteolytic activity is around 1.5—2.5
1 6
) or 1.8— 2 . 0
1 5
>
1 ?
) . However, the hydro
lysis of carbobenzoxy-L-glutamyl-L-phenylalanine is optimal at p H 4.5 and of carbobenzoxy-L- glutamyl-L-tyrosine at p H 4.0
4
). According to Ohlenbusch
11
* the p H activity curve of pepsin is 1) H. van Vunakis and R. M. Herriott, Biochim. biophysica Acta 22, 537 [1956]; 23, 600 [1957].
2) R. M. Herriott, J. gen. Physiol. 22, 65 [1938].
3
) M. Dixon and E. C. Webb: Enzymes. Longmans, Green & Co., London 1958, p. 266.
4
) /. S. Fruton and M. Bergmann, J. biol. Chemistry 727, 627 [1939].
5
) F. Sanger and E. O. P. Thompson, Biochem. J. 53, 366 [1953].
6
) N. C. Davis and E. L. Smith in D. Glick: Methods in Biochemical Analysis. Interscience Publ., N e w York 1955, Vol. 2, p. 215.
7) / . H. Northrop, J. gen. Physiol. 16, 41 [1933].
8) O. Folin and V. Ciocalteu, J. biol. Chemistry 73, 627 [1927]; see also in P. B. Hawk, B. L. Oser and W. H. Summer son: Practical Physiological Chemistry. The Blakiston C o m p . , Philadelphia
1947, p. 879.
9
) M. L. Anson and A. E. Mir sky, J. gen. Physiol. 16, 59 [1933].
10
) M. L. Anson, J. gen. Physiol. 22, 79 [1939].
"> P.M. West, F. W. Ellis and B. L. Scott, J. Lab. clin. Med. 39, 159 [1952].
12) B. Kickhofen, F. E. Struwe, B. Bramesfeld and O. Westphal, Biochem. Z. 330, 467 [1958].
1
3
) M. K. Loken, K. D. Terrill, J. F. Marvin and D. G. Mosser, J. gen. Physiol. 42, 251 [1958].
1
4
) A. Berger, H. Neumann and M. Sela, Biochim. biophysica Acta 33, 249 [1959].
1 5 )
R. M. Herriott in S. P. Colowick and N. O. Kaplan: Methods in Enzymology. Academic Press, N e w York 1955, Vol. II, p. 6.
1 6 )
E. L. Smith in / . B. Sumner and K. Myrbdck: The Enzymes. Academic Press, N e w York 1951, Vol. I, p. 840.
17
) H. D. Ohlenbusch, Lecture, Meeting of the French, Swiss and German Societies for Physiological Chemistry, Zurich 1960.
820 Section C: Measurement of Enzyme Activity
contributed to by the change in activity with p H below p H 2 and the change in activity due to denaturation of substrate above p H 2. With urea-denatured haemoglobin the p H optimum is 3.1 and at p H 4 not less than 50 % of the activity at the pH optimum is obtained (denaturation of the haemoglobin in 4 0 % alkaline urea, enzyme reaction in 10% urea solution). The optimum substrate concentration is 1.6 mg. haemoglobin/ml. and the rate of hydrolysis is constant between 1.6 and
16 mg. substrate/ml.
Reagents
1. Hydrochloric acid, cone. (36 % w/w) *) 2. Hydrochloric acid, A. R., 0.2 N 3. Hydrochloric acid, A. R., 0.06 N 4. Hydrochloric acid, A. R., 0.01 N 5. Sodium hydroxide, A. R., 0.5 N 6. Trichloroacetic acid
7. Sodium tungstate, N a 2 W 0 4 - 2 H 2 0 *>
8. Sodium molybdate, N a 2 M o 0 4 • 2 H 2 0 *>
9. Lithium sulphate, L i 2 S 0 4 *>
10. Orthophosphoric acid, cone. (85% w/w)*>
11. Bovine haemoglobin * *) 12. L-(-)-Tyrosine
chromatographically pure.
Preparation of Solutions I. Substrate solution:
Dissolve 2 g. haemoglobin in 0.06 N H Q and make up to 100 ml. (pH ca. 1.8). Centrifuge off any stromata which may be present at 4000 g. for 15 min.
II. Phenol reagent +>:
This reagent can be obtained commercially, e.g. from E. Merck, Darmstadt, Germany, If it is wished to prepare the phenol reagent, the best procedure is that of
E. Layne+
\
III. Tyrosine standard solution (10~
3
M tyrosine):
Dissolve 181.19 mg. L-(—)-tyrosine in 0.2 N HC1 and make up to 1000 ml.
IV. Trichloroacetic acid (5 % w/v):
Dissolve 5 g. trichloroacetic acid in distilled water and make up to 100 ml.
Stability of the solutions
Store the substrate and tyrosine solutions in a refrigerator at 0 to 4 ° C . T o prevent bacterial contami
nation 2.5 mg. M e r t h i o l a t e
+ + )
(Lilly) can be added per 100 ml. substrate solution and formaldehyde (0.5% final concentration) to the tyrosine solution.
*) The reagents 1, 7, 8, 9 and 10 are components of the Folin and Ciocolteu phenol reagent
8
*. This reagent can be obtained commercially, e. g. from E. Merck, Darmstadt, Germany.
**) e.g. from Behringwerke, Marburg, Germany; Armour, Kankakee, 111., U S A ; Serva, Heidelberg, Germany.
+
> E. Layne in S. P. Colowick and N. O. Kaplan: Methods in Enzymology. Academic Press, N e w York 1957, Vol. I l l , p. 448.
+ +
) N a salt of o-(ethylmercurythio)-benzoic acid
Procedure
T y r o s i n e standard curve
Pipette into 50 ml. Erlenmeyer flasks:
0.2 —1.0 ml. tyrosine standard solution (III) ( = 0 . 2 — 1.0 (junoles tyrosine) 4.8-4.0 ml. 0.2NHC1
10.0 ml. 0.5 N NaOH.
Add with continual shaking
3.0 ml. dilute phenol reagent (solution II).
Measure the optical density as described below against a blank containing 0.2 N H Q instead of tyrosine standard and plot the results against u,moles tyrosine.
Enzymatic reaction
For each determination prepare a blank: add 10 ml. trichloroacetic acid (IV) to 5 ml. of the substrate solution (I), then add the enzyme solution, and after a short time filter or centri
fuge off the precipitate (see below).
Pipette into a 20 ml. centrifuge tube:
5.0 ml. substrate solution (I).
Warm to 25° C in a constant temperature bath, either add 0.01 —0.04 ml. undiluted gastric juice and 0.99-0.96 ml. 0.01 N H Q
or mix in
1.00 ml. enzyme solution (containing 5—20 u.g. crystalline protein).
Incubate at 25° C. After exactly 10 min. add 10.0 ml. trichloroacetic acid solution (IV) and shake.
Filter or centrifuge off the precipitate (20 min. at 4000 g).
Colour reaction
Pipette into a 50 ml. Erlenmeyer flask:
5.0 ml. filtrate or supernatant 10.0 ml. 0.5 N NaOH.
Add with constant shaking
3.0 ml. dilute phenol reagent (solution II)
and 5 to 10 min. after the addition of the phenol reagent read the optical density against water in 1 cm. cuvettes at 578, 691 or 750 mu,.
Calculations
The "Pepsin U n i t " ( P U
H b
) defined by Anson
10
* is the amount of enzyme which hydrolyses haemo
globin at such an initial rate under the standard conditions (total volume 6 ml. containing 0.1 g.
haemoglobin; temperature 35.5°C), that the amount o f trichloroacetic acid-soluble hydrolysis pro
ducts formed per minute, gives the same optical density with the phenol reagent as 1 mmole
822 Section C: Measurement of Enzyme Activity
tyrosine. If the incubation is carried out at 25°C instead of 35.5° C, then the activity o f the enzyme is 1.82 times lower. However, there is no linear proportionality between the pepsin activity and the amount of hydrolysis products formed. Therefore the pepsin activity must be extrapolated to zero or a standard curve can used.
The extrapolation method is used for the determination of activity of purified enzymes: different, sufficiently small amounts of enzyme are incubated with the substrate as previously described. After determination of the hydrolysis products (corrected for the blank) the u^moles tyrosine are plotted against the amounts of enzyme and then a tangent to the curve is drawn through the origin. From the tangent the amount of enzyme which corresponds to 1 umole tyrosine is read off. This amount of enzyme is multiplied by
10 X 1000 X X = 1717 5 1 16 1.82 to give the amount of enzyme corresponding to one pepsin unit ( P U
H b
) . The factors are obtained as follows:
10 = conversion from 10 min. to 1 min.
1000 = conversion from u^moles to mmoles
5/16 = conversion from colour reaction to enzymatic reaction mixture 1/1.82 = conversion from 2 5 ° C to 35.5°C
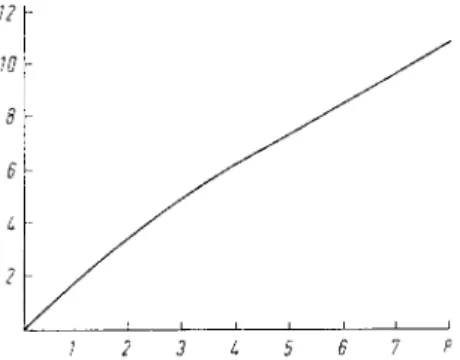
For studies on gastric juice and other biological fluids Anson
10
) has given a standard curve obtained by use of a modified assay (Fig. 1).
12 Y w
8 6 L 2
7 2 3 L 5 6 7 P
Fig. 1. Dependence of the hydrolysis of haemoglobin by pepsin on the amount of enzyme (according to Anson
10
)) Ordinate: Tyrosine equivalent [mmole X 10
4
] of the hydrolysis products in 5 ml. filtrate (see text under "Enzymatic reaction"). Enzymatic reaction: 10 min. at 25°C.
Abscissa: Pepsin units according to Anson
10
), P U
Hb
X 10
4
.
The optical density read on the spectrophotometer is converted to mmoles tyrosine by means of the tyrosine standard curve and the pepsin units P U
Hb
corresponding to this amount are read off from the abscissa of Fig. 1. For conversion to units per ml. sample the results must be divided by the volume of sample taken for the assay.
Calculation o f the results in International U n i t s : The activity of 1 P U
Hb
at 25°C is - j - j ^ - = 549.4 (xmoles of tyrosine-equivalents liberated/min.
Example
The standard curve prepared with )-tyrosine is a straight line up to 1 u.mole tyrosine/mixture.
The optical densities found with 1 u.mole tyrosine (volume: 18 ml.) were
0.04 ml. gastric juice from a healthy subject were used for the enzymatic reaction. After the colour reaction the optical density at 578 mu. (minus the blank) was 0.186. This corresponds to 0.38 umoles tyrosine. According to Fig. 1 this value corresponds to 2 . 1 8 X 1 0
-4
P U
Hb
(0.04 ml. gastric juice).
Consequently the gastric juice contained 2.18 X 1 0 ~
4
x 2 5 = 5.45 X 1 0
-3
P U
Hb
pepsin/ml.
Measurement of Pepsinogen Activity
Pepsin is destroyed at p H > 8
1 5
> , while pepsinogen is stable at this p H . Therefore it can be determined in the presence of pepsin, if the solution containing the enzyme and pro-enzyme is brought t o p H 8 with N a O H , followed by acidification to p H 2 — 3 with HC1 to convert the pepsinogen to pepsin.
Further operations as for pepsin.
Measurement of Uropepsinogen Activity
A small fraction of the pepsinogen formed by the gastric mucosa is secreted into the b l o o d and excreted as uropepsinogen in the urine
1
8,19). T o convert uropepsinogen into pepsin acidify the urine to p H 2.5 — 3 with HC1 and incubate for 1 hour at 3 7 ° C
1 2
>
1 9
> . Further operations as for pepsin.
is) G. R. Bucher, Gastroenterology 8, 627 [1947].
19) W. P. Peak, E. Viergiver, E. J. Van Loon and G. G. Duncan, J. Amer. med. Ass. 162, 1441 [1956].
at 578 mu.
at 691 mu.
at 750 mu.
0.490 0.620 0.665