the Least-Developed, Most Deprived Micro-Regions in Hungary
Judit Kalman65
3.1 Introduction
Traditionally, development policy has double orientations directed towards economic growth enhancement and/or a care for social, territorial, and economic inequalities across and within countries simultaneously. However, managing this trade-off is challenging throughout the world, especially during, and after, austerity times.
Results of the New Economic Geography literature (Krugman, 1991; Fujita et al., 2001;
Puga, 2002) underline such trade-off—i.e. it is uncertain whether or not concentrating on diminishing regional disparities itself could bring convergence, or if growing regions, development poles, and development policy assistance might bring better results. Within the EU, and in different common policy areas, there are mixed goals, as for example: cohesion policy, with its former convergence focus, versus EU2020 and Lisbon goals of competitiveness and employment integration of these two. That is, the “lisbonization of cohesion policy” is a major feature of the current 2014-2020 EU framework period. But such trade-offs are also visible in the diminishing regional concentration of cohesion policy—or the introduction of transitioning regions and the funding that is given for developed regions. This chapter is assessing the success of allocating extra-resources to backward, deprived regions within a country and compares EU funding with national public resources for investment as well as private sector investment activities among the least developed, most deprived micro-regions in Hungary. What is the spatial pattern of these three different resources? What drives development in these backward areas? The initial hypothesis is that available development policy funds are minor compared to private (business) investments or state budgetary resources, hence only additional role can be expected. Yet, in least developed, economically depressed and poor areas the private sector is very weak, thus here development policy is expected to have a major role.
In the context of Hungary, the same above trade-off applies. That is, notwithstanding the major priority of the country’s overall convergence towards EU
65 Hungarian Academy of Sciences, Centre for Economic and Regional Studies, Institute of Economics.
Correspondence: judit.kalman@krtk.mta.hu
Journal xyz 2017; 1 (2): 122–135
The First Decade (1964-1972) Research Article
Max Musterman, Paul Placeholder
What Is So Different About Neuroenhancement?
Was ist so anders am Neuroenhancement?
Pharmacological and Mental Self-transformation in Ethic Comparison
Pharmakologische und mentale Selbstveränderung im ethischen Vergleich
https://doi.org/10.1515/xyz-2017-0010
received February 9, 2013; accepted March 25, 2013; published online July 12, 2014 Abstract: In the concept of the aesthetic formation of knowledge and its as soon as possible and success-oriented application, insights and profits without the reference to the arguments developed around 1900. The main investigation also includes the period between the entry into force and the presentation in its current version. Their function as part of the literary portrayal and narrative technique.
Keywords: Function, transmission, investigation, principal, period Dedicated to Paul Placeholder
1 Studies and Investigations
The main investigation also includes the period between the entry into force and the presentation in its current version. Their function as part of the literary por- trayal and narrative technique.
*Max Musterman: Institute of Marine Biology, National Taiwan Ocean University, 2 Pei-Ning Road Keelung 20224, Taiwan (R.O.C), e-mail: email@mail.com
Paul Placeholder: Institute of Marine Biology, National Taiwan Ocean University, 2 Pei-Ning Road Keelung 20224, Taiwan (R.O.C), e-mail: email@mail.com
Open Access. © 2017 Mustermann and Placeholder, published by De Gruyter. This work is licensed under the Creative Commons Attribution-NonCommercial-NoDerivatives 4.0 License.
Open Access. © 2020 Ida Musiałkowska, Piotr Idczak, Oto Potluka and chapters’ contributors. Published by De Gruyter.
The First Decade (1964-1972) Research Article
Max Musterman, Paul Placeholder
What Is So Different About Neuroenhancement?
Was ist so anders am Neuroenhancement?
Pharmacological and Mental Self-transformation in Ethic Comparison
Pharmakologische und mentale Selbstveränderung im ethischen Vergleich
https://doi.org/10.1515/xyz-2017-0010
received February 9, 2013; accepted March 25, 2013; published online July 12, 2014
Abstract: In the concept of the aesthetic formation of knowledge and its as soon as possible and success-oriented application, insights and profits without the reference to the arguments developed around 1900. The main investigation also includes the period between the entry into force and the presentation in its current version. Their function as part of the literary portrayal and narrative technique.
Keywords: Function, transmission, investigation, principal, period Dedicated to Paul Placeholder
1 Studies and Investigations
The main investigation also includes the period between the entry into force and the presentation in its current version. Their function as part of the literary por- trayal and narrative technique.
*Max Musterman: Institute of Marine Biology, National Taiwan Ocean University, 2 Pei-Ning Road Keelung 20224, Taiwan (R.O.C), e-mail: email@mail.com
Paul Placeholder: Institute of Marine Biology, National Taiwan Ocean University, 2 Pei-Ning Road Keelung 20224, Taiwan (R.O.C), e-mail: email@mail.com
Open Access. © 2017 Mustermann and Placeholder, published by De Gruyter. This work is
licensed under the Creative Commons Attribution-NonCommercial-NoDerivatives 4.0 License. This work is licensed under the Creative Commons Attribution-NonCommercial-NoDerivs 3.0 License. https://doi.org/10.1515/9788395720451-008
levels and efficient funds absorption goals, which lead to higher funding allocated for more advantaged prosperous regions66. Hungarian development policy also considers transforming areas that are least developed into dynamic areas as an important part of its goals. Even so, it remains secondary, showing up among targets and priorities within policy documents. Official development policy recognizes the problems of disadvantaged (micro-)regions and has at least some intentions to tackle them—even before EU accession, the National Development Concept adopted some cohesion-like features dealing with within-country regional disparities and caring for lagging regions (Horváth, 2001). It later developed a methodology for a complex index, identifying the most disadvantaged ones before putting them into government decrees and Parliament decisions on subsidization67. Indeed, some extra funding has been provided for these disadvantaged areas from various sources68. However, the duality of development policy persisted. Meanwhile the structural problems caused by the economic and financial crisis rendered it as secondary to other economic policy goals in Hungary. Moreover, given the availability of EU Cohesion Funds, the more advantaged, more prosperous, better endowed, and growing regions managed to absorb larger funds. All of these processes point to cumulated disadvantages that lagging regions face in terms of regional growth prospects.
National budgetary resources for development purposes have gradually shrunk, due to EU Cohesion funds already in pre-crisis years (Figure 1). As illustrated in Figure 1, former national decentralized regional development subsidies (TEKI, CEDE) had completely disappeared from the state budget. Since 2010, a 0.9-1.5 bn HUF amount was budgeted as regional development allocation in the state budget. But by 2015, even this fund ceased to exist. The reason was mostly a result of the huge amounts of EU Cohesion Funding received, just like in other new member states. For the entire EU budget period of 2007-2013, Hungary received 24.92bn EUR from cohesion policy, which, after deducting the country’s contribution to EU budget, still corresponds to 2.5% of Hungarian GDP produced in the same period. Despite additionality principles, regional development or territorial cohesion is entirely financed by EU resources in Hungary today. Such crowding out of national development policy by EU Cohesion Funds happened similarly in several other EU member states (Grosse, 2006).
66 Where all but the central region being under the 75% EU GDP threshold.
67 e.g. 67/2007. (VI. 28.) Parliament Decree
68 See e.g. a report compiled by the National Ministry of Economy in 2009 http://www.vati.hu/files/
sharedUploads/docs/teruletfejlesztes/hazai_tfejl_tam_19962008.pdf
Figure 1: Shrinking national budgetary resources for regional development purposes in 2006-2010.
Source: Hungarian State Treasury 2011. Report on the system of local government development grants.
Turning the focus onto the least developed (most depressed) areas highlights how they are characterized by, not only low economic performance and a lack of employment opportunities compounded by social problems (low standards of living, outmigration of educated population), but also by weak absorption capacities for development funds. Recognizing these problems, starting from 2009-2010, a special program was designed to target the 33 least developed micro-regions (LAU1, formerly NUTS4) of Hungary within EU Structural Funds allocation This in turn, forced the prioritization and extra-funding for projects coming from these areas. This study assesses the success of allocating extra-resources to these disadvantaged micro-regions and takes stock of, and compares, EU funding with national resources for investment, as well as private investment flows into such lagging areas. Its primary novelty is relying on business financial data for a better estimation of private investment activities and not just on the use of registered number of businesses or other aggregate investment data utilized in previous studies. This research also explores the spatial scale all the way to the micro-region level (LAU1/NUTS4).
3.2 Research Question & Hypotheses
The questions this paper answers are as follows: 1) What type and magnitude of private/public (national and EU) regional development resources do these least
developed (depressed) micro-regions have access to in Hungary? 2) What is the spatial pattern of these three different resources (private/natl./EU)? 3) Have the least developed micro-regions managed to absorb more EU funds due to the special program within Hungarian cohesion policy interventions? Finally, 4) what drives development in such areas?
In assessing the role of development policy in the context of development potential of these least developed micro-regions, our initial hypothesis is that, under normal circumstances, in any region available, development-policy funds are minor compared to private (business) investment flows or state budgetary resources.
Hence, only an additional role can be expected of them in the development potential of a region or micro-region. A related hypothesis predicts that without any special targeting, fund-absorption capacity (measured by per-capita EU-grants allocations) is lower than average among the least-developed micro-regions. This is for various reasons, all of which lead to further under-development.
Yet, in the least developed, economically-depressed, and poor areas the private sector is very weak, whereby barely any investments happen. As such, we can expect development policy to have a more major role in this area (comparable to that of private sector investments)—that is, in their growth as well as in transformation of their social and economic structures. In other words, development funds targeted with a special regional focus can bring about significant socio-economic changes.
However, the possibility of real convergence, of such areas into the broader regions, remains a separate issue; and currently, the present economic situation and policy trends do not have this consideration within their periphery.
Another contribution to knowledge that this research has to offer is in the use of micro-regional (LAU1-NUTS4) and municipal level data. The sparsely available extent literature, dealing with this subject matter, conventionally only used additional aggregated county-wise data, often provided by the National Statistics Office of Hungary. Collection, cleaning, and editing of data—especially private sector data—at the micro-regional level, had several challenges of its own, demanding a substantial amount of work.
3.3 State of the Art in the Literature
Extended public finance literature (Musgrave, 1975; Oates, 1991; Aschauer, 1989) has seen a growing trend in addressing issues pertaining to how to allocate public funds in an efficient and effective, yet equitable manner, for some time. This includes the design of tax policy or welfare systems among other things for example. Such issues have challenges that are well described in the literature during normal operation too, but especially under crisis and austerity times. For the sub-national level, the extent and mode of fiscal decentralization, and different sub-national governance models, can bring various types and degrees of local autonomy, depending on the
set-up.69 Yet the literature has mostly focused on the causes of degrees and diversity of fiscal decentralization , incentives and behaviour of governments at different levels and with its economic impacts on growth (Davoodi & Zhou, 1998; Martínez- Vázquez & Mcnab, 2003). However, the deeper and more complex issues of political decentralization and its linkages to growth have been overlooked despite a trend of devolution across the world. Linking it with the issues of regional development, Ezcurre-Rodriguez-Pose (2013) finds no statistical relationship between political decentralization and economic growth, regardless of how political decentralization is measured with different indices and ambiguities. Even so, this is not to say that there are not somewhat positive results for the link between decentralization and increasing regional disparities.
The trade-off between equity and efficiency is especially highlighted in the field of development policy, where opposing goals/policy tools are often used (Brakman et al., 2005; Bachtler et al., 2003; Martin, 2005). Such mixed policies are present in the EU development policy scene as well—both at EU and national levels. This begs the following questions: Should the concentration be on infrastructure or human resources? Which of these will better boost an inclusive growth and give more funds to businesses or to the public sector? How? What other aspects of development should be prioritized and measured? By which best indicators?
With this into consideration, mixed-policy goals are noticeable—for example, the co-existence of growth-oriented Lisbon agenda and EU2020 goals, as well as the care for lagging regions (cohesion policy). Despite this, cohesion policy and its reforms in the recent EU cycles (“lisbonization”) seem to disregard the trade-off between equity and efficiency as non-existent, or at least easy to handle, and that it is possible to maximize growth and overall convergence at the same time.
Neoclassic regional growth models (e.g. Barro-Sala-I-Martin, 1992) have acknowledged that economic activity is unevenly distributed across space due to comparative advantages, emphasising processes of convergence based on trends in post-war Europe and the US until the 1980s. Additionally, in early development economics, there was much talk about circular and cumulative economic processes, and later about ‘convergence clubs’ (Myrdal, 1957; Hirschmann, 1958; Quah, 1996).
However, since the 1990s, a number of studies have recognized widening within-country regional disparities in GDP per capita or in employment terms (Puga-Venables, 1999; Martin, 2005; Puga, 2002; Rodríguez-Pose, 1999) despite international convergence trends. With ever-larger economic integration, especially within Europe, core regions are benefitting while periphery regions seem to suffer70.
69 See indices created by Ebel-Yilmaz (2002), Rodden and Wibbels (2002), Treisman (2002), Schakel (2008), and Hooghe et al. (2010).
70 Acknowledging this and somewhat counter-balancing for it being the very core underlying
‘reason d’etre’ for EU cohesion policy.
From the perspective of regional endowments and growth potential, core regions with high levels of skilled labour and access to capital and few institutional barriers to adopting new technologies, are usually places where innovation and thus economic growth happens; whereas low income periphery regions, characterized by high concentrations of unskilled labour, limited access to capital and low productivity, substantial cultural and institutional barriers generally remain far from it. New Economic Geography (Krugman, 1991; Fujita et al., 2001; Puga, 2002) emphasizes focusing on growth and to concentrate economic activity and funding to faster developing hubs of the economy (usually the core regions). This would then help lift the rest of the economy along with the rapidly developing hubs. Other models, built from endogenous growth theory put the focus on innovation (Romer, 1986; Grossman
& Helpman, 1991), and the distance of territories from the technological frontier. They emphasize change management, adaptation efficiency, and learning processes.
Nonetheless, recent literature on regional economic development seems to have reached a consensus that spatial proximity, density, and localization should be put in the wider context of economic globalization (e.g., Crescenzi, Nathan, & Rodríguez- Pose, 2016). That is, local and regional development processes do not solely depend on locally available human capital and production assets anymore, and there are different non-spatial linkages such as social-, institutional-, knowledge-overflow that play complementary or even substituting roles (Boschma, 2005; Boschma, 2015;
Crescenzi et al., 2016; D’Este, Guy & Iammarino, 2013; Javorcik, 2004). Ostensibly, this means that FDI flows and multi-national companies play significant roles in these
‘glocalization’ processes. The emerging literature on the interdependence of corporate and geographical connections and linkages relates the concept of connectivity with regional economic development (Crescenzi & Rodríguez-Pose, 2011; Baldwin, 2011).
What all of these different strands of literature have in common is that human capital and training knowledge transmission networks are of utmost importance to innovation and thus regional development.
There is yet another school of thought emphasizing that the persistence of institutional differences across regions, despite economic integration, is a key in maintaining regional disparities, since institutions shape the way the economy can use available resources or absorb new ones. Serious institutional weaknesses and so on, keep a regional economy away from innovation, moving up on the technological frontier and thus growth (Persson et al., 1997; Grossman & Helpman, 2001; Acemoglu, 2006; Acemoglu-Johnson, 2006; Rodriguez-Pose 1999).
Regarding EU cohesion policy and its effects on regional growth, the bulk of the literature deals with convergence analyses and the funds’ impact on these (Becker, Egger & Von Ehrlich, 2008; Cappelen et al., 2003; Ederveen, de Groot, & Nahuis, 2006;
Mohl & Hagen, 2010; Pellegrini et al., 2013; Varga & Veld, 2011; Dall’erba & Le Gallo, 2008). Regional socio-economic conditions are found to be a positive conditioning factor for policy impacts. That is, where demographics, productive structure, the labour market, regional innovative capacity, and infrastructural endowment are
more favourable, the relationship between EU regional policy funding and regional growth is stronger (Crescenzi & Giua, 2014). Fratesi and Perucca (2014) analysed the relationship between structural characteristics (accessibility, public goods, stock of private capital, social capital, human capital, urban/rural nature) of the recipient regions of funds and the impact of the EU financial support on economic growth in NUTS 3 regions, and found a positive relationship. The true policy question therefore, is whether or not, and how active policy intervention can improve these capacities and structural characteristics in lagging periphery type regions, and which of these are really reacting to, and can get improved by, policy intervention. The current idea of reducing regional disparities in a growth-enhancing way calls for a development of capacities, both hard and soft (EC, 2014).
The cohesion policy literature also emphasizes the strong role institutions play in both more effective funds absorption and regional growth in general. Bachtler and McMaster (2007) found that EU Structural Funds lead to stronger regionalisation in the EU8 member states through the building of regional structures and competences, which are necessary to absorb funds. The connection between government effectiveness and cohesion policy funding absorption is also recognised in Ederveen, de Groot, and Nahuis (2006), Tosun (2013), and the European Commission–DG Regional and Urban Policy (2014). Charron, Dijkstra, and Lapuente (2014a; 2014b) created the regional government quality index that is proven to be highly correlated with sub-national levels of socio-economic development and levels of social trust.
It has since been used by a number of research papers. Farole et al. (2011) also emphasize institutions as the key determinant of a country or region’s growth path, and warn that development policies are often mis-implemented and prone to elite capture and rent-seeking. For lagging periphery regions, focusing on human capital and capacity development is of utmost importance for enhancing local institutions and thus absorption and growth. With regard to new member states from Central and Eastern Europe, there is increased attention to their institutional structure, government (in)effectiveness, transparency, political influence and corruption issues centring on EU funds absorption and effective use (Tosun, 2013; Farole et al., 2011;
Medve-Balint, 2017; Medve-Balint, 2018; Kersan et al., 2017; Grusevaja-Pusch, 2011;
Kalman, 2002; Kalman, 2011).
Still substantial gaps or disagreements remain in the literature, especially on what happens economically within regions and the needed local economic and structural conditions or the design of the right set of public policies to boost regional development in different type of core, periphery, and lagging regions. Inflows/
outflows of private sector investment or FDI and the relative socio-economic position of sub-national regions within the EU are of utmost interest and policy importance for overall EU2020 growth goals and EU cohesion policy. This chapter is a small attempt to contribute to the literature and fulfil such need by taking stock of private, public, and EU origin investment flows to sub-national regions (at the NUTS4 or LAU1 level) at different level of development within Hungary. It attempts to take a look at patterns
of allocations and flow of funds. It does not deal with the efficient use of such funds and their economic effects on the micro-regions. Such an examination is a task for future research when longer periods and more data become available.
3.4 Institutional Background
3.4.1 Growing Importance & Governance of EU Structural Funds in Hungary
Providing a steadily growing flow of funds ever since EU accession in 2004, but noticeably after the 2008 crisis, EU Structural Funds became a major source of public investment in cohesion countries—especially in the CEEs (over 50% for all, ca.74%
for Hungary), providing a good counter-cyclical tool for these countries (Figure 2). In the subsequent EU cycle of 2014-2020, the order of countries has changed somewhat, with Portugal becoming the first with 80% of public investment financed from ESIF, but still substantial ratios (above 50%) of EU funding for public investment in the CEE member states as well. It is then followed by some southern cohesion countries also covered for 20-40%. Hence, the involvement of not only available public and private investment resources, but also differentiating between national and EU origin funds, are both critical in the analysis of regional resource disparities.
Figure 2: EU has become a major source of public investment after crisis in CEE (2011-13).
In the 2007-2013 EU cycle, at the period of analysis (due to the special program for disadvantaged micro-regions taking place from 2009), the National Development Agency was the central institution for the operation of EU cohesion policy in Hungary, established by the government in 2006. This was then followed by yet another institutional change from 2014 onwards. Its tasks included coordination of the planning and programming, including the drafting of the national development
plan, and the operational programs and action plans. It became the central management authority, managing tasks such as: announcement of calls, approval of the invitations, the framework contracts of support, as well as setting up evaluation committees laying the groundwork for the selection of eligible projects. The agency also managed, monitored, and assessed the work of cooperating organizations carrying out the actual tendering, contracting and disbursement, reported annually on program progress to the parliament. It bore responsibility for communication and public relations about the entire development. Oversight was provided by the Ministry for National Development up until the end of 2013, and then later by the Prime Minister’s Office.
Still, the government handled strategic decisions, such as the approval of the national development plan and its operational programs, 2-year action plans, as well as submitting them to the European Commission. Such central management was always characteristic to Hungarian development policy across various governments (Pálné et. al., 2004; Pálné, 2013). It also usually decides on support for special projects/high-value developments, which are typically those with a budget of over HUF 5 billion/EUR 15 mn. The certifying authority in disbursements was the Ministry of Finance, whilst operational compliance and financial monitoring was conducted by the Government Audit Office, the State Audit Office, and the inspectors of the European Commission.
From 2014 onwards, the institutional arrangement for EU funds allocation in Hungary has been changed for the new 2014-2020 EU budgetary cycle: the former role of the National Development Agency, as central coordinating body for development policy planning and EU funds allocation, has been taken over by the Prime Minister’s Office—i.e. the system went through strong centralization. At the same time, specific ministries became responsible for the planning and implementation of Operative Programmes, which on one hand, allowed for better alignment with sectorial public policy plans, but on the other, meant a very fragmented implementation and a secondary role of development policy. Efficiency and effectiveness of these new governance structures is yet to be seen. Such centralization helps better total national absorption of available funds, albeit cost-efficiency is not the same as true results.
The effective, growth, and social-inclusion enhancing use of EU funds remains questionable and a task of later evaluations and future research71.
71 However, such centralized management of EU funds is characteristic to many other cohesion countries and happened with the silent consent of the European Commission, which also realized the weak administrative capacities of the middle-tier in new member states (Bailey & De Propris, 2004). Thus, in fact, cohesion policy allocation brought about concentration of power and centralized management instead of more regionalization and devolution in most new member states (Bruszt, 2008; Ferry & McMaster, 2013).
3.4.2 Dealing with Regional Disparities in Hungarian Development Policy: The Appearance of The Complex Program in 2009
Throughout the 2000s, an external-convergence-internal-divergence process characterized Hungary, with convergence driven by the central region of the country (containing the capital city Budapest and its agglomeration), yet a serious increase in internal territorial inequalities (Figure 3).
Figure 3: Widening gaps of regional differences in per capita GDP in HU regions 2000, 2010, and 2011.
Source: own calculations based on CSO Hungary data.
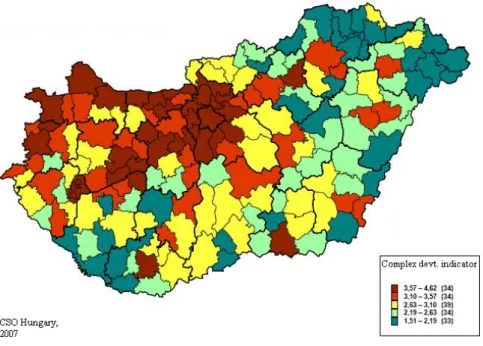
These development gaps are especially visible if measured not on the regional (NUTS 2) level but among micro-regions (NUTS 4/LAU 1), where there is considerable and growing variance in socioeconomic indicators, with unsustainable loss of economic base, strong outmigration in several of them, and with differences as much as 20 times across micro regional development levels east and west of the country, especially between centre and eastern and southern peripheries (Figure 4, on the development level of all 174 HU micro-regions in 2007, along the complex development indicator applied by Central Statistical Office of Hungary).
Recognizing these issues, the following national objectives of territorial cohesion were identified: (i) the dimension of European convergence of the country overall;
(ii) mitigation of internal inequalities (at regional and micro-regional levels); (iii) the need for territorial harmony in developments, and (iv) the need for territorial synergies in developments (co-operation between regions and sectors of the economy). Development needs were also reflected by the fact that six of the seven HU regions were identified as objective 1 regions, under EU level GDP averages, and thus eligible for ESIF. The central region however, comprising capital city Budapest and its agglomeration, became transitory “phasing-in” regions, first entitled for similar rates of support as other regions, but significantly smaller rates from 2011 onwards. Hence,
contrary to earlier ranking of within-country disparities by problems and needs, and some care for the lagging regions within development-targeted funds, this situation created a level-playing field for all regions of the country, all competing for available cohesion funds with the same conditions (Bachtler & Downes, 2000).
Figure 4: Development level of 174 Hungarian micro-regions in 2007 along the complex development indicator applied by CSO.
Thus despite the presence of some regional cohesion objectives in subsequent development plans (from 2004 EU Accession onwards), the least depressed areas of Hungary could hardly reach and receive resources from the huge pool of EU Structural Funds. More developed parts of the country had much better absorption rates (Hajnal- Medve, 2016; Kalman, 2011; Cartwright-Báthory, 2012,).72 These happened partly due to regulatory issues and incentives for full and fast total national absorption of funds (with prosperous regions also having better administrative and own contribution capacities), and partly due to a restructuring of resource-allocation following the financial and economic crises escalating from 2008. As so, the least developed micro-regions were characterized by not only low economic performance, lack of employment opportunities, social problems (outmigration of skilled population), but 72 Similar results, a better absorption by more prosperous regions, were found for many other new CEE member states by Bloom and Petrova (2013), and by Dąbrowski (2012).
also by a relatively low absorption capacity for development funds (as also shown by the huge differences in magnitudes across least and most developed countries in Figure 6 and Table 1 presented in the next section). Even from the absorbed EU funding within micro-regions, it was usually the more developed parts, central settlements, that gained support, and less so the peripheral villages. This exacerbated their disadvantages, and thus more economic integration enhanced within-country regional divergence, as is the case in many other countries.
Recognizing the special problems these least developed areas face, starting from 2009, a special program targeting the 33 most depressed micro-regions of Hungary (often referred to as the LAMR program, or least advanced micro regions) was launched within EU cohesion policy allocation by Hungary (Figure 5). Its stated goals included stimulating local economy (jobs) and reducing inner social and regional inequalities via infrastructure and human development (health, education, labour market… etc.).
This special program had a dedicated support framework (ca.320Mn EUR; minor compared to total amounts, but still something dedicated for lagging areas), which tried to develop both regulatory and operating environment in a positive direction.
For example, with extra funds combined from several Operative Programs (regional, social development., social infrastructure) and initiating complex innovative project packages in an iterative way. It aimed at improvement of local development capacities and incitement of collaboration among local actors, between local and central, and among different Operative Programs (funding).
These 33 least developed areas represented ca. 10% of national population, were mainly rural (2/3 without a town above 10 thousand people), mainly peripheral (1/2 on border, 2/3 in border region), mainly with large Roma population (1/3 of national Roma population), packed with an under-educated and low-skilled population and high child poverty73. Having its effects and relying on funds across several Operative Programs, the primary tools of territorial focusing within this program were: forcing prioritization in eligibility, extra-points in project-assessment, and increased funding intensity given for projects coming from these depressed areas.
This paper is, on one hand, assessing the success of this policy choice, this special experiment program, where it takes a look at numbers to assess the allocation of extra resources to these least advanced micro-regions had really happened; and, on the other hand, compares regional development resources coming from EU funding with other resources, such as national subsidies for investment as well as private investments.
73 20-30 % of Hungarian children live under the 60% median income at national level at this period.
Figure 5: The 33 least developed micro-regions (LHH33, dark green) targeted by the special complex program out of all local areas with severe socioeconomic disadvantages in Hungary (light green, amber).
3.5 Data
For the purposes of our analysis, at first a new micro-region and settlement-based database of funds was built, which represents a new element in the literature and the policy-practice. Previously only county-wise (NUTS 3) sub-national investment data have been published by the National Statistical Office of Hungary. Thus, earlier studies relied only on those. We connect local municipality-level demographic, infrastructure, economic, financial, business accounts and grants data originating from various different sources: for detailed EU grants allocation data the National Development Agency EMIR database, National Statistical Office T-Star data for detailed municipal level socio-economic data, Hungarian State Treasury data on government finances, Bureau van Dijk’s Amadeus database for business financial data74.
74 Due to data access problems with private sector financial data at company level from Hungarian Tax Office, we turned to a second best solution by using the Amadeus database, that is an international business data collection, covering several countries and years, widely used for both business and academic purposes.
After access issues and tedious cleansing of data is aggregated based on the 174 micro-regions structure used in Hungary since 200875. That is, with micro-regions ranked and classified based on the complex micro-regional development statistic created by the National Statistical Office of Hungary. For easier comparability, all financial data is deflated at end of term 2011 prices. Due to reasons of data availability, and to shed light on the 33 LAMR special program introduced in 2009, the empirical analysis focuses on the 2007-2011 period, but also compares results of the 2004-2006 period (former EU budget cycle) with respect to the 33 (47) least developed micro- regions targeted by the special program and/or the 94 less-developed micro-regions, that is the subsequent category of focus by the national policy.
The CSO of Hungary collects investment data only county-wise. Moreover, not separating public and private sector, this data it was not useful for our analysis at micro-regional level. Former studies only used such aggregate data at county level, or mere administrative data of number of registered businesses at municipal level, but not their actual financial data and especially investments of private sector. However, for the purposes of comparing private and public investment flows set out in this exercise, these were insufficient. As such, the decision to turn to Bureau van Dijk’s Amadeus international database for business financial data, and calculating private investment from firm level fixed assets data, depended on to the following formula:
Investmentt= fixed assetst – (fixed assetst-1 - depreciation t) >0 (Fixed assets corrected with depreciation)
Equity ratio (equity/total assets)>= 0.25
That is, the analysis only takes positive change in fixed assets as true private investment in a given year, if the firm has enough of its own capital to invest (leverage), not just re-values, its assets for accounting reasons.
3.6 Main Findings
3.6.1 Uneven Distribution: Regional Development Resources in Function of the Cumulative Population
In order to demonstrate the uneven distribution of development resources, a Lorenz- curve type chart was created to show the magnitude and distribution of development
75 At the analysed period, mirco-regions were also used as a planning category, not only serving statistical purposes but also some joint municipal projects also carried out at this level. From 2013, yet another governance change was carried out in Hungary, and the old-new “jaras” category was re- introduced at this territorial level, which however more or less overlaps with micro-regions.
grants from various sources: EU, national state budget or private investment (Figure 6). On the x-axis, population is cumulated along the complex development indicator (constructed by HU CSO and used by HU development policy as a major targeting variable). The y-axis shows the proportion of private, state, or EU-funded investment resources.
Figure 6. Distribution of different regional development resources 2004-2006 and 2007-11 by population cumulated across development levels.
Source: Own calculations from database.
It is visible, how in the first EU planning period right after accession (2004-2006), EU funds followed almost the straight population-proportional distribution (the diagonal would mark an absolutely even distribution); i.e. they are not larger than their proportion even in the least developed areas. The national state budgetary investment grants show a bump above the straight diagonal, marking higher than proportional funding going to the less developed parts, steeply increasing in the lower first two quintiles. At the same time, the distribution of private equity resources follows a completely opposite pattern, with very low proportions in the lower developed quintiles and a very sharp jump in the more developed micro-regions. This pattern is not unique to Hungary, and has long been the concern for economic geography and development policy, that private sector activity and investment is concentrated in more developed areas, contributing to widening gaps between regions. However. the magnitude of the differences is still striking in this case.
0 5000000 10000000 15000000 20000000 25000000 30000000 35000000
least developed
quintile
2. 3. 4. most
developed quintile
EU Coh.Pol. funds
State budget investment grants Private sector investment
Figure 7: The total sum of development resources in 2007-11 by micro region quintiles (along CSO complex indicator); from lowest to highest developed quintile.
Source: own calculations from database.
As shown in figure 7, national state budgetary grants for local government investment are negligible everywhere in these periods. The reason being mostly a crowding out of such national funds by EU cohesion policy funds that were becoming available from 2004 onwards. These EU funds (marked by the colour green in figure 7) and the level of their amount was similar for 3rd, 4th, and 5th most developed quintiles of micro-regions. Yet, while this equals half of the total available resources for those middle-range regions in the 3rd quintile, it is just ca.1/10th of all development resources in the upper, most developed quintile, where private sector investment dominates.
This highlights marked differences of development potential across micro-regions. At
the same time, this figure once again makes it visible and very clear how the majority (over 95% and large magnitude) of private investment (marked by the colour blue) were realized in the most developed 4th and 5th quintiles of micro-regions.
3.6.2 Opposing Development Patterns Emerge
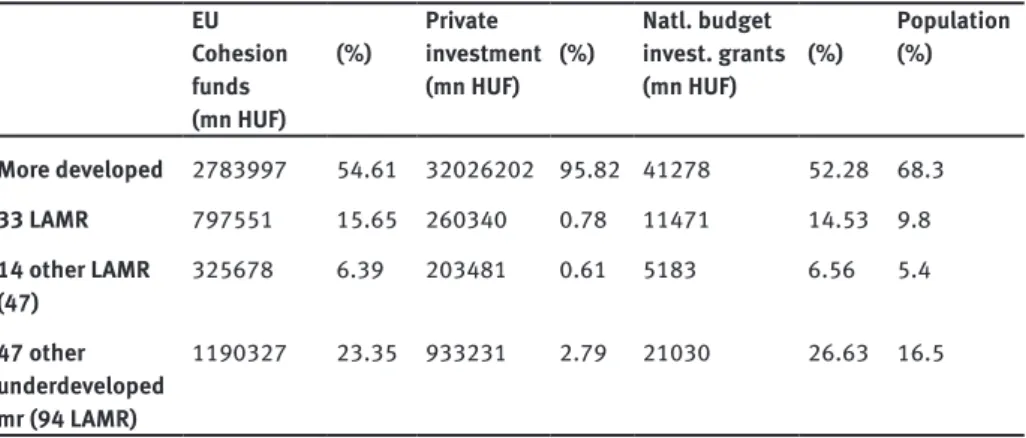
The special benefits and special treatment offered by the program to the 33 LAMR (extra points and greater proportions of funding; less need for own resources) had some effects, but could not be effective enough on their own. Although 15.65% of all EU funds went to the least developed 33 micro-regions between 2007-2011 (Table1), which is larger than their population proportion (10%), the optimal utilisation of funds is hindered by the fact that there are fewer innovative long-term development projects in these regions, because their absorption capacities are lower, the institutional system and human capacity are also weaker than average. National public investment resources, although much smaller in magnitude, seem to follow similar patterns to EU funds allocation (though allocated through different channels), i.e. not having much compensatory effect.
Table 1: Development Resources in micro regions (NUTS4) of HU. 2007-2011 EU
Cohesion funds (mn HUF)
(%) Private investment
(mn HUF) (%) Natl. budget invest. grants
(mn HUF) (%) Population (%)
More developed 2783997 54.61 32026202 95.82 41278 52.28 68.3
33 LAMR 797551 15.65 260340 0.78 11471 14.53 9.8
14 other LAMR
(47) 325678 6.39 203481 0.61 5183 6.56 5.4
47 other underdeveloped mr (94 LAMR)
1190327 23.35 933231 2.79 21030 26.63 16.5
Source: own calculations from database
As hinted by new economic geography and growth theories, more than half of EU origin development funds, and also investment grants from national budgetary sources, were allocated to better developed parts of the country in the analysed period (Table1), focusing on growth-enhancement investments, that serve the economic growth and thus overall convergence of Hungary to the rest of the EU. Striking is the fact, however, that during the same time period, 95% of private investment has been realized in these more developed micro-regions, while only less than 1% (!) flowing
into the 33 LAMR—a fact very telling on its own about differences in development potentials and opportunities and the strong regional disparities resulting from market forces alone.
The following Figure 8 summarizes development resources in per capita terms in the two periods in different micro-regions by development categories used by policymakers in Hungary. One can detect the shrinking size and role of national investment grants as well as the growing (both magnitude and importance of) EU funds in all categories for the period after 2007, when Hungary was indeed one of the major beneficiaries of EU cohesion policy. But what is most apparent is that, while the national average is a development pattern relying mostly on private investment resources and just partially on public funds, in the disadvantaged micro-regions the pattern is the opposite. Here the resources for development are coming from EU funds (red bars), notably larger per capita than the national average. This latter fact reflects the goals of territorial cohesion. However, the lack of private resources for development in these most disadvantaged areas is drawing an opposing development pattern (or rather one of under-development), an almost fully grant-dependent path.
This seems inevitable, given the lack of other resources in these regions. However, it is not sustainable in the long term.
8.1110.93 90.22
9.5311.70 27.04
8.9414.79 35.60
10.7711.16 44.99
1.76 123.03
211.63
2.17 183.63
56.02
1.54 127.67
92.70
2.09 148.03
109.40
050100150200
National average 33 MDMs other 14 MDMs other 47 DMs National average 33 MDMs other 14 MDMs other 47 DMs
2004-2006 2007-2011
Public grants for local govt.invest. EU funding Private investment
in thHUF
Graphs by yearcat
Per Capita resources in the Disadvantageous Microregions
Figure 8: Per capita development resources in the disadvantaged micro-regions.
Source: Own calculations from database.
The LAMR program effect is shown by the fact that although the funds allocated through it represented only ca.15% out of the total EU funds portfolio, the funds paid per capita considerably exceed figures of the ‘control group’: that of 14 other most disadvantaged micro-regions for whom the program was unavailable (also underdeveloped, but just beyond the cut-off point in the complex development indicator used for selection). The latter can be considered the losers of the program- limit, since they received somewhat larger per capita EU funds than the national average, yet significantly lower than the 33 micro regions involved in the LAMR program, or even less than other, not so well-developed, but not the most depressed micro-regions.
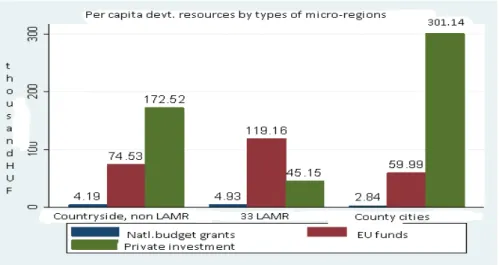
Broken down across different settlement-types (Figure 9), the per capita development funds show these opposing development patterns from another angle:
micro-regions containing county cities show a typical pattern similar to the national average. Even those countryside micro-regions that do not have a major city as their poles but are not in the least-developed category, have a similar pattern of private resources being highest (though significantly smaller) and somewhat larger EU funds per capita than MRs with county cities. Yet the least advantaged 33 MRs—that were the focus of the special program—indeed show an opposite pattern: small, private, and highest EU origin development resources. Hence the conclusion that in general, micro-regions and cities develop mainly due to private sector investment activity, where public grants play only additional role, while the least developed are characterized by huge grant-dependence
Figure 9: Per capita development resources by micro-regions with different settlement types.
Source: Own calculations from database.
3.6.3 Spatial Patterns Confirm Opposing Development Trends
If we put the above results on maps, the opposing development patterns are even more visible in terms of geographic location as well (Figure 10).
33 LHH 75 000 - 250 000 250 000 - 608 000 608 000 - 1 010 000 1 010 000 - 2 202 000 2 202 000 - 10 090 000 10 090 000 - 25 882 000
1 főre jutó piaci beruházás kistérségenként 2004-2011
Figure 10: Per capita private investment (upper)) and per capita (lower) EU funds received by micro- regions (NUTS4) of Hungary, 2007-2011. Darker areas show higher per capita amounts, dots signal the 33 least advantaged micro-regions affected by the LAMR program.
Source: Own calculations based on database.
It should be noted that per capita amounts in the LAMR micro-regions are showing a somewhat upward biased picture, due to the low population of these areas. However, if we compare total and per capita amounts of EU funds granted and paid for different micro-regions in Hungary (Figure 11), it becomes obvious that the largest amount in total magnitude went to the more central regions and/or growth poles of the country, as shown by the numbers in the previous figures.
Figure 11: Total (upper) and per capita (lower) amounts of EU funds received by different micro- regions in Hungary, 2007-2011.
Source: Own calculations based on database.
This is dictated by the logic of external convergence (of Hungary as a whole), by Lisbon goals of growth and employment orientation, competitiveness… etc.
Internal convergence within Hungary was somewhat (and solely) served by EU-funds allocation, but, as noted, the quality of its absorption could be improved. The analysis of what specific goals these resources went for, and the usefulness/socioeconomic development contribution of those goes beyond the scope of this paper, but is definitely worth consideration in future work.
3.7 Conclusions & Policy Implications
Apart from describing the differences in private and public investment activities, flow of investment funds between well-off, more developed areas and the most deprived, and least developed ones, this chapter highlights the growing importance of governmental budgetary resources (be it national, or EU) for the development potentials of deprived areas, since very small amounts of private investment get realized there. It raises awareness of the deep structural problems facing the least developed micro-regions, as well as how national and EU resources have tried and managed to tackle these issues. However, especially under an austerity economic environment, but during periods of growth too, governments need to think wisely about how to allocate public funds in an efficient and effective, yet equitable manner.
Indeed the conflict between efficiency and convergence does exist in a Europe that is to remain competitive and growing in the integrated world economy, yet faced with stubborn regional disparities that stay and even grow within EU and within countries.
Finding the right sources of growth for different types of core and periphery regions, balance on the edge of efficiency, and effectiveness yet care for equity, is not an easy task for governments at all levels. With the new EU multi-annual budgetary framework on the horizon, Europe really needs to re-think the overall costs and benefits of its redistribution policy, and rigorously assess its effects.
Overall convergence of Hungary, as a country towards EU averages in terms of economic development (income, GDP levels… etc.), as well as economic recovery from crisis, is indeed better served by concentrating development resources on growth poles and economic growth-oriented investments. As tables and figures in this study show, more than half of the total amounts of EU funds went to better developed parts of the country. Yet, for the sake of reducing within-country disparities, support for the lagging regions is still important, as very significant disparities exist and continue diverging in economic and social development and economic potential among Hungarian regions today.
As it has been shown, also in this chapter, private investment almost exclusively flows into more developed regions: only 1.7% of private investment was realized in those 33 micro-regions. Thus, market forces strengthen regional differentiation. The scale of public funds arriving at the impoverished regions exceeds that of private
investments, and, in per capita terms, also EU funds absorbed by other areas. As a result, in these least developed micro-regions, development policy can indeed trigger a significant relative move. Nonetheless, the grant-dependent nature of their development path is also evident. The role of EU funds has grown even more in their development potential with the decrease of national decentralized resources.
A major contribution of the analysed special program, for targeting the most disadvantaged 33 micro-regions, was that it has managed to induce some positive changes in the fund absorption capacities of these laggard areas (Figure 12) via facilitating connections among local development actors and institutions. Results show marked differences in per capita allocations, especially compared to data from the other 14 disadvantaged micro-regions not treated by this special program (Figure 7). Although, in terms of program coordination and execution, it was far from optimal.
Figure 12: Funds absorption improved: Per Capita EU funds disbursement in LHH33 micro-regions between 2007-2011 in % of national average.
Source: National Development Office Hungary, 2013, Program Evaluation Report, p.92.
More developed regions of the country received larger chunk of EU funds for development in the first 2004-2006 period (65%), than in the second period between 2007-2011 (54.5%). There was slight improvement in their role in internal convergence, but as said, the large majority of private investment, and thus economic development, happens in those better-developed areas.
The effects of LAMR special program is captured nicely in that the funds allocated to the least advanced micro-regions are ca.15% out of the whole EU funds
portfolio76, the funds paid per capita considerably exceed figures of the other 14 most disadvantaged micro-regions for whom the program was unavailable. This unavailability is due to their position just beyond the cut-off point, lending them a unique class as a natural ‘control group,’ and due to several more developed areas.
However, per capita figures draw a somewhat upward biased picture, due to the low population of these laggard micro-regions. Likewise, looking at total amounts instead of per capita shows that more than half of EU funds went to better-developed areas, and growth poles of the country. From a detailed breakdown along different subsidy categories, it is visible that these targeted micro-regions applied for and received higher than average portions of funds for the improvement of local communal services, smaller infrastructure development, funds for active labour market policies, and funds given for businesses. Nonetheless, they were fairly underrepresented in funds given for research and development, higher education, and human resource development in general (Dynamiting depressed regions, Program Evaluation, NDA 2013).
Well-targeted programs of even smaller amounts, such as this special program introduced in Hungary for the least advantaged micro-regions analysed here, can offer a chance to smooth and slow down negative processes, as the development of such laggards is grant-dependent. The practice of highlighting/favouring disadvantaged micro-regions is a useful and necessary policy tool. However, the devil is in the details, where targeting complex program design, setting outcomes and policy tools right, special treatment and local planning, and cooperative implementation are key for the success of such special policy programs. As previous research has pointed out, chances of bad implementation, clientelistm, political deterrence, rent seeking, and elite-capture are threats especially at local levels. These dangers are relevant in all cohesion countries, but are especially strong for new CEE member states, with fragile and emerging institutional systems.
It has been shown that, not only are lagging regions behind with their growth and development, but often, due to weak institutions, lower capacities to innovate, lack of human capital and so on, they cannot really make productive use of available resources. Hence, they become prone to persistent under-development. On one hand, cushioning lagging regions with such well-targeted and complex programs can help draw them out of these vicious cycles. Yet, there are risks and potential pitfalls too.
Such interventions distort efficient functioning of markets by favouring certain types of activities, and entities and so on. Such favouritism induces adverse selection in many cases, as well as shelters these regions from the markets. They also crowd out private investments, leaving these regions very grant-dependent and thus fragile if pubic funding becomes non-available. The very strong dependency culture has its roots in new CEE member states and in their common socialist past. However, in such 76 That is, higher than their 10% proportion from the country’s population.
regions, it gets even more re-enforced and makes them less able to adapt and innovate, and more prone to local elite capture and clientelism. It seems that strengthening such laggard regions in the long term is only possible with a combination of grants, and provided public goods and services; but also along with an institutional reform and strengthening of human capacities.
Serious improvement in terms of territorial policymaking can only be expected if sectorial policies and social agenda become ‘space-sensitive’ and ‘place-based’, as suggested by Barca (2009: 120-125). Without these, according to Barca, mere provision of more public funds is neither enough, nor efficient, as it can easily lead to grant- dependency—as evident in the outcome of this case. With this in mind, Europe and its member states (Hungary included), need to further think about how to reconcile the truly conflicting goals of overall growth and innovation, as well as on social cohesion and partial regional convergence of core, peripheral, and other regions, in a more nuanced way.
Acknowledgement
This research partially stems from results of an evaluation report for the National Development Agency of Hungary, the author would like to thank Balazs Varadi, Flora Samu and Timea Suto (Budapest Policy Institute) for their comments and assistance.
References
Acemoglu, D. (2006) ‘Modelling Inefficient Institutions’. NBERWorking Paper No. 11940, National Bureau of Economic Research, Inc.
Acemoglu, D. and Johnson, S.H. (2006) ‘De Facto Political Power and Institutional Persistence’.
American Economic Review, Vol. 96, No. 2, pp. 325–30.
Acemoglu, D. and Robinson, J.A. (2000) ‘Political Losers as a Barrier to Economic Development’.
American Economic Review, Vol. 90, No. 2, pp. 126–30.
Aschauer, D. 1989. “Does public capital crowd out private capital?”, Journal of Monetary Economics, vol 24 (2), 171-188.
Aschauer, David Alan (1989): “Is public expenditure productive?,” Journal of Monetary Economics, Elsevier, vol. 23(2), pages 177-200, March.
Bachtler, J. – Downes, R. 2000: The Spatial Coverage of Regional Policy in Central and Eastern Europe. – European Urban and Regional Studies 7: (2). pp. 159–74.
Bachtler, J. -Barnier,M.- Stahl,G.- Lluna, D., -Ziegler,A. 2003 EU cohesion policy: Challenges and Responses Intereconomics,Vol. 38, 2003, No.6,pp.292- 310
Bachtler, J., - McMaster, I. (2007). EU cohesion policy and the role of the regions: Investigating the influence of structural funds in the new member states. Environment and Planning C:
Government and Policy, 26, 398–427. doi:10.1068/c0662
Bailey, D. – Propris, L. DE 2004: A Bridge Too Phare? EU Pre-Accession Aid and Capacity-Building in the Candidate Countries. – Journal of Common Market Studies 42: (1). pp. 77–98.
Baldwin Richard (2003): Economic Geography and Public Policy, Princeton University Press.
Baldwin, R. E. (2011). Trade and industrialisation after globalisation’s 2nd unbundling: How building and joining a supply chain are different and why it matters (Working Paper No. w17716).
Cambridge, MA: National Bureau of Economic Research (NBER).
Barca, Fabrizio 2009.: An Agenda for a Reformed cohesion policy. A place-based approach to meeting European Union challenges and expectations. Independent Report. http://ec.europa.
eu/regional_policy/policy/future/barca_en.htm
Barro R. J. and Sala-I-Martin X. (1992) Convergence, Journal of Political Economy 100, 407–443.
Barro, Robert J. (1990): “Government Spending in a Simple Model of Economic Growth”, Journal of Political Economy, Vol.98.No5.
Becker, S. O., Egger, P. H., - Von Ehrlich, M. (2008). Going NUTS: The effect of EU structural funds on regional performance. Journal of Public Economics, 94, 578–590. doi:10.1016/j.
jpubeco.2010.06.006
Békés, G.-Muraközy B. (2011): Magyar gazellák: gyors növekedésű vállalatok jellemzői és kialakulásuk elemzése Magyarországon, MTA KTI, TÁMOP - 2.3.2-09/1 Műhelytanulmányok T/4
Beugelsdijk, M., - Eijffinger, S. C. W. (2005). The effectiveness of structural policy in the European Union: An empirical analysis for the EU-15 in 1995-2001. JCMS: Journal of Common Market Studies, 43, 37–51. doi:10.1111/j.0021-9886.2005.00545.x
Bloom, S. – Petrova, V. 2013: National Subversion of Supranational Goals: ‘Pork-Barrel’ Politics and EU Regional Aid. – Europe-Asia Studies 65: (8).pp. 1599–1620.
Boldrin, M. and F. Canova 2001. Inequality and Convergence in Europe’s Regions: reconsidering European Regional Policies. Economic Policy, 32, 205-245.
Boschma, R. (2005). Proximity and innovation: A critical assessment.Regional Studies, 39(1), 61–74.
doi:10.1080/003434005200032 0887
Boschma, R. (2015). Towards an evolutionary perspective on regional resilience. Regional Studies, 49(5), 733–751. doi:10.1080/ 00343404.2014.959481
Bouvet, F. – Dall’erba, S. 2010: European Regional Structural Funds: How Large Is the Influence of Politics on the Allocation Process? – JCMS: Journal of Common Market Studies 48: (3). pp.
501–528.
Brakman, S.-Garrettsen- Marrewijk, 2005. The New Introduction to Geographical Economics, Cambridges University Press,Cambridge M.A. USA 2005
BRUSZT L. 2008: „Multi-Level Governance – The Eastern Versions Emerging Patterns of Regional Developmental Governance in the New Member States. – Regional and Federal Studies 18: (5).
pp. 607–628.
Budapest Szakpolitikai Elemző Intézet (2013): Egészségügyi Tárgyú Nsrk-Fejlesztések Kvantitatív Értékelése – NFÜ megrendelésre, LOT1.
Cappelen, A., Castellacci, F., Fagerberg, J. and Verspagen, B. (2003) ‘The Impact ofEU Regional Support on Growth and Convergence in the European Union’.JCMS, Vol. 41, No. 4, pp. 621–44.
Cartwright, A. – Bátory Á. 2012: Monitoring Committees in cohesion policy: Overseeing the Distribution of Structural Funds in Hungary and Slovakia. – Journal of European Integration 34:
(4). pp. 323–340.
Charron, N., Dijkstra, L., - Lapuente, V. (2014a). Mapping the regional divide in Europe: A measure for assessing quality of government in 206 European regions. Social Indicators Research, 122, 315–346. doi:10.1007/s11205-014-0702-y
Charron, N., Dijkstra, L., - Lapuente, V. (2014b). Regional governance matters: Quality of government within European Union member states. Regional Studies, 48, 68–90. doi:10.1080/00343404.2 013.770141
Charron, Nicholas, Dijkstra, Lewis and Lapuente, Victor, (2014), Regional Governance Matters:
Quality of Government within European Union Member States, Regional Studies, 48, issue 1, p.
68-90,
Crescenzi, R., - Giua, M. (2014). The EU Cohesion policy in context: Regional growth and the influence of agricultural and rural development policies. http://www.lse.ac.uk/
europeanInstitute/LEQS/LEQSPaper85.pdf
Crescenzi, R., - Rodríguez-Pose, A. (2011). Innovation and regional growth in the European Union.
Berlin: Springer Science - Business Media.
Crescenzi, R., Nathan, M., - Rodríguez-Pose, A. (2016). Do inventors talk to strangers? On proximity and collaborative knowledge creation. Research Policy, 45(1), 177–194. doi:10. 1016/j.
respol.2015.07.003
Csite A.-Jakobi Á. (2009): Területi diszharmónia: A 33 LHH kistérség NFT-s és ÚMFT-s fejlesztési forrásszerző teljesítményének néhány sajátossága
D’Este, P., Guy, F., - Iammarino, S. (2013). Shaping the formation of university–industry research collaborations: What type of proximity does really matter? Journal of Economic Geography, 13(4), 537–558. doi:10.1093/jeg/lbs010
Dąbrowski, M. 2012: Shallow or deep Europeanisation? The uneven impact of EU cohesion policy on the regional and local authorities in Poland. –Environment and Planning C: Government and Policy 30: (4). pp. 730–745.
Dall’erba, S., - Le Gallo, J. (2008). Regional convergence and the impact of European structural funds over 1989–1999: A spatial econometric analysis. Papers in Regional Science, 87, 219–244.
doi:10.1111/j.1435-5957.2008.00184.x
Davoodi H. and Zou H. (1998) Fiscal decentralisation and economic growth: a cross country study, Journal of Urban Economics 43, 244–257.
Ebel R. D. and Yilmaz S. (2002) On the Measurement and Impact of Fiscal Decentralisation. Policy Research Working Paper Number 2809. The World Bank, Washington, DC.
Ederveen, S., H. de Groot, and R. Nahuis 2006. “Fertile Soil for Structural Funds? A PanelData Analysis of the Conditional Effectiveness of European cohesion policy”. Kyklos, 59 (1), 17-42.
doi:10.1111/j.1467-6435.2006.00318.x
European Commission – Eurostat. (2015a). Economy and finance. [Adobe Digital Editions version].
Retrieved from http://ec.europa.eu/eurostat/web/main/home
Ezcurra R - Rodríguez-Pose A.(2013) Political Decentralization, Economic Growth and Regional Disparities in the OECD, Regional Studies, 47:3, 388-401, DOI:
10.1080/00343404.2012.731046
Ezcurra R. and Rodríguez-Pose A. (2009) Measuring the regional divide, in Capello R. and Nijkamp P.
(Eds) Regional Dynamics and Growth: Advances in Regional Economics, pp. 329–353. Edward Elgar, Northampton, MA.
Farole, T., Rodríguez-Pose, A.,- Storper, M. (2011). Cohesion policy in the European Union: Growth, geography, institutions. JCMS: Journal of Common Market Studies, 49, 1089–1111. doi:10.1111/
j.1468-5965.2010.02161.x
Ferry, M. - McMaster, I. (2013). Between Growth and Cohesion: New Directions in Central and East European Regional Policy. Europe-Asia Studies. 65. 10.1080/09668136.2013.832958.
Fratesi, U.-Perucca, G. (2014). Territorial capital and the effectiveness of cohesion policies: An assessment for CEE regions. Investigaciones Regionales, Special Issue 2014,
Fujita,M.-Krugman,P.-Venables, A.J (2001): The Spatial Economy: Cities, Regions, and International Trade, MIT Press.
Gábor Békés - Péter Harasztosi (2013): Agglomeration Premium and Trading Activity of Firms, http://
cefig.eu/view/list/ (Utolsó letöltés: 2012.01.12.)
Gramlich, Edward M 1994. “Infrastructure Investment: A Review Essay,” Journal of Economic Literature, American Economic Association, vol. 32(3), pages 1176-96, September