To What Extent is Hungary a Knowledge- Based Economy?
GYÖRGY BODA, Ph.D.
ASSOCIATE PROFESSOR
CORVINUS UNIVERSITY OF BUDAPEST e-mail: gyorgy.boda@uni-corvinus.hu
SUMMARY
While we can generally see a decline of the share of industry, parallel to this trend the Visegrad countries are taking over more industrial production (mainly assembly). This will reduce the requirements for innovative knowledge workers. This
“over-industrialisation” has led to a dual economy, in which domestic companies compete by utilising the comparative advantages of a cheaper labour force. In fact, products whose comparative advantages do not decrease as the development gap narrows are needed for sustainable economic development. If we continue to hinder the development of non-material services this way, then by decreasing innovative capacities we shall get deeper into the trap of dependent market economies.
Keywords: knowledge content, realisation of comparative advantages, upgrading the factors of production, knowledge capital, dependent market economies
Journal of Economic Literature (JEL) codes: E20, E21, F43, F62 DOI: http://dx.doi.org/10.18096/TMP.2017.01.06
I NTRODUCTION
For centuries the greatest problem associated with the evaluation of Central and Eastern European (CEE) economies is that, although these countries follow the development of Western European nations in many aspects, they never do it effectively enough so that the accepted social and economic remedies can resolve their most pressing social concerns. As a consequence, a political reaction always arises that attacks the Western European paradigms and tries to replace them with other ones.
These developmental international arrangements always take into account mutual interests, but it can be debated whose interests will be best (or better) served.
There are no clearly established rules in a "win-win"
situation to determine how much one party gains compared to the other. It may happen that such an international arrangement causes unforeseen damage to one of the party’s interests in the long run. As the results are only partially successful, the solutions can always be attacked by saying that they serve only the interests of Western Europe.
These unsatisfactorily-resolved social problems will lead to discussions, fights, and developmental detours, and they are accompanied by significant social loss. The goal of this paper is to help to minimise these losses, because in the long run the nations of Europe have a common, interdependent fate.
T HE L ONG -T ERM C ONSEQUENCES OF AN I NADEQUATELY T HOUGHT
O UT “W IN -W IN ” S ITUATION
If we look at the change in the structure of consumption of the European countries, we see a clear decline in the shares of traditional sectors (agriculture and industry) and an expansion in the share of non-material sectors.1 This statement can be amplified by a further important observation: these changes in the consumption structure are proportional to the economic development level of each country. The more developed a country, the more its traditional industries shrink, and the greater the role of non-material services in its economy. CEE fits naturally into this process.
1 The actual pattern of consumption and production is shown in Figures F.1 and f.2 in the Appendix
If we examine the long-term transformation of the production structures in Europe, the picture is not the same for each country. The Visegrad countries are taking over more and more specific types of industrial production (mainly assembly) from the developed European centre.
Thus, the share of industry in their production structure is
higher than what their economic development would justify. This difference is a consequence of the realisation of the comparative advantages in foreign trade. Its mechanism is presented in Figure 1.
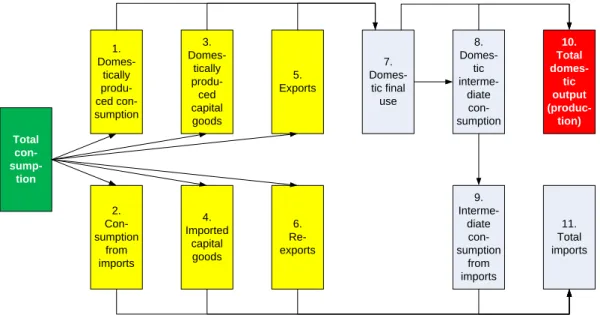
Figure 1. Decisions that detach the production structure from consumption structure with the help of foreign trade
If there were no foreign trade, then we ought to produce what we consume. So the production structures would closely fit the consumption structures. This link can be loosened by deciding what we are going to produce ourselves, and what we would like to import (Boxes 1-2).
However this decision requires further decisions. It must be decided what exports will offset the consumption of imports (Boxes 5-6). To produce goods for both consumption and export we need capital goods, so we should also decide what kind of capital goods we are going to produce or import (Boxes 3-4). Only after these decisions can we determine the domestic final use (Box 7).
But the enterprises delivering the products for final use will order from other companies, and that multiplies the domestic final use, and this intermediate use will require additional imports as well (Boxes 8-9). So the domestic production of a country is the total of the boxes of the upper row and the imports of the country by summation of the boxes below. These are the decisions that increase the shares of certain sectors in the production structure, while others are reduced.
It is important to note that these decisions are made by the state and the companies together. If the state limits or bans the import of certain products, then it promotes domestic production. In this case the companies mainly concentrate on developments where they are allowed to. If there is no state intervention, then comparative advantages will govern the enterprise decisions. This leads to the known general case where, in the more developed, more
industrialised countries, the production of industry exceeds domestic consumption of those products.
However, it is also true that as economic development advances, the share of industry within such a country’s production shrinks, and these countries will concentrate their domestic activities in ever increasing proportion into non-material services.
This process can be described as classic modernization.
People increasingly consume IT and business services, educational and health services, and sophisticated administrative services. These services are often very complex in content, and they require significant allocations of resources for their production. In addition, modern agriculture and industry need scientific services, without which their development would halt and their effectiveness decrease. All these activities are non- material services, the increasing share of which we are speaking about.
This process is also going on in Central and Eastern Europe, but somewhat distortedly. The share of the region's industry is greater than its economic development level justifies, and accordingly the share of non-material services is less. This process is led by the Czech Republic, followed closely by Slovakia and Hungary.
We should mention that in Hungary a very simplified interpretation of what it means to be “productive” has recently been revived, according to which only agriculture and industry can be regarded as productive. In the history of Hungarian economic science, there was a discussion in
Total con- sump-
tion
9.
Interme- diate con- sumption
from imports 1.
Domes- tically produ- ced con- sumption
3.
Domes- tically produ- ced capital goods
5.
Exports
4.
Imported capital goods
6.
Re- exports
7.
Domes- tic final use
10.
Total domes-
tic output (produc-
tion) 8.
Domes- tic interme-
diate con- sumption
11.
Total imports 2.
Con- sumption
from imports
the 1970s when, in accordance with international developments, a different, more modern concept was formulated in which anything that generated income was designated as productive. Outdated views have been revived because the “over-development” of industry had to be explained somehow. This word – “over- development” – is an important concept of study. It does not mean that industry should not be developed, but that
“over-development” must be re-thought. Is it good for the Visegrad countries if they raise the proportion of their industry significantly higher than is justified by their economic development, while the non-material sphere’s development is slowed down? Why may the
“overdevelopment” of industry be a problem?
Figure 1 shows just how one should define the requirements for capital goods in the production process.
However, for production, headcount is also needed, which requires equivalent investment mainly in education and healthcare. It can be proved that these human investments are less if the share of industry is greater. This is shown in Figure 2.
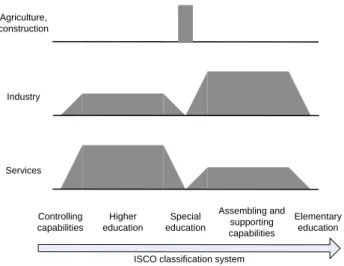
Figure 2. The human investment requirements of different industries
Based on the labour and production statistics of EUROSTAAT, industries can be divided into three groups according to their labour requirements per unit of production, both in the developed and in the Visegrad countries.
To the first group belong the specialised sectors such as agriculture, construction, and trade. These are very ancient industries where human work has been gradually replaced by capital. They mainly require labour that is equipped with specific knowledge characteristic of these industries. So agricultural companies mainly require skilled workers in agriculture, trade companies need workers specialised in trade, etc. This is illustrated by the single histogram which rises at the special education section of the horizontal axis. The flat horizontal line indicates that
there is no significant need for workers from the other educational groups.
The second group includes the traditional complex sectors, for example, industry. All kinds of expertise are needed, but the pressure to increase profit by increasing productivity forces enterprises to replace expensive, highly skilled workers with capital and to increase the number of cheap assembly workers whose main task is to operate machinery. Over the long term this leads to an industrial specialisation with not-too- high, special vocational educational needs. It can be proved statistically that the majority of the people employed in the industrial sector are less educated skilled workers and assemblers, and there is a tendency to outsource the highly educated employees into the sector of non-material services. This is illustrated by the shape in the middle of Figure 2, where the rhombus of highly skilled workers is lower than that of the less educated workers. (at the bottom of Figure 2 the arrow symbolises falling educational needs).
Finally into the third group are classified the emerging industries that offer a foundation for renewal. Here the employees face complex problems that can be solved only by higher and more general knowledge which fosters high-level innovation. Here the heights of the rhombuses are just the reverse, regardless of whether this relates to the Czech Republic or Germany.
It is logical that new activities always need more work and are more knowledge-intensive. Accordingly, the process of specialisation requires average skills and knowledge.
Using Leontieff’s open-static input-output model, the author made calculations to quantify the impact of assembly-type industrial overdevelopment on the required human investments. The results are summarised in Figure 4.
These computations need rather large data samples and intensive processing. From the OECD input-output database we take the input-output tables for around 20 countries. From their “B” type domestic table we deduct their domestic final use vectors and their Leontieff inverse matrices. With their help, we build the equation
Q?y? = x?
for each selected country noted by ?, where ? is HU for Hungary, SK for Slovakia, CZ for Czech Republic, PL for Poland, FR for France, GE for Germany, AU for Austria, and SE for Sweden. In this equation
Q? = [E-B?<x?>-1]-1, where B? is the matrix of domestic intermediate use,
x? is the vector of production, and y? is the vector of domestic final use.
The equation QHyH = xH demonstrates the computation of xH, the Hungarian production vector, as a function of yH, the Hungarian domestic final use vector.
In the next step, from the domestic final use vector of each selected county we calculate a modified domestic
Controlling capabilities
Higher education
Special education
Assembling and supporting capabilities
Elementary education Agriculture,
construction
Industry
Services
ISCO classification system
final use vector whose structure is the same as in the original final use vector, but its total is equal to the Hungarian final use vector’s total:
y? = y? (<1’yH> /<1’y?>)
Then we calculate a production vector as the product of the Hungarian Leontieff inverse and the modified domestic final use vector in the following way:
x? = QHy?.
The result x? shows what would be Hungary’s production by sectors if Hungary had the ? selected country’s domestic final use structure.
Then we take the matrix FH of Hungarian employment, having an ISCO x INDUSTRY structure, whose ij-element
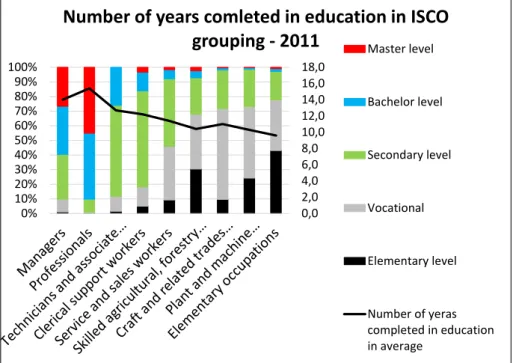
shows how much labour is needed for the production of industry j with the qualification i. But this data does not reflect well the human investment requirements, because they are expressed merely in the numbers of persons. It does not take into account that a highly skilled worker studies on average 15 and a half years, while an assembler only 10.3 years (See Figure 3).
Therefore, from the FH employment matrix we create a TH knowledge matrix by multiplying each row of FH by the average number of years people should spend in study to get the appropriate ISCO classification. So TH is an ISCO x INDUSTRY matrix whose ij-element shows that for the production of industry j how many years should be spent in different schools to get the ISCO classification i.
This way the headcount requirements are modified to better express the necessary investment in education.
Source: Lakatos 2015
Figure 3. Schooling structure in different occupations Then we determine the
T?x?
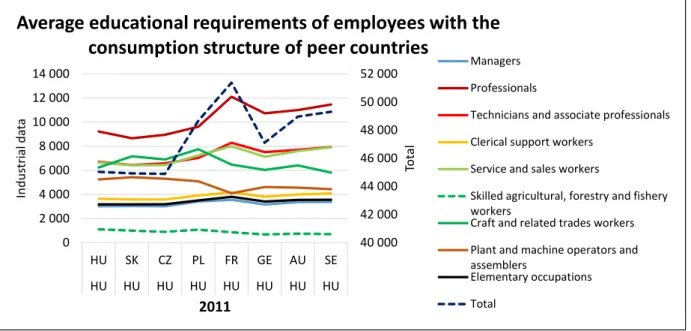
product which shows how Hungary’s learning demands (practically equivalent to knowledge demands) would evolve if Hungary had the domestic final use of country ?.
The results are shown in Figure 4. The HU HU values show the actual Hungarian data. The CZ HU values indicate that Hungary could have the same output with less knowledge if it took the Czech domestic final use structure. However, if Hungary would approach the domestic final use structure of the more developed countries, then the country could get into trouble, because more knowledge would be required.
0,02,0 4,06,0 8,010,0 12,014,0 16,018,0
10%0%
20%30%
40%50%
60%70%
80%90%
100%
Number of years comleted in education in ISCO grouping - 2011
Master levelBachelor level Secondary level Vocational Elementary level
Number of yeras completed in education in average
Figure 4. Knowledge requirements of Hungarian employment in case of takeover of the domestic final use structure of some selected developed countries The number of assemblers on the Slovak and Czech
paths would not decrease, however, in all other cases it would. Fewer highly skilled people would be required in the case of “over-industrialisation,” while significantly more would be necessary if we follow the developed countries. Otherwise, the results of calculations can be understood even without input-output modelling. If the weight of industry in domestic final use is reduced, and the weight of non-material services is increased, then demand would increase for occupations which are necessary for the new types of activities. Vice versa: assembly type industry overdevelopment can reduce the requirements for highly educated, innovative knowledge workers. Of course it is a question whether this is good in the long run. It may prove to be a trap. Hereinafter I would like to investigate this issue on the micro level as well.
T HE R EALISATION OF
C OMPARATIVE A DVANTAGES
AND THE R EDUCTION OF THE
D EVELOPMENT G AP
If the CEE countries „over-develop," then it cannot be dismissed as a small problem. Complicated processes lead to this unfortunate outcome. These countries have democratic social systems. During the overdevelopment process, several governments succeeded each other in power. Obvious errors would have been easily eliminated by succeeding governments. There must be deeper causes if multiple governments support the same processes. Their goal must have been to utilize the comparative advantages as described by Ricardo. As a result of historical developments, during the transition from planned economies into market economies, the Central and Eastern European countries had one major comparative advantage:
their medium-skilled, low-wage, but well-educated masses of workers. Obviously this had to be for sale if there was such a demand.
A leading Chinese economist, Justin Lifu Yin, named this pursuit of comparative advantage as the driving force of the renewal of China.2 His views can be demonstrated by Figures 5 and 6.
2 See Lin 2012, Demystifying the Chinese Economy, pages 111-122.
40 000 42 000 44 000 46 000 48 000 50 000 52 000
0 2 000 4 000 6 000 8 000 10 000 12 000 14 000
HU SK CZ PL FR GE AU SE
HU HU HU HU HU HU HU HU 2011
Total
Industrial data
Average educational requirements of employees with the consumption structure of peer countries
ManagersProfessionals
Technicians and associate professionals Clerical support workers
Service and sales workers
Skilled agricultural, forestry and fishery workers
Craft and related trades workers Plant and machine operators and assemblers
Elementary occupations Total
Figure 5. Selection of technologies with different factor endowments Explanation:
m(1)R – the gradient of technology function of the rich country with minus sign;
m(1)P – the gradient of technology function of the poor country with minus sign;
m(1)R > m(1)P.
Lin (2012) claims that, at a lower stage of social development, producers are poorer and less able to accumulate. Richer societies are already advanced in accumulation. The enterprises of a rich country employ more machines and fewer workers. For them the red line represents the optimal technology, which in this example will work with 6 units of labour and almost 4 units of capital. For the companies of a poorer country, the capital is expensive and the labour is cheaper. Obviously they will select a technology with less capital and more labour, which in our examples requires 9 units of labour and two and half units of capital. The technology lines expressing their capital-to-labour ratios will touch the isoquant
representing equal outputs of different capital and labour mix at different points.
This law can be generalised. With more labour intensive technology, the poorer country’s poorer enterprises can compete with the rich country’s richer enterprises. This shows the utilization of comparative advantages.
The theory of comparative advantages, however, deals only with factors that explain foreign trade. In his famous example, Ricardo explained why less-developed Portugal could produce more efficiently by exporting wine to England in exchange for imports of textiles, but he did not investigate the question of whether the development gap would be reduced between the two countries if both utilised their comparative advantages. According to Lin, however, this is possible if the poorer country’s accumulation is quicker than that of the richer country. He named this process upgrading the endowment structure, which is the continuous and if possible quicker increase of the capital equipment of labour, i.e. capital used by one unit of labour.
Figure 6. Changes in selection of technologies over time
0 1 2 3 4 5 6 7 8
1 2 3 4 5 6 7 8 9
Capital
Labour
Selection of technologies when endowment of production factors is different - 1st period
1st period's isoquant [y(1)]
Rich country's technology at the 1st period [y(1)'(x=3)]
Poor country's technology at the 1st period [y(1)'(x=4,5)]
0 1 2 3 4 5 6 7 8
1 2 3 4 5 6 7 8 9
Capital
Labour
Selection of technologies when endowment of production factors is different - 1st period - 1st-2nd periods
1st period's isoquant [y(1)]
Rich country's technology at the 1st period [y(1)'(x=3)]
Poor country's technology at the 1st period [y(1)'(x=4,5)]
2nd period's isoquant [y(1)]
Poor country's technology at the 2nd period [y(1)'(x=3)]
Rich country's technology at the 2nd period [y(1)'(x=2,5)]
Explanation:
m(2)R > M(1)R és m(2)P > M(1)P;
m(2)P/m(1)P > m(2)r/m(1)r
Figure 6 shows this process of upgrading over time.
The solid lines represent the technologies of later periods.
On the one hand, due to the increase in the overall efficiency of production factors, the isoquant of production shifts upwards; on the other hand, the accumulation of profit makes the lines representing technologies "steeper".
As a result of accumulation, the scarcity of capital will be reduced, which reduces the relative price of capital and starts the substitution of work by capital. The question is, to what extent.
Since the necessary condition of becoming "steeper" is faster accumulation, the upgrading process will lead to a reduction in the development gap if, in the less-developed countries, the accumulation is faster and more intense. The findings of Lin (2012) can be summarised as follows:
Empirical facts have proved the futility of development strategies that aim directly at upgrading the industrial technology structure.
So, to upgrade that structure and to ensure maximum efficiency, the cause – the factor endowment structure – must be changed.
Factor endowment refers to an economy’s relative abundance in capital, labour, land, and natural resources. The major difference comes from capital accumulation. So, upgrading the endowment structure means increasing the relative abundance of capital.
The key to upgrading the factor endowment structure of an economy is to increase each period’s surplus production and the proportion of surplus accumulated as capital. With more surplus, and with a bigger proportion of it accumulated as capital, upgrading the factor endowment structure is faster.
With a given surplus, the rate of capital accumulation also hinges on whether people are willing to accumulate.
Hindrances to this process must be reduced: burdens imposed by politics, rent seeking, corruption, etc.
This collection of statements will be further referred to as Lin’s theorem. As a matter of fact, this theorem is not new. The logic of Harrod-Domar models, as well as that of Solow's production function, is the same. In their view, the causes of differences in the development of nations are in accumulation: variances in time, size, and efficiency. For the time being, let us accept this claim. Later we shall return to it, because if we begin to examine what factors make the process of accumulation of individual nations different, then we have to consider other factors too, like knowledge capital (Roamer 1994), institutions (Acemoglu, Robinson 2012), historical developments, the distribution of income, the ecological environment (Stiglitz 2001, Sen 1999), etc. Now let us take a look at what the upgrading process looks like.
Before the statistical quantification of the upgrading process, we must examine the measurability of production
factors. Without that, we cannot examine the capital-to- labour ratios in their use. Unfortunately, the necessary data for other Central and Eastern European countries are not available. So we can analyse only the Hungarian upgrading process.
Every year since 2009, Corvinus University of Budapest has received from the Hungarian Tax Authority the full corporate tax database (with the items made anonymous). This database contains the balance sheet and profit and loss account of each important enterprise. This data is constantly monitored by the state, and therefore this is one of the most important and reliable sources of national accounts, even though it is not free of errors. From this data, one can derive the tangible assets (or total assets) of 450,000 Hungarian enterprises along with their average number of employees. Simple division gives the first approximation of the technical equipment of work, which is the tangible capital per employee.
The use of labour and capital has costs. These costs are reported in the lines of the profit and loss accounts and can be assigned either to capital or to labour. However, we soon run into difficulties if we would like to assign all costs reported in the balance sheet to either labour or capital, because there is an ever-increasing cost item, that of so- called “other inputs”, which has ever-increasing number of cost elements that cannot be assigned to any of the reported production factors. For instance, costs allocated for managing bad debts are in the category of customer relations, which belongs to neither tangible capital nor labour. It belongs to a new capital item: intangible capital.
The same is true for advertising expenses, or for non-wage expenditures dedicated to organisational development.
This raises the question of how much, in fact, is the capital and what does it consist of? Is it equal to the tangible capital reported in the balance sheet, or is it more than that?
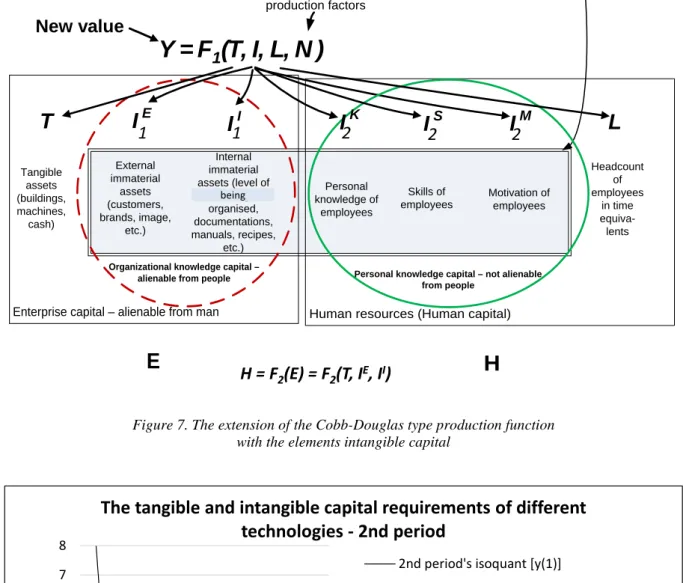
This question must be answered if we want to calculate the technical equipment of work. Among other things, these considerations lead to a Roamer-type production function (Figure 7), which expands the traditional Cobb Douglas production function by the intangible factors of production.
If we accept this production function, then the concept of capital expands. There will be both tangible and intangible capital. The company’s capital will be equal to the T + I1E + I1I part in the left box in Figure 7. In our study, this sum will be denoted by E. Remember that the I2 elements are not part of E. The I2 elements are part of the human capital, H, and will never belong to the company. They can only be leased by the company and are strictly connected to labour. In this case, however, besides the technological lines touching the isoquant, new technological lines will appear. More specifically, the area they cover will be divided into two parts, as shown in Figure 8. The area under the dashed line represents the tangible technical equipment of work, while the area between the dashed line and the solid line represents the intangible technical equipment of labour.
Figure 7. The extension of the Cobb-Douglas type production function with the elements intangible capital
Figure 8. The tangible and intangible technical equipment of labour Explanation:
mTR and mTP – Tangible technological equipment of rich and poor countries, respectively;
mIR and mIP – Intangible technological equipment of rich and poor countries;
As development proceeds, mIR will slowly increase and exceed mTR-t, and mIP also will gradually surpass mTP- t. This supposes that, during upgrading, the gap should be reduced not only in tangible technological equipment but also in intangible technological equipment.
Knowledge capital
Motivation of employees
I
MHuman resources (Human capital)
H
Personal knowledge capital – not alienable from people
Headcount of employees
in time equiva- lents
I
IL
Internal immaterial assets (level of
beeing organised, documentations, manuals, recipes,
etc.) Organizational knowledge capital –
alienable from people Tangible
assets (buildings, machines,
cash)
T I
EExternal immaterial
assets (customers, brands, image,
etc.)
I
SSkills of employees
I
KPersonal knowledge of
employees Not yet identified production factors
Enterprise capital – alienable from man
E H = F
2
(E) = F
2(T, I
E, I
I)
Y = F
1( T, I, L, N )
New value
Intangible capital
1 1 2 2 2
being
0 1 2 3 4 5 6 7 8
1 2 3 4 5 6 7 8 9
Capital
Labour
The tangible and intangible capital requirements of different technologies - 2nd period
2nd period's isoquant [y(1)]
Rich country's technology at the 2nd period [y(1)'(x=2,5)]
The tangible technological equipment in the technology of the rich contry [Ty(2)'(x=2,5)]
Poor country's technology at the 2nd period [y(1)'(x=3)]
The tangible technological equipment in the technology of the rich contry [Ty(2)'(x=3)]
At this point the definition of technical equipment must be more generally discussed. Since the concept of capital has been expanded, and since the interpretation of the volume of immaterial enterprise assets is somewhat unambiguous, from now on, we will interpret technical equipment of labour to be the ratio of total capital costs to total labour costs. Since the numerator can be divided into three elements, we differentiate tangible, intangible, and total technical equipment.
There is no production factor without its accompanying cost. The cost is equal to some sacrifice of the production factors. Therefore, the costs should be proportionate to the usage of the factors of production. The balance sheet does not measure the enterprise’s total capital because it does not contain intangible production factors. It does, however, report the total costs. If we assign all labour-related cost to labour, then the remaining costs are proportionate to E, the enterprise’s capital. So, from the costs assigned to enterprise capital, we can estimate the value of the enterprise’s capital.
Before the quantification, we simplify the production function of Figure 7:
Y = cTT + cLL + cII where
Y = Value added
T = Visible/tangible assets (simply the balance sheet total)
L = Number of employees
I = Immaterial (or knowledge) assets additionally invested by the enterprise: business development, customer retention, organizational efficiency, etc.
cT = unit cost of the usage of T, visible/tangible assets,
cL = unit cost of the usage of L, employees and their personal knowledge, skills, and motivation
cI = unit cost of the usage of I, immaterial and knowledge assets.
The equation relies on the following economic considerations:
A company can produce new value only by using its assets.
Beyond the visible/tangible assets and the employees involved in production, additional invisible, immaterial/intangible assets must be used. These include the following:
The personal knowledge of employees (IK), their skills (IS) and motivation (IM). These three make up the human assets (H) bound to L.
Further immaterial assets, such as client assets needed to acquire and retain customers and
suppliers (IE), and organisational assets in the form of know-how, knowledge base, and organisation (II). These assets increase the invested enterprise assets (E).
The use of assets requires costs (depreciation, wages, advertising, customer retention, business development, knowledge base and know-how development, training, etc.).
If the entrepreneur incorporates his profit expectations into his costs, then sustainable production has one precondition: the produced value added must cover the costs of the production factors.
In the equation Y = cTT + cLL + cII, only cI and I are unknown. If we estimate cI, then I can be calculated in the following way:
I = (Y - cTT - cLL)/cI = cII/cI
In our calculations, we assume that revenue expectations of the much riskier immaterial investments (increased by profit expectations) are twice as big as the revenue expectations of the visible/tangible investments (cI = 2cT). In this way, we can quantify the aggregate production functions of each enterprise group in the Hungarian economy. One part of these is presented in Table 1.
The production functions in Table 1 reveal much about the general operation of enterprises in Hungary. Thorough analysis could go far beyond the scope of this article.
However, in this study we focus on only one question:
What is the connection between efficiency and the technical equipment of labour?
Based on data in production functions (see the last column in Table 1), it is clear that “over-industrialisation”
has led to a dual economy in Hungary:
Half of the GDP is produced by foreign companies that are more efficient than the domestic private companies.
The value added per enterprise or the value added per employee in foreign companies is much higher than that of domestic companies.3
The same is true even if the companies are grouped according to size. Foreign companies are more effective than domestic enterprises in both the group of companies employing more than 20 people and the group employing fewer than 20.
The law of return to scale appears in that the efficiency of Hungarian enterprises employing more than 20 people is greater than that of those which employ fewer than 20.4
3 The per capita efficiency differences see in the F.2.1 appendix table.
4 This statement is not valid for foreign companies. In that enterprise group, the per capita added value of small businesses is greater than that of the large ones. This suggests that small businesses in this group are not real small businesses. Behind them stands a large parent.
Table 1
The production functions of enterprises submitting tax declarations
Source: Corporate tax database of the National Tax and Customs Authority. The “enterprises altogether” in row 1 contains state-owned enterprises as well.
The differences in the average use of capital and labour of Hungarian private and foreign enterprises are so large that Hungarian figures are barely visible in a common coordinate system. Therefore the relevant part of Figure 9 has been magnified. The relations can, however, be easily seen from the gradients.
In the most effective foreign-owned companies, the technical equipment of labour is higher (their line is steeper, with a gradient of 1.4). In the Hungarian
private companies, the technical equipment of work is smaller (their line is less steep, with a gradient of 0.72).
The ratio of intangible technical equipment to the tangible technical equipment of labour is better in the foreign enterprises. In foreign companies, -m(T+I)/- mT = 1.4 / 0.68 = 2.06. In Hungarian domestic companies, -m(T+I)/-mT = 0.72/0.37 = 1.95).
So we have shown that there is a close relationship between efficiency and the technical equipment of work.
Figure 9. Technical equipment of the observed enterprise groups in 2009 0
50 100 150 200 250
CT or CT+CI
CL
Average enterprise - Enterprisees altogether - Mill. FT. - 2009
Foreign enterprises (-mT = 0,68)
Foreign enterprises (- m(T+I) = 1,4) Hungarian private enterprises (-mT = 0,37) Hungarian private enterprises (-m(T+I) = 0,72)
0 1 2 3 4 5 6 7 8 9 10
0 5 10 15
t N cT T cL L cI I Y cT 1000*T/N cL 1000*L/N cI 1000*I/N 1000*Y/N
Year Number
of enterpris
es Cost of usage of tangible assets
Tangible assets
Cost of usage of
labour Labour Cost of usage of customer organizatand
ional assets
Custome r and organizat
ional assets
Added value
Cost of usage of tangible assets
Tangible assets
per company
(HUF Mill./ent erprise)
Cost of usage of labour
Labour force per enterpris (person/e enterpris e)
Cost of usage of customer organizatand ional assets
Custome r and organisat
ional assets
per company
(HUF Mill./ent
erprise) Added value per enterpris e (HUF Mill./ent erprise)
Year Piece HUF/HUF HUF Bn. Mill HUF / person Thousan
d
persons HUF/HUF HUF Bn. HUF Bn. HUF/HUFMill.HUF/
enterpris e
Mill HUF
/ person Person HUF/HUF Mill.HUF/
enterpris e
Mill.HUF/
enterpris e 1 Enterprisees altogether
2 Enterprisees altogether 2009 385 723 0,03 155 464 4,2 2 339 0,06 80 718 19 828 0,03 403 4,2 6 0,06 209 51
3 2014 422 760 0,03 161 284 5,2 2 313 0,05 126 160 23 547 0,03 382 5,2 5 0,05 298 56
4 Foreign enterprises 2009 27 400 0,03 101 587 7,4 624 0,06 54 118 10 980 0,03 3 708 7,4 23 0,06 1 975 401
5 2014 24 208 0,02 98 656 8,6 602 0,05 84 767 11 379 0,02 4 075 8,6 25 0,05 3 502 470
6 Hungarian private enterprises 2009 355 482 0,03 46 836 3,0 1 484 0,07 23 172 7 519 0,03 132 3,0 4 0,07 65 21
7 2014 395 654 0,05 50 019 3,9 1 495 0,08 31 412 10 508 0,05 126 3,9 4 0,08 79 27
8 Enterprises with more than 20 employees
9 Enterprisees altogether 2009 13 807 0,04 83 861 5,1 1 516 0,09 46 449 15 461 0,04 6 074 5,1 110 0,09 3 364 1 120
10 2014 13 686 0,04 94 191 6,2 1 482 0,07 75 036 18 345 0,04 6 882 6,2 108 0,07 5 483 1 340
11 Foreign enterprises 2009 2 824 0,05 52 696 7,3 569 0,10 29 947 9 553 0,05 18 660 7,3 201 0,10 10 604 3 383
12 2014 2 630 0,04 54 040 8,5 554 0,07 47 485 10 010 0,04 20 548 8,5 210 0,07 18 055 3 806
13 Hungarian private enterprises 2009 10 235 0,04 24 458 3,7 725 0,08 13 186 4 625 0,04 2 390 3,7 71 0,08 1 288 452
14 2014 10 307 0,06 28 114 4,9 721 0,09 17 854 6 726 0,06 2 728 4,9 70 0,09 1 732 653
15 Enterprises with less than 20 employees
16 Enterprisees altogether 2009 371 916 0,02 71 602 2,6 823 0,03 34 269 4 367 0,02 193 2,6 2 0,03 92 12
17 2014 409 074 0,02 67 093 3,3 831 0,03 51 124 5 201 0,02 164 3,3 2 0,03 125 13
18 Foreign enterprises 2009 24 576 0,01 48 891 8,1 55 0,02 24 171 1 427 0,01 1 989 8,1 2 0,02 984 58
19 2014 21 578 0,01 44 615 8,8 49 0,02 37 282 1 369 0,01 2 068 8,8 2 0,02 1 728 63
20 Hungarian private enterprises 2009 345 247 0,03 22 378 2,2 759 0,06 9 986 2 894 0,03 65 2,2 2 0,06 29 8
21 2014 385 347 0,03 21 905 2,9 774 0,06 13 558 3 782 0,03 57 2,9 2 0,06 35 10
Figure 10. Technical equipment of enterprises employing more than 20 persons, and then fewer than 20 In foreign companies, whether large or small, the work
is technically more equipped than in Hungarian companies (Figure 10). However, domestic private enterprises have the same technical equipment of labour, independent of size.
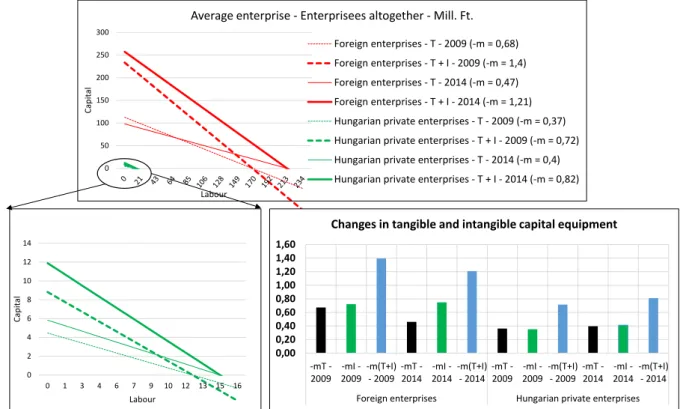
It is very important to note how these differences have changed over time, i.e., whether there was upgrading or not. This is presented in Figure 11.
Figure 11. Change in the technical equipment of observed enterprises between 2009 and 2014 Figure 11 is technically difficult to understand because
of differences in magnitude. For this reason, a separate part of the figure—the lines of Hungarian domestic companies—had to be magnified. A few words about the markings: The solid lines show the values of the year 2014, while the dashed lines indicate the 2009 values. The thicker lines represent the E values, the thinner ones the T values. Red lines indicate the values of foreign companies, while the green ones belong to the Hungarian domestic companies. To help the processing of the figures, the
quotients are given in a separate table which briefly summarises the upgrading process.
For our chain of thought it is important to note that, after the crisis, the foreign companies upgraded only their intangible capital (in the form of maintaining their customer base and their organisation.) Their amortisation decreased by 10 percent, and their investment services activities halved. This suggests that, even if they have difficulties at home, they at least take care of maintenance in the assembler countries.
0 50 100 150 200 250 300
Capital
Labour
Average enterprise - Enterprisees altogether - Mill. Ft.
Foreign enterprises - T - 2009 (-m = 0,68) Foreign enterprises - T + I - 2009 (-m = 1,4) Foreign enterprises - T - 2014 (-m = 0,47) Foreign enterprises - T + I - 2014 (-m = 1,21) Hungarian private enterprises - T - 2009 (-m = 0,37) Hungarian private enterprises - T + I - 2009 (-m = 0,72) Hungarian private enterprises - T - 2014 (-m = 0,4) Hungarian private enterprises - T + I - 2014 (-m = 0,82)
0,000,20 0,400,60 0,801,00 1,201,40 1,60
-mT - 2009 -mI -
2009-m(T+I) - 2009 -mT -
2014 -mI - 2014-m(T+I)
- 2014 -mT - 2009 -mI -
2009-m(T+I) - 2009 -mT -
2014 -mI - 2014-m(T+I)
- 2014 Foreign enterprises Hungarian private enterprises
Changes in tangible and intangible capital equipment
0 2 4 6 8 10 12 14
0 1 3 4 6 7 9 10 12 13 15 16
Capital
Labour 0
500 1 000 1 500 2 000 2 500
CT or CT+CI
CL
Average enterprise - Enterprises with more than 20 employees - Mill. Ft. - 2009
Foreign enterprises (-mT = 0,62)
Foreign enterprises (-m(T+I) = 1,31; - m(T+I)/-mT = 2,14) Hungarian private enterprises (-mT = 0,35)
Hungarian private enterprises (-m(T+I) = 0,72; -m (T+I)/-mT =
2,06) 0
5 10 15 20 25 30 35 40 45
CT or CT+CI
CL
Average enterprise - Enterprises with less than 20 employees - Mill. Ft. - 2009
Foreign enterprises (-mT = 1,23)
Foreign enterprises (-m(T+I) = 2,2; - m(T+I)/mT = 1,79) Hungarian private enterprises (-mT = 0,39)
Hungarian private enterprises (-m(T+I) = 0,72; - m(T+I)/-mT = 1,85)
It is essential to notice that among Hungarian companies only the bigger firms – employing more than 20 people - could successfully upgrade. The favourable technical equipment of work in smaller enterprises has deteriorated compared to that of bigger ones.5
Overall, the Lin theorem partially works:
1. The technical equipment of work in the more efficient companies is bigger.
2. Also, the intangible technical equipment is bigger in the more efficient companies.
3. Hungarian domestic companies compete by utilizing the comparative advantages of a cheaper labour force.
So they struggle with the higher capital potential of multinational companies.
4. Analysing the changes over time, we can say that, after the crisis, the foreign enterprises did not make developments at the former pace. In general, they sat on the fence.
5. The Hungarian domestic companies developed cautiously.
6. Points 1-5 describe a situation in Hungary which can be considered as only a temporary upgrading compared to the foreign enterprises, because it will immediately vanish when the developed countries finish their renewal and begin to transfer their outsourced technologies into the assembler countries.
7. This indicates that the assembler countries represent an additional reservoir next to the great pot of developed countries. If the soup overflows the big pot, then it will fall into the neighbouring little pots. There is no policy which coordinates the total amount of soup distributed among the pots.
Regarding the computations, we should call attention to several cautionary aspects:
1. Measurements at current prices reflect the upgrading process in a peculiar way.
a. The increase in labour costs was accompanied only by minor growth in employment.
b. Inflation is included in the cost increments and must be accounted for.
c. In fact, the upgrading was small or stagnant. This is particularly important in the case of foreign companies, whose “degrading” is not actual, but only relative. They have maintained their earlier investments, and have made no intentional changes in their technical equipment of labour. They have increased wages to keep their positions in the labour market. We still have a lot to do before we can make a final evaluation of the upgrading process in Hungary.
2. The Central Statistical Office of Hungary significantly corrects the corporate tax declaration data at a higher level of aggregation. These corrections should be derived at the enterprise level if we would like the enterprise database to be more reliable. This requires further data processing. However, the Murai study and the GNI report (KSH 2009) of the Hungarian CSO6 indicate that the above computations give a reliable picture of the production functions of the Hungarian economy since this database is one of the most important sources used by CSO to compile national accounts.
S TRATEGIC D ILEMMAS
The realisation of comparative advantages so far discussed, however, raises a series of questions. Let us go back once again to Ricardo. It is not a coincidence that Ricardo, when investigating the law of comparative advantages, used an example of two countries, each of which had advantageous conditions for producing its own distinct product, and the two countries could exchange these products. He does not speak about a case where two countries produce the same product, with one having a comparative advantage over the other in production of that product. Wine and textiles may make their respective producing countries rich, and the corresponding comparative advantages will persist even if the two countries get to the same level of development. But the labour market does not work that way. If development levels equalise, the comparative advantage of labour disappears; it lasts only as long as development levels remain different. It follows that, if we want to reduce the differences in development, we need to find a product different from labour whose comparative advantages do not decrease as the development gap narrows.
Such a product does not appear overnight, just as textiles and wine do not magically turn up on our doorsteps. This problem requires strategic thinking, actions and projects according to a plan, and a processes of trial and error.
First of all, the Lin theorem must be extended.
Upgrading is not satisfactory if it only takes up the assembling technology and outsourced production of the more developed countries. Finding the future carrier product should not start when the follower catches up to the frontrunner, but far earlier. Nokia and Samsung were not created after Finland and Korea significantly increased the GDP per capita; on the contrary, their creation caused the increase. The upgrading is not fully achieved simply by increasing the technical equipment of labour. We must
5 See Table F.1 in the Appendix.
also renew the product portfolio with innovative, future carrier products. The development of China and South Korea show different examples. China rewards manufacturers when they upgrade, whether or not they export. In South Korea manufacturers get support only if the resulting product is exported. The latter is the really good example to follow.
This exportation of carrier products is the only way to escape the trap of relative wage and knowledge decrease.
It leads to productivity growth in certain areas (i.e. those related to the new carrier products) and creates the conditions for wage increases. Of course it will drain manpower from elsewhere, and this induces wage increases in the traditional areas as well. This will diminish the low-wage-based comparative advantages in the general economy, which results in a loss of competitiveness and expels from the market producers who are unable to change. But it does not matter. The advances made in the competitive areas will compensate for it.
If we continue the overdevelopment of industry with assembly content and thus hinder the development of non- material services, then we will only decrease the innovative capacity of the country, and then we shall get deeper into the trap that Soskice, Nölke and Vligenhart call the DME model.7 According to their classifications, they differentiate three types of capitalism relating to Central and Eastern European countries:
LME = Liberal Market Economy (USA, UK)
CME = Corporate Market Economy (Germany, Austria)
DME = Dependent Market Economy (Visegrad countries)
P OLICY I MPLICATIONS
Hungary is now firmly in the DME category.
According to Nölke and Vliegenhart, the dependency appears in the following areas:
1. Dependence on the most important investment resource
The decisions defining economic growth are not made in DME countries. They are made in those headquarters where the FDI is coming from: Western Europe and the USA.
2. Pressure to follow the operation model of the biggest investors
The most important corporate decisions are made not by local managers and shareholders, but by the local managers and the western corporate centres. This significantly affects the domestically owned small and medium-sized companies, because they are basically dependent.
3. Effect on the cooperation of social partners
A typical phenomenon is the system of enterprise-level agreements that is widespread in Central and Eastern
Europe, while in Western Europe the majority of agreements are made at the sectoral and national level.
In Central and Eastern Europe, the system of social expenditures is not the result of unfolding social struggles involving the masses, but it is evolving rather on a selective basis through the appeasement of employees of multinational companies.
4. Effect on education and training systems
The transnational companies require a relatively cheap labour force with intermediate-level technical skills because it yields the comparative advantage of the DME system. For this reason, it is not in the interests of the transnational corporations to invest in the potential for innovation, because they would prefer to bring their own innovation in from abroad. In addition, limited local innovation does not require an education system that provides general abilities based on significant R&D expenditures. Multinationals also do not require flexible labour markets like those in their home countries. It is sufficient for them to have a moderately flexible workforce, as this avoids major labour movements and prevents disturbances in the assembly plants’ operations.
The decline in educational investment, to which the governments are forced for a number of reasons, does not foster or maintain a strong public education system that could (if enabled) augment the limited vocational training with an Anglo-Saxon type high standard education that provides a high general knowledge level. This decline erodes the comparative advantages themselves. While Hungarian enterprises are worried about these processes and demand to reverse them, the Western enterprise centres are not very interested in these trends, because they can move their production elsewhere at any time if the local skill levels degrade too much.
5. Effect on innovation processes
Transnational enterprises concentrate their innovation- intensive activities at headquarters, which they then disseminate within their own enterprise systems. To the DME countries they delegate the role of assembler—based on the innovations developed at home. All this creates possibilities to utilise just a special type of comparative advantage.
We cannot say that there is no innovation in Central and Eastern Europe, or that the region produces only outdated products. On the contrary! The comparative advantage of the region is based precisely on their ability to adapt quickly to new trends in the production of durable quality goods. Still, most of the new trends come into the region from outside. The number of innovations developed in Central and Eastern Europe is small, and they appear mostly among supplier companies of the biggest multinationals.
7 See Nölke and Vliegnhardt (2009).
6. Effect on society as a whole
While the DME model is very coherent and has proven very successful in certain sectors, it has clearly failed in raising the standard of living of the general population. Instead, we can observe a growing dualism in these societies, with widening income disparities between those who are part of the export-oriented sectors and those who are excluded, plus others who have to bear the financial burdens of incentives offered abundantly by governments who continually try to attract foreign investments. This uneven development has led to increasing political populism and social tensions in Central and Eastern Europe.
The points mentioned above were written in 2009 and unfortunately have proved to be prophetic. Given this situation, the following potential policy options emerge:
1) Complete adaptation to the addiction
a. This course of action is very dangerous. It would not solve the problems of these societies, because that is not the intent of the power centres who have created the addiction (the LMD-CME countries). It would split these societies into “haves” and “have- nots.” Those who are left behind—while generating substantial costs of deviation—will not be able to participate effectively in building up the country.
b. In case of crises, social problems would immediately rise to the surface, since at such times the LMD-CME countries concentrate their resources at home to solve their own problems.
This is easily seen in the analysis above. During the crisis of 2008, foreign companies had only a limited upgrading.
c. There is a danger that the whole region might be devalued if better investment opportunities appear elsewhere.
d. It surrenders self-determination.
2) Getting rid of the addiction
a. This would be ridiculously expensive.
b. It would trigger the resistance of the LME-DME countries.
c. It delivers us into the hands of less progressive countries.
3) Integration into the array of core countries by utilising the comparative advantages of the dependency (the Irish example).
a. This is the only reasonable alternative.
b. It would require the allocation of additional social investments which would have only domestic sources of support.
Those who want change must create the material conditions for that change. The difficulty is that
already the people have frequently been asked to make sacrifices, and these have been wasted or misused; therefore, such efforts stir up deep mistrust of the authorities. But the problem must be solved. If there is no change, there cannot be improvement.
The opportunities that might yield quickly visible results lie in the way of “low hanging fruit.”
Unfortunately, there are relatively few such options. Traditional methods of raising sufficient revenue take a long time, and they usually gain popular support only when social tensions are already dangerously strained.
Renewal relies only on national productive forces.
I deliberately avoid using the word domestic, since a major part of “domestic” production forces are owned by foreigners.
The real latent resource of the Hungarian economy could be found in a “reconcentration” program that would strengthen small and medium-sized enterprises.8 This would bring quick and visible social impacts in both income and employment, and it could also gain social support.
The production calculations of this study indicate that greater efficiency can be expected only if there is a greater ability to accumulate national capital.
To strengthen small and medium enterprises, it is necessary to maximize the ability of the middle classes to accumulate.
This is possible only on a meritocratic basis. At present, the relevant social doubts are significant and justified.
c. The process should be supported by state intervention to provide productive work to those who lag behind but are still able to work.
d. We have to gain the support of LME and CME countries, since our integration of this kind is also in their long-term interests.
C ONCLUSION
To summarise, the priorities to be followed in all three cases listed above, are the following:
a. There should be investment in education by optimising the distribution of general, vocational, secondary, and higher education in order to maximally develop our ability to innovate.
8 This is a complex process that is described in a separate study. See the author’s conference paper written for the AIB-CEE Conference in Warsaw