Transition to a market economy: A retrospective comparison of China with countries of the former
Soviet block
MAREK DABROWSKI
1,2,3p1Non-Resident Fellow at Bruegel, Brussels, Belgium
2Higher School of Economics, Moscow, Russia
3Center for Social and Economic Research, Warsaw, Poland
© 2020 Akademiai Kiado, Budapest
ABSTRACT
In the 1990s and early 2000s, comparison of transition strategies of China versus those in Central and Eastern Europe raised controversies in the economic and political science literature. However, differences between China and the countries of the former Soviet bloc in their transition strategies resulted not necessarily from a deliberate political choice but from different initial conditions. Low-income and largely rural China, after its first radical step (de-collectivisation of agriculture in 1978), could move more gradually due to its under- industrialisation and retaining administrative control over the economy. The over-industrialised Central and Eastern Europe (CEE) and former Soviet Union (FSU) countries where the previous command system of economic management spontaneously collapsed at the end of 1980s, did not have such an option. They had to conduct market-oriented reforms as quickly as they could, with all the associated economic and social pain.
Regardless of speed and strategy of transition, almost all previously centrally-planned economies, including China, completed building basic foundations of a market system by the early 2000s although the quality of economic and political institutions and policies differ between the sub-regional groups and individual countries.
KEYWORDS
post-communist transition, initial conditions, industrialisation, public sector, economic freedom, political freedom, democracy, business climate, political economy
JEL CLASSIFICATION INDICES
D72, E62, H50, H51, H52, H53, H63, P24, P26, P51, P52
pE-mail: marek.dabrowski@case-research.eu
1. INTRODUCTION
More than 40 years have passed since China started its economic reforms (in 1978), which eventually led to building a largely market economic system. At the same time, 30 years have passed since the beginning of the post-communist transition in Central and Eastern Europe (CEE) (in 1989–1991) and former Soviet Union (FSU) (1991–1992). In the 1990s and early 2000s, the comparison of both transition experiences was a popular topic in economic literature and often the subject of hot controversy.1
One of the reasons of this controversy concerned different growth performance. China recorded rapid catching-up growth while the CEE and FSU countries experienced a deep output decline lasting from few years to almost a decade. Advocates of following a Chinese experience by the CEE and FSU countries usually attributed these different growth trajectories to the supposedgradualismof the Chinese reforms as opposed to the supposed shock therapyof the CEE and FSU reforms. Actually, neither the Chinese reforms were so gradual, nor the reforms in many CEE and FSU countries were so rapid and radical. That is, there were other reasons of different growth performance than speed of transition, for example, different initial conditions.
The purpose of this paper is conducting a retrospective comparison of the Chinese and CEE– FSU transition to a market economy and actual comparison of their economic and political systems. There are number of good reasons of doing so.
First, in 2020, one knows more about the economic transition experience of both China and CEE–FSU than 20 or 25 years earlier. Transition to a market system can be considered as a finished story in both cases–all former communist economies in Asia and Europe, except North Korea and perhaps Turkmenistan can be considered as predominantly privately owned and coordinated by market forces. They do not differ in this respect from other economies repre- senting similar development levels. On the other hand, all or almost all of them continue to have substantial non-market components and various economic distortions. Again, these are also the characteristics shared by many other economies, not only those with communist past.
Second, the trade tensions between China and the United States (US) under President Donald Trump’s administration and, to a lesser degree, between China and the European Union (EU) have put more attention to non-market components and economic distortions in the Chinese economy, the characteristics which were largely ignored by policymakers and re- searchers before. Detection of these distortions and understanding their systemic roots are important not only for academic knowledge but also for practical policymaking.
Third, to overcome existing distortions and systemic flaws both China and the CEE–FSU countries need a continuation of economic reforms. A comparative analysis of the existing systems can be helpful in elaborating their agenda.
Fourth, on the political front, the early democratisation gains in CEE and substantial part of FSU have been partly reversed in 2000s and 2010s. As a result, the current political systems in several FSU countries, including Russia, do not differ so much from China, as they did in the 1990s. This is another argument in favour of comparison–to try tofigure out whether political authoritarianism has a negative impact on the functioning of market mechanism and economic performance and in which spheres such an impact is particularly strong.
1See e.g.Stiglitz (1999a,1999b),Dabrowski et al. (2001).
This set of arguments suggests that revisiting the old controversies is not necessarily the priority of our analysis. Nevertheless, they will be referred to in the historical part of the analysis (Sections 2 and 3) where explaining the differences in initial conditions is important for un- derstanding different transition trajectories.
The paper is structured as follows. Section 2 discusses differences in initial conditions of economic reforms in China in 1978, and in CEE–FSU at the end of 1980s/early 1990s. Section 3 analyses differences in transition strategies. Section 4 presents a comparative analysis of contemporary economic systems in CEE–FSU and China, according to various available metrics.
Section 5 compares political systems and addresses the question to which extent political system impacts the economic one. Section 6 presents conclusions of our analysis.
While a few other communist countries in Asia (Vietnam, Laos, and Cambodia) have fol- lowed, to various degrees, Chinese way of economic reforms, they will not be included into our analysis, for the sake of its simplicity.
2. INITIAL CONDITIONS
The trigger of economic reforms in both China and CEE–FSU was the same: dysfunctionality of the command economic system based on central planning, which led to a deep economic and political crisis.
When Deng Xiaoping launched economic reforms in 1978, China was economically and politically devastated by the years of the Cultural Revolution and earlier Maoist policies such as collectivisation of agriculture in 1950s and forceful Stalinist-style industrialisation (‘The Great Leap Forward’of 1958–1959).
Economic and political transition in CEE and FSU, which started in 1989, was also caused by a deep crisis of centrally planned economies (CPEs), which had reached limit of their growth in 1980s. This crisis led to the collapse of the political monopoly of communist parties and collapse of the Soviet Union.
However, similarity between China and CEE–FSU ends here. Initial conditions of Chinese reforms were very different than those in CEE–FSU (Sachs–Woo 1997).
2.1. Level of economic development
At the end of 1970s, China was a low-income, largely agrarian and rural economy while most CEE countries and Soviet Union at the end of 1980s belonged to a middle-income group and, unlike China, were heavily industrialised or even over-industrialised (Blanchard 1997).Table 1 shows differences in income per capita levels.
At the starting point of market transition (1988–1992), CEE/FSU had GNI per capita level (calculated according to the Atlas method) 6–18 times higher than China in 1978. In 1990, after more than a decade of its reforms Chinese GNI per capita was still 4–12 times lower as compared to that in CEE and Soviet Union.
2.2. Structural characteristics
Apart from the differences in development level, there were also substantial differences in economic structure. In both 1978 and 1990, agriculture, forestry and fishery contributed more
than a quarter of Chinese Gross Domestic Product (GDP) (Table 1). In Czechoslovakia, Hungary and Poland this share amounted between 4 and 8% of GDP, in Bulgaria–11.5%, in Russia–13.8%, all at the beginning of the transition. Only Romania and Ukraine represented higher shares –19.0 and 22.3% respectively (but still smaller than that of China). That is, the share of industry and services in GDP was higher in CEE and FSU as compared to China.
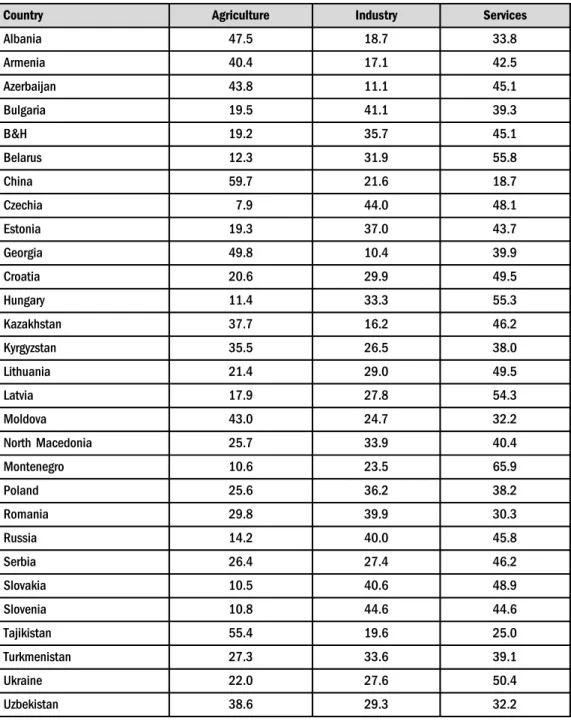
The available data on employment structure (Table 2) confirms difference in structural characteristics. In 1991, that is, 13 years after starting economic reforms in China (there is no earlier data), almost 60% of its labour force remained employed in agriculture as compared to 7.9% in Czechia, 10.5% in Slovakia, 10.6% in Montenegro, 10.8% in Slovenia, 11.4% in Hungary, 12.3% in Belarus and 14.2% in Russia. True, several former Soviet republics recorded high shares of agriculture employment, especially Tajikistan (55.4%), Georgia (49.8%), Moldova (43%), Azerbaijan (43.8%), Armenia (40.4%), Uzbekistan (38.6%), Kazakhstan (37.7%) and Kyrgyzstan (35%), but still lower than China. Furthermore, it is worth to notice that their weight in the entire Soviet economy was not dominant and, according to the division of labour inside the centrally planned network, their role was to supply more industrialised republics with food and agriculture raw materials. In CEE, Albania that tried to copy in the 1960s and 1970s the Maoist economic and political model also represented a high share of agricultural employment.
Looking at the shares of industrial employment in 1991 (Table 2), Chinesefigure of 21.6%
was lower than those of most other former communist economies, in particular, Slovenia (44.6%), Czechia (44.0%), Bulgaria (41.1%), Slovakia (40.6%), Russia (40.0%) and Romania (39.9%). On the other hand, a few ‘agrarian’economies of the FSU/CEE (Georgia, Azerbaijan, Kazakhstan, Albania, Armenia and Tajikistan) recorded shares of industrial employment smaller than China.
Table 1. GNI per capita at starting point of reforms, Atlas method (current US$) and the share of agriculture, forestry andfishing (% of GDP)
Country (year) GNI per capita Atlas method current (US$)
Agriculture, forestry and fishing (% of GDP)
China (1978) 200 27.7
China (1990) 330 26.6
Bulgaria (1988) 3,110 11.5
Czechia (1992) 3,340 4.2a
Hungary (1993) 3,660 7.2b
Poland (1992) 2,090 5.5b
Romania (1992) 1,250 19.0
Russia (1991) 3,440 13.8
Ukraine (1989) 1,620 22.3
Source: World Bank’s World Development Indicators (WDI) database, accessed on April 2, 2020.
Notes:a1993,b1995.
Table 2.Structure of employment (modelled ILO estimate), percentage of total employment, 1991
Country Agriculture Industry Services
Albania 47.5 18.7 33.8
Armenia 40.4 17.1 42.5
Azerbaijan 43.8 11.1 45.1
Bulgaria 19.5 41.1 39.3
B&H 19.2 35.7 45.1
Belarus 12.3 31.9 55.8
China 59.7 21.6 18.7
Czechia 7.9 44.0 48.1
Estonia 19.3 37.0 43.7
Georgia 49.8 10.4 39.9
Croatia 20.6 29.9 49.5
Hungary 11.4 33.3 55.3
Kazakhstan 37.7 16.2 46.2
Kyrgyzstan 35.5 26.5 38.0
Lithuania 21.4 29.0 49.5
Latvia 17.9 27.8 54.3
Moldova 43.0 24.7 32.2
North Macedonia 25.7 33.9 40.4
Montenegro 10.6 23.5 65.9
Poland 25.6 36.2 38.2
Romania 29.8 39.9 30.3
Russia 14.2 40.0 45.8
Serbia 26.4 27.4 46.2
Slovakia 10.5 40.6 48.9
Slovenia 10.8 44.6 44.6
Tajikistan 55.4 19.6 25.0
Turkmenistan 27.3 33.6 39.1
Ukraine 22.0 27.6 50.4
Uzbekistan 38.6 29.3 32.2
Source: World Bank’s WDI database, accessed on April 2, 2020.
In the service sector, China was an evident outsider: its share in total employment amounted to 18.7% in 1991, far less than in other former communist countries. However, the FSU/CEE also had underdeveloped service sector, especially in the market-oriented services, in compar- ison with market economies representing a similar level of development.2
Differences in sectoral shares in total employment corresponded with various degrees of urbanisation measured as the share of urban population in total population. In 1991, it amounted to 18% in China, 74% in Russia, 61% in CEE and 58% in FSU, except Russia but including Mongolia (World Bank 1996, Table 1:2).
Lack of internationally comparable data does not allow us to look into the internal structure of industry. However, the indirect evidence suggests that heavy, especially military industry was less developed in China than in the Soviet Union and a few other CEE countries.Table 3shows that in 1989 China spent 2.5% of GDP for military purposes while Romania spent 4.8% of GDP and Bulgaria – 4.4% of GDP. Unfortunately, Table 3 based on the World Bank’s World Development Indicators database does not include military spending of the Soviet Union, one of the two largest military superpowers of that era. However, according to Cooper (1998), they were equal to 16.6% of the Soviet Gross National Product (GNP) in 1987. Even if thisfigure may not be fully comparable withTable 3data (due to different denominator), it does not leave any doubt that the Soviet Union spent several times more on military purposes (in relation to GDP) than China did and this indirectly reflected a much bigger share of military industry in the Soviet GDP.
Energy intensity is another measure which shows different scale of distortions inherited from the command economy. In 1980, China used 0.38 kg of oil equivalent per 1$ of GDP, in 1992 purchasing power parity (PPP) calculation. The same indicator amounted to 0.81 kg in the CEE in 1990, 0.91 kg in Russia in 1992 and 0.71–in the remaining part of FSU and Mongolia in 1992 (World Bank 1996, Table 1:2).
All the above historical statistics confirm that the level of industrialisation in CEE/FSU was higher than in China in the 1970s–1980s, with the evident dominance of heavy and energy–
intensive industries. China continued to remain a rural economy with major role of agriculture Table 3. Military expenditure, % of GDP, 1989
Country 1989
Bulgaria 4.4
China 2.5
Hungary 2.8
Poland 1.8
Romania 4.8
Source: World Bank’s WDI, accessed on April 2, 2020.
2According toBlanchard (1997:4),‘by the standards of market economies, centrally planned economies had too large a manufacturing sector, too small a service sector.’
at that time. Due to its historic origin (forceful industrialisation in the command system and closure to an external competition), state owned manufacturing industries were non-competitive internationally in both cases. However, its share in the Chinese economy was much smaller than in most of the FSU and CEE. Therefore, China could afford to maintain, to a certain degree, its further existence while generating economic growth in the new sectors and enterprises (the size of the distortions created by a command economic system was smaller).
A huge amount of labour hoarded in the agriculture sector in China meant a potential labour surplus, which could be and was easily employed once opportunity to create collective, semi- private and private industrial and service enterprises under Deng’s reform became available.
Contrary to China, most of the CEE and FSU economies (with the exception of the former Yugoslavia) experienced labour shortage due to perverse microeconomic incentives created by the command economic mechanism (the so-called shortage economy according to Kornai (1980)). That is, returning to economic growth required substantial restructuring and reallo- cation of available resources, including labour (removing inherited distortions) what took time and involved a temporary (corrective) output decline.
Distortions produced by a CPE affected not only industry but also agriculture that was organised in collective and state-owned farms in the Soviet Union, most of the CEE (apart from Poland and Yugoslavia) and China. However, the Chinese history of agriculture collectivisation was shorter (ca. 20 years) as compared to CEE and Soviet Union; therefore, return to private use of land was easier. Furthermore, Chinese agriculture was less‘industrialised’ that meant less structural distortions.
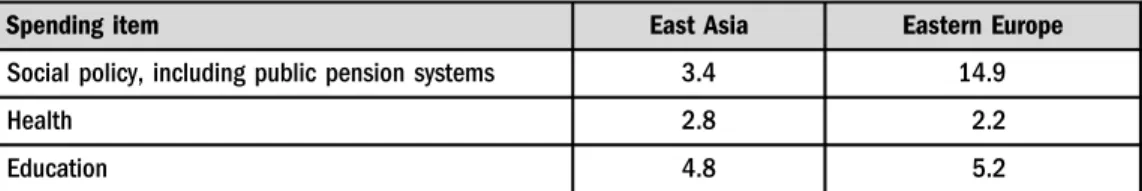
2.3. Social policy and social services
Another difference at the start of economic reforms concerned the relative size of public expenditure for social policy and social services such as education and health (Table 4). In China, publiclyfinanced pension and healthcare systems and other social policy instruments only covered employees of public sector and large state-owned enterprises (SOEs) and their families (ca. 20–30% of the entire population). The remaining part of population had to rely on their own resources, which may explain a very high rate of saving in the Chinese economy (see Section 4).
While historically, the Soviet Union had also started from the very ‘austere’ social model somewhat similar to the Chinese one; it began to change after Stalin’s death in 1953 and abandoned mass terror. The Communist regimes in the Soviet Union and CEE had to look for
Table 4.Social policy and social services spending in developing countries of East Asia and Eastern Europe, averages for 1985–1990, % of GDP
Spending item East Asia Eastern Europe
Social policy, including public pension systems 3.4 14.9
Health 2.8 2.2
Education 4.8 5.2
Source:Sachs (1997, Table 9.2, p. 253).
some sort of social legitimacy and less coercive method of control over societies. This was especially important against repeated incidents of massive unrests and other forms of anti- communist resistance (most of them on a socio-economic ground), for example, in the East Germany in 1953, in Hungary and Poland in 1956, in Soviet Union in 1961, in Czechoslovakia in 1967–1968, and in Poland in 1970 and 1980–1981. New social programs and entitlements as well as an improved provision of basic social services were the main instruments to appease society. This process intensified in 1980s when the ruling communist parties gradually lost their political ground and led to building oversized and, therefore, unsustainable social commitments.
The share of social expenditure in GDP, including that related to public pension systems, reached in many instances, especially in Central Europe and former Yugoslavia, the level close to that in Western Europe, despite huge income per capita gap between both the regions (Sachs 1997;Kornai 1999), even if the concrete instruments of social safety net were different.
Given serious macroeconomic imbalances, which almost the entire CEE and FSU suffered from, a painful adjustment on the social policy front was unavoidable. China, where spending on social policy and social services was much smaller in relation to GDP (as seen inTable 4), did not face this policy dilemma.
2.4. Political environment of economic reforms
The third important difference concerned political environment and administrative capacity. As mentioned in Subsection 2.3, at the late stage of communism governments in CEE/FSU were already politically weak and, therefore, increasingly unable and unwilling to use coercive power on a massive scale. This also concerned a command economic system: discipline of central planning went gradually down. Eventually, it totally collapsed after the demise of political monopoly of the communist parties. Thus, continuation of selective elements of the old eco- nomic system (to introduce market mechanism in a gradual way) was not the option.
Political situation in China was different. Despite political turmoil in the period of Cultural Revolution, the Communist Party of China (CPC) continued to hold the monopoly of political power and centralised control over the entire country.
Demand for democratisation and political freedom was weaker in China as compared to the CEE and European part of the FSU. However, when spontaneous democratisation movement had challenged political monopoly of the CPC it was brutally defeated in the Tiananmen Square massacre in Beijing in June 1989. Therefore, politically and administratively the CPC leadership and central government continued to control economic life and was able to fine-tune gradual reforms without a risk of creating a systemic vacuum.
The key question, which one may ask is why the CPC was able to initiate market-oriented reforms in 1978 (and then sustain them) while the Communist Party of the Soviet Union (CPSU) and its CEE satellites failed to enter this path despite multiple attempts of economic reforms undertaken since mid-1950s.3Putting in other words, why Mikhail Gorbachev and his predecessors could not follow the experience of Deng Xiaoping?
3In the 1980s and early 1990s, this experience led many scholars in CEE and Soviet Union (some of them becoming future reformers) to a conviction that genuine market reforms are impossible without deep changes in the political system, that is, breaking up political monopoly of the communist party (see e.g.Gaidar 1989).
This is not an easy question to answer. Obviously, personal factors played a big role. We mean the family background of Deng Xiaoping (landowner), his education and life experience, undisputable political and managerial skills, which, by the way, allowed him to survive politically and physically the period of Cultural Revolution. These were characteristics and skills, which most of the Soviet lead- ership in the post-Stalin era lacked. However, few other systemic factors did also matter.
First, as we mentioned before, after the decade of Cultural Revolution and earlier Maoist economic experiments the Chinese economy reached its historical bottom and the largest world nation continued to remain on the verge of physical survival. The memory of the Great Famine in 1958–1962 that cost some 40–45 million of human lives (Dikotter 2010) was relatively fresh.
Thus, the radical improvement in economic situation was a matter of survival of not only a nation but also the ruling CPC.
Second, the Cultural Revolution destabilised the CPC itself. At the same time, it discredited an extreme left-wing collectivist agenda pursued by the so-called Gang of Four (which included Jiang Qing, the last wife of Mao Zedong), creating demand for more pragmatic policies rep- resented by Deng and his supporters. Passing away of the CPC Chairman Mao and Prime Minister Zhou Enlai (both died in 1976) opened the door for personal changes at the top of CPC and government hierarchy.
Third, structural characteristic of the Chinese economy (see Subsection 2.2) meant that the political weight of the CPC functionaries associated with heavy industry and large SOEs was smaller than in the FSU and CEE. In practical terms, this meant less political resistance against the changes in the economic system.
To have a complete picture, in 1980, Deng Xiaoping initiated a political reform aimed at consolidating the dominant role of the CPC in the political system while avoiding the‘personal cult’ and political excesses experienced in the Mao era. The system of internal checks and balances introduced by Deng included:
The principle of collective leadership in the CPC and government.
Mandatory personal rotation at the top political positions in the CPC Central Committee and Government: they could be occupied by the same person for maximum twofive-year terms.
Mandatory retirement of the members of Central Committee at 65 and maximum age of nomination to the Political Standing Committee of the Political Bureau at 68.
The practice that the outgoing leader chooses successor of his successor.
These checks and balances survived until mid-2010s. Since then they have been gradually dismantled by the current President of the People’s Republic of China (PRC) and CPC General Secretary Xi Jinping.
Despite being able to initiate and continue market-oriented economic reforms, the CPC’s support for them was never unequivocal and undisputable. Quite often, necessities dictated by logic of economic reforms and economic governance clashed with the official party ideology and interests of various fractions of the CPC apparatus (party nomenclature). This was the main reason of the Chinese‘gradualism’ (see Section 3).
3. CONSEQUENCES FOR TRANSITION STRATEGIES
Initial conditions (Section 2) determined the available choices of transition strategies. China could easily privatise its agriculture because collectivisation of the Mao era did not last long and
was rather shallow in institutional and economic terms (the Chinese collective farms were less industrialised than those in the FSU–CEE). Given a dominant role of this sector in the 1970s, its privatisation gave a powerful boost to the entire Chinese economy and contributed to improving living standard of the large part of population.4Furthermore, labour surplus in agriculture could be quickly employed by new collective, quasi-private and private enterprises in industry and services, which became the main engine of rapid economic growth at that stage. The existing SOEs although largely inefficient did not produce a major burden for the Chinese economy because of their limited share in GDP. Therefore, their restructuring could be conducted in a gradual way. In addition, due to the largely unchanged nature of the political system the Chinese authorities retained administrative capacity, including coercive power, to continue selected in- struments of the command system.
Overall, the Chinese economic policy in the 1980s and 1990s reminded, to some extent, the New Economic Policy (NEP) in the USSR in the 1920s (Mau 2013 for the history of NEP), which was largely market driven but with the substantial role of central planning and gov- ernment intervention. Like in the case of the Chinese reforms in the 1980s and 1990s, NEP also contributed to rapid economic recovery, after damages of the WWI, the civil war of 1918–1920, and the Bolshevik war communism. Unfortunately, it was abandoned in the late 1920s in favour of forced industrialisation, collectivisation of agriculture and building a hyper-centralised system of central planning.
The CEE/FSU economies had to go through a painful restructuring, and partly de-indus- trialise to release resources, which then could be reemployed in a more efficient way. The additional economic and social challenge came from the necessity to reduce social spending and cut various subsidies to restore fiscal, monetary and balance-of-payments equilibria. Because the command system imploded at the very beginning of transition, its continuation, even partial, was problematic. Those countries (especially in the FSU region), which tried to do so only extended the period of no-plan-and-no-market systemic vacuum, which caused deeper output decline for a longer period of time and more acute macroeconomic disequilibria (Dabrowski 1996;Havrylyshyn 2020).
Thus, slow reforms often referred as ‘gradualist’ strategy (see e.g., Dewatripont –Roland 1992) were a less promising option in CEE/FSU (as compared to China) for administrative capacity reasons because of government’s inability to‘fine tune’such a process. However, there were other, perhaps even more important arguments in favour of launching fast and compre- hensive reform package:
Disappointing experience with partial‘market socialism’reforms before 1989.
Desire to build expectations of the serious and irreversible character of the undertaken re- forms (contrary to the reform attempts before 1989) to convince the economic agents to adjust their behaviour to the new rules of game as quickly as possible (Dabrowski 1996).
Fear that old institutions can damage new policies and, in extreme cases, lead to their reversal (importance of a‘critical mass of reforms’).
Political economy arguments–effective use of the window of political opportunity created by the collapse of the communist regime (the period of ‘extraordinary politics’ according to
4According toSachs–Woo (1997), agriculture grew on average by 10% a year, between 1981 and 1984.
Balcerowicz (1994)) and avoiding risk of creating ‘intermediate’ winners who can block further reforms (Krueger 1993;Hellman 1998).
Empirically,in most CEE/FSU countries, building foundations of a market system took up to 10–12 years from its start while in China it took up to 25 years. One may consider that in both cases the basic transition process was completed by the early 2000s.
In the CEE/FSU region, the transition-related output decline (or‘transformational recession’
using Kornai (1994) terminology) lasted from three to ten years. Its length and depth, and strength of the subsequent output recovery depended on two factors (De Melo et al. 2001;World Bank 2002;Havrylyshyn 2020):
Initial conditions, that is, the size of inherited structural and institutional distortions, and scale of macroeconomic disequilibria; on average, they were more severe in the FSU than in the CEE.
Speed, comprehensiveness and internal consistency of economic reforms (faster and comprehensive reforms shortened the period of output decline and allow earlier start of the recovery phase); here the countries of Central Europe and Baltic region were the relative champions.
In the part of the CEE/FSU region (former Yugoslavia, Southern Caucasus, Tajikistan and Moldova) violent ethnic conflicts made the situation even worse, that is, they led to a deeper and more prolonged output decline.
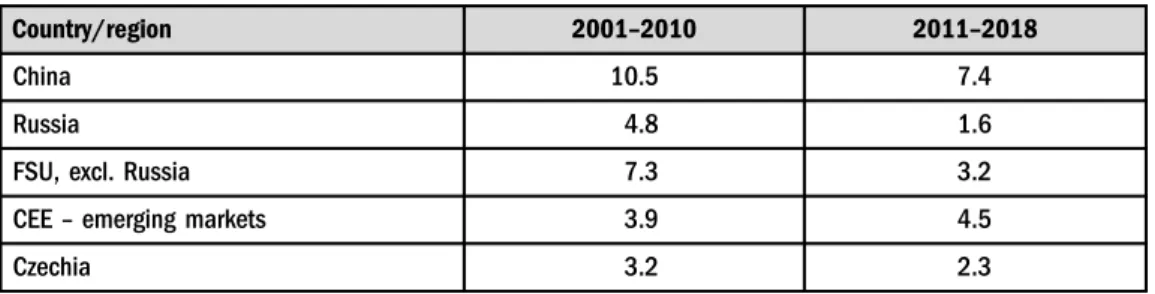
Since 1980s, China recorded an uninterrupted period of rapid growth at record-high rate by international standards (close to 10% annually or sometimes higher–seeTable 5), regardless of speed of its reforms, which varied over time. This star growth performance and associated success in poverty reduction led some authors (e.g., Stiglitz 1999a; Abasov 2017) to the conclusion on the superiority of the Chinese‘gradualism’ over the CEE/FSU ‘shock therapy.’
However, such an opinion can be questioned for at least three reasons:
First, it disregards differences in initial conditions analysed in Section 2.
Second, it is based on an oversimplified picture of the speed and radicalism of reforms in both cases. Given the sectoral structure of the Chinese economy, the first step taken in 1978, that is, de-collectivisation of agriculture was very radical and meant huge systemic change. On the other hand, actual pace of reforms in some CEE/FSU countries was not so rapid and radical as
Table 5.Real GDP–average annual changes, %
Country/region 2001–2010 2011–2018
China 10.5 7.4
Russia 4.8 1.6
FSU, excl. Russia 7.3 3.2
CEE–emerging markets 3.9 4.5
Czechia 3.2 2.3
Source:IMF (2019, Tables A2 and A4, pp. 157 and 160) and own calculations.
originally declared and indented. This relates, in first instance, to Russia, which was considered (incorrectly) by some analysts as the exemplary case of a‘shock therapy,’while it was not.
Third, the Chinese ‘gradualism’ was not necessarily the result of the consciously designed strategy. Rather, it resulted from the political struggle within the CPC where part of the lead- ership resisted reintroduction of capitalism. Anti-reform pressure became particularly strong after defeating the protest movement on the Tiananmen Square in June 1989. Again, inter- vention of Deng Xiaoping (who, by the way, stayed behind a brutal crackdown on Tiananmen) saved the economic reform course.
Quite often, circumventing anti-reform resistance required various kinds of intra-CPC compromises. They concerned both specific institutional solutions, for example, dual pricing (administratively regulated and freely determined) and dual-track liberalisation (Roland 2002;
World Bank 1996, Box 2.2: 24), creating town-village enterprises (TVEs) which formally rep- resented municipal or collective ownership but behaved similarly to private enterprises (Woo (2007) for analysis of their various genesis and forms), and reform sequencing, for example, introducing new mechanisms in the selected provinces or industries, including creation of the special economic zones. Jefferson – Rawski (1994) and Roland (2002) claim that such an approach helped to build social and political constituency in favour of further reform steps.
However, the above-mentioned compromises were costly, both economically and socially.
Dual pricing and dual-track liberalisation created opportunities for price arbitrage, asset strip- ing, building oligarchic fortunes, rapid increase in income and wealth inequalities and cor- ruption. Regional and sectoral gradualism has led to substantial inter-regional inequalities, which continue until now. By the way, the similar phenomena could be observed during the Gorbachevperestroikain the Soviet Union where partial reforms (like the laws on cooperatives and leasing of 1988) and attempts to create parallel markets5 in the environment of gradual collapse of central planning system contributed to building an oligarchic class.
As we mentioned above, China had both an economic room and political capacity to fine- tune such a gradual strategy whatever was the reason of its adoption. Eventually, it led to building a predominantly market economic system based on private ownership although with visible state footprint, remnants of communist ideology and numerous distortions (see Sub- sections 4.4 and 4.5).
As building counterfactual historical scenarios always includes a speculative component and, therefore, is methodologically risky one cannot answer the question whether faster reforms in China would bring better results. However, attempts to idealise the actual Chinese way of reforming its economy as the painless one, with no losers (Lau et al. 2000) seem to go too far.
The same concerns applicability of the Chinese experience to the CEE and FSU transition disregarding different initial conditions. Even intellectual supporters of the Chinese reform strategy (e.g.Rawski 2010) acknowledge that lessons from the Chinese development success are of limited relevance for others. Overall, it is hardly to disagree withSachs (1995)who argues that
‘what has worked in East Asia does not automatically work in Eastern Europe or Russia, and vice versa.’
5Actually, theperestroikapartial reforms were based, to some degree, on the experience of the Chinese reforms of the early 1980s (Sachs 1995).
4. COMPARISON OF ECONOMIC PERFORMANCE AND CONTEMPORARY ECONOMIC SYSTEMS
After revisiting the historical debate on differences in early transition strategies in China versus CEE–FSU (Sections 2 and 3) we will look at more recent economic performance and contemporary economic systems. We will start from growth performance and level of economic development (Subsection 4.1), followed by other macroeconomic indicators (Subsection 4.2), social indicators (Subsection 4.3), role of public ownership (Subsection 4.4) and economic governance and business climate (Subsection 4.5).
4.1. Growth performance and level of economic development
Table 5presents average growth rates of China, Russia, the FSU countries6other than Russia, the emerging-market economies in CEE, and Czechia, which belongs to the group of advanced economies7 and represents the highest income-per-capita level among the post-communist countries. The growth statistics covers years 2001–2018, that is, the period after the end of the initial transition process.
Data ofTable 5confirm that China continues to grow at a rapid pace, one of the highest in the contemporary world’s history although the annual rate of growth has been gradually decreasing. The similar decreasing growth trend can be observed in CEE and FSU. Apart from the systemic and institutional factors (see Subsection 4.4), unfavourable demographic trends (shrinking working-age population and population ageing) are responsible for slower growth.8 In case of China, demographic challenge may be even more dramatic than in Europe or Japan due to Deng’s one-child policy launched in 1979 (Scharping 2003).
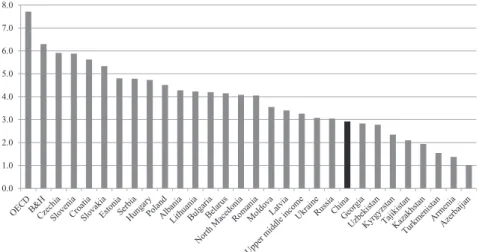
Four decades of rapid growth returned China’s status as the largest world economy (in PPP terms), the status which it enjoyed since ancient times until the beginning of the 19th century. It became the world’s largest manufacturer and manufacturing exporter. China also substantially increased its GDP per capita level. Once one of the poorest countries in the world (see Sub- section 2.1), China belongs now to the group of upper-middle income countries, according to the World Bank classification.9 Nevertheless, there is still a long way to catch up with high- income countries. Among the group of former CPEs, China represented in 2018 an income-per-
6Until April 2019, the IMF World Economic Outlook semi-annual databases used the name of the Commonwealth of Independent States (CIS) for the group of 12 FSU countries (all former Soviet republics except the Baltic ones (IMF 2019, Table E: 138)). Since October 2019, this regional group was discontinued: Belarus, Moldova, Russia and Ukraine were included into the Emerging and Developing Europe group while the remaining 8 countries–into the Middle East and Central Asia group. To have opportunity to present the FSU countries as a single group we use April 2019 data as the latest available.
7Since 2013, the IMF World Economic Outlook aggregates those CEE countries that are not considered as advanced economies into the regional group of Emerging and Developing Europe (EDE; previously Central and Eastern Europe).
This group also includes Turkey which is not a former communist country. On the other hand, the countries that adopted euro (Estonia, Latvia, Lithuania, Slovakia and Slovenia) and Czechia belong to the category of advanced economies. Since October 2019, the EDE group also includes Belarus, Moldova, Russia and Ukraine.
8The post-Soviet Central Asia where population continues to grow is an exception.
9https://datahelpdesk.worldbank.org/knowledgebase/articles/906519-world-bank-country-and-lending-groups.
capita level comparable to most of the FSU and Western Balkan countries but still behind the EU new member states, Russia and Kazakhstan (Figure 1).
4.2. Other macroeconomic indicators
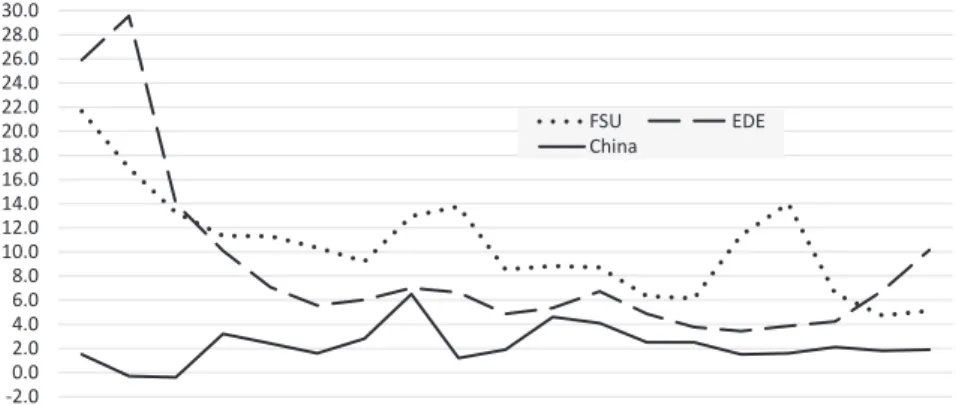
China has been traditionally a low-inflation country which is confirmed by Figure 2. Both the CEE (EDE) and FSU countries have represented higher inflation figures, especially at the beginning of the new Millennium.10
Macroeconomic prudence of China is less seen in the fiscal policy sphere (Table 6). It continuously ran a general government (GG) deficit, which increased towards the end of the analysed period. Consequently, GG gross debt-to-GDP ratio also grew systematically, reaching the level of 50% in 2018. The FSU region did much better, mainly due to fiscal surpluses in Russia, Kazakhstan and other oil- and gas-exporting countries in the years of high hydrocarbon prices.
More interestingly, China is no longer a country with low level of fiscal redistribution as it used to be at the beginning of its transition. In 2018, its GG total expenditure-to-GDP level was higher than the FSU average and only 4 percentage points lower as compared to the EDE average. Its GG revenue-to-GDP level is still lower than the FSU and EDE averages, but the difference is small.
Figure 1. GDP per capita in current prices, PPP terms, international dollars, 2018 Source: IMF World Economic Outlook database, April 2019.
10However, one should remember that the EDE group also includes Turkey, which traditionally has had higher inflation.
On the other hand, it does not include those CEE countries which adopted euro and Czechia.
Despite increasing level of fiscal redistribution and fiscal deficit, China continues to have a record-high gross national saving rate (44.6% of GDP in 2018; down from 52.3% in 2008) (Figure 6). It is accompanied by an equally high total investment rate of 44.2% of GDP (down from 48% in 2011), which may help to explain the record-high growth rates. This also means the once substantial current account surplus which spurred controversies between China and the US has largely disappeared (Figure 3).
Figure 2.End-of-year CPI annual changes, %, 2000–2018 Source: IMF World Economic Outlook database, April 2019.
Table 6.Basicfiscal indicators, % of GDP, 2000–2018
Item Region/country 2000 2005 2010 2015 2018
GG revenue FSU 32.9 36.3 32.8 30.7 34.5
EDE 35.0 35.7 35.6 35.7 35.9
China 13.3 16.7 24.6 28.5 29.2
GG total expenditure FSU 31.1 30.5 35.3 34.1 32.3
EDE 40.6 38.0 40.6 37.6 38.0
China 16.1 18.1 25.0 31.3 34.0
GG net lending borrowing CIS 2.0 5.8 –2.5 –3.3 2.2
EDE –5.6 –2.3 –5.0 –1.9 –2.1
China –2.8 –1.4 –0.4 –2.8 –4.8
GG gross debt CIS 53.8 14.9 13.7 21.5 19.7
EDE 48.4 46.4 45.6 41.3 41.1
China 22.8 26.1 33.7 41.1 50.5
Source: IMF World Economic Outlook database, April 2019.
The total investment rates in the CEE and FSU regions are much lower than in China, not exceeding 25% of GDP. What differs both the regions, is the gross national saving rate–lower in the CEE countries, which must continuously rely on imports of foreign saving. On the contrary, the FSU countries, especially oil and gas producers, do not use its entire national saving for investmentfinancing, that is, they run current account surpluses.
Looking ahead, one may ask whether the very high saving and investment rates in China have chance to continue in the long term or will they decrease gradually as result of de- mographic changes and increasing degree of fiscal redistribution (as it happened in Japan since 1980s).
4.3. Social policy and social services
In most advanced economies and several emerging-market economies, public expenditures on pensions are substantial spending items, often the largest ones. This also refers to the former CPEs, which nowadays spend around the OECD average or more (Table 7). However, China continues to be the exception. It spends two-to-three times less than their CEE and FSU peers but more than India, Indonesia, South Africa, and Saudi Arabia (OECD 2019a, Table 8.5: 203).
Moderate level of public pension expenditures in China can be explained largely by its limited coverage (only urban workers and public sector employees–seeOECD 2019b).
China also spends less from public sources on health care than the CEE and European FSU countries (Figure 4). However, its domestic GG health expenditure is only slightly below the average of the upper-middle-income countries group. The Western Balkan countries spend more than the countries of their income-per-capita level.
Comparison of government expenditure on education is more difficult due to incomplete WDI dataset–data for China, the Western Balkans countries (except Serbia) and two Central Figure 3. Gross national saving and total investment, % of GDP, 2000–2018
Source: IMF World Economic Outlook database, April 2019.
Asian countries are lacking (Figure 5). To compare China with other countries we must use information from the Chinese government sources, which are not necessarily fully comparable with the WDI database. According to these sources,11expenditure on education amounted to 4.11% of GDP in 2018, that is, it was approximately at a median level of the analysed group and above the upper-middle-income countries average.
Overall, the analysed data demonstrate that while the gap between China and the CEE–FSU countries in expenditure for social policy and social services narrowed since the beginning of transformation it remains substantial in case of public pension and healthcare spending.
4.4. The role of public ownership
The PRC officially continues to call its economic system as‘socialist market economy,’declares
‘socialist public ownership’of means of production as its basis and refers to Marxism–Leninism and Maoism as the guiding ideologies in its Constitution (European Commission 2017). Other CEE–FSU countries departed from such ideological references at the beginning of transition even if they still have large public sectors and do not refrain from excessive government interventionism (see Subsection 4.5). For example, the Constitution of the Russian Federation (Article 7.1) declares Russia as the‘social’ (but not‘socialist’!) state, integrity of its economic space, a freeflow of goods, services andfinancial resources, support for competition, freedom of economic activity and equal treatment and protection of all forms of ownership, including a private one.12That is, at least on the paper, it acknowledges all major principles of an open market economy.
Figure 4.Domestic GG health expenditure, % of GDP
Source: World Bank’s WDI,https://databank.worldbank.org/source/world-development-indicators, updated on May 19, 2020.
11http://english.www.gov.cn/statecouncil/ministries/201910/17/content_WS5da82aa2c6d0bcf8c4c1549c.html.
12http://www.constitution.ru/en/10003000-02.htm.
Figure 5. Government expenditure on education, total, % of GDP, 2016
Source: World Bank’s WDI, https://databank.worldbank.org/source/world-development-indicators, updated on May 19, 2020.
Figure 6. World Bank‘Doing Business Survey’ –ease of doing business score, 2020
Note: The ease of doing business score is a synthetic measure in the scale of 1–100 where higher score means easier business environment. It consists of 10 detail indexes related to starting a business, dealing with construction permits, getting electricity, registering property, getting credit, protecting minority investors, paying taxes, trading across borders, enforcing contracts and resolving insolvency.
Source: https://databank.worldbank.org/source/doing-business, updated on 23 October 2019.
The same concerns constitutions and legislation of the CEE countries, which already joined or aspire to join the EU where acceptance of basic principles of an open market economy (sometimes with the adjective‘social’) based on private ownership and its far-going protection is even more straightforward.
Empirical analysis of the size of state ownership is not an easy task due to the methodological problems with their measurement and, therefore, scarcity of cross-country comparative statis- tics.
Until 2010, the European Bank for Reconstruction and Development (EBRD) estimated shares of the private sector in GDP in the CEE and FSU countries. In 2010, they varied between 60% (Bosnia and Herzegovina, Serbia and Ukraine) and 80% (Estonia, Hungary and Slovakia) with four exceptions: Turkmenistan (25%), Belarus (30%), Uzbekistan (45%) and Tajikistan (55%).13Shares of private sector employment represented the same range.
There is no more recent comparative cross-country estimation of private sector share in GDP or employment. Since 2010, one could observe both further privatisation (Belarus, Uzbekistan and Western Balkans) and renationalization (Russia, Kazakhstan, Hungary and Poland). According toGIEP (2018: 214), the contribution of the public sector (SOEs, GG and state unitary enterprises) to Russia’s GDP amounted to 46% in 2016.
The World Bank analysis (Zhang 2019) and announcements of the Chinese officials (China Daily 2018) put estimates of private sector contribution to GDP of this country at minimum 60% of GDP. Its share in total employment is even higher–over 80% thanks to private agri- culture. Thesefigures look comparable with most CEE–FSU countries.
Table 7.Public expenditures on pensions, % of GDP, 2015–2016
Country Percent of GDP
China 4.1
Czechia 8.2
Estonia 8.1
Hungary 9.7
Latvia 7.4
Lithuania 6.9
Poland 11.2
Russia 9.1
Slovakia 8.6
Slovenia 10.9
OECD average 8.8
Source:OECD (2019a, Table 8.5, p. 203).
13http://www.ebrd.com/downloads/research/economics/macrodata/sci.xls.
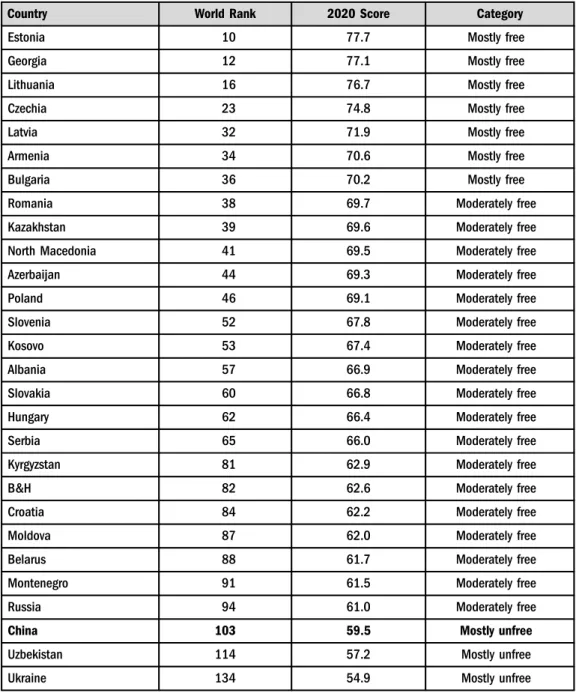
Table 8. Heritage Foundation Index of Economic Freedom, 2020
Country World Rank 2020 Score Category
Estonia 10 77.7 Mostly free
Georgia 12 77.1 Mostly free
Lithuania 16 76.7 Mostly free
Czechia 23 74.8 Mostly free
Latvia 32 71.9 Mostly free
Armenia 34 70.6 Mostly free
Bulgaria 36 70.2 Mostly free
Romania 38 69.7 Moderately free
Kazakhstan 39 69.6 Moderately free
North Macedonia 41 69.5 Moderately free
Azerbaijan 44 69.3 Moderately free
Poland 46 69.1 Moderately free
Slovenia 52 67.8 Moderately free
Kosovo 53 67.4 Moderately free
Albania 57 66.9 Moderately free
Slovakia 60 66.8 Moderately free
Hungary 62 66.4 Moderately free
Serbia 65 66.0 Moderately free
Kyrgyzstan 81 62.9 Moderately free
B&H 82 62.6 Moderately free
Croatia 84 62.2 Moderately free
Moldova 87 62.0 Moderately free
Belarus 88 61.7 Moderately free
Montenegro 91 61.5 Moderately free
Russia 94 61.0 Moderately free
China 103 59.5 Mostly unfree
Uzbekistan 114 57.2 Mostly unfree
Ukraine 134 54.9 Mostly unfree
(continued)
However, since 2007 the ratio of SOE assets to Chinese GDP has been increasing (IMF 2020, Online Annex Figure 3.1.1). SOEs also enjoy privilege of access to credit resources in state- owned banks and other form of state aid (the similar phenomenon is observed in Russia and few other FSU countries). The current political leadership of China sees SOEs as an engine of economic growth despite their inferior performance as compared to private companies.
Furthermore, the Chinese authorities try to influence activities of private enterprises, especially the largest ones with the international outreach (Lardy 2019). Such a phenomenon (using large private corporations as a tool of government policies) has also been observed in Russia, Kazakhstan and few other countries, especially those with authoritarian or semi-authoritarian political systems (see Section 5).
Therefore, the largest Chinese and Russian SOEs often pose a challenge to free global competition. Among the 50 largest non-financial SOEs in the world, 20 are Chinese, including the top three (China Petrochemical, China National Petroleum and State Grid China) (IMF 2020, Fig. 3.6). There are also two Russian companies (Rosneft’and Gazprom14) and one from Azerbaijan (SOCAR–The State Oil Company of Azerbaijan).
4.5. Economic governance, business climate and corruption
Comparing the degree of governmental interventionism in individual economies is possible only in indirect way. Few global surveys can serve as proxies of business and investment climate and economic freedom. We will use four of them (all computed on annual basis): the World Bank Doing Business Survey (WBDBS), which tries to capture easiness and speed of various business related administrative procedures; the Heritage Foundation Index of Economic Freedom (HFIEF), which measures various aspects of economic liberalisation and macroeconomic policy prudence; the Transparency International Corruption Perception Index (TICPI); and the World Bank World Governance Indicators (WBWGIs) covering six dimensions of economic and political governance. Each of the above rankings is based, to a large degree, on opinion surveys of business community what may involve some methodological problems such as representa- tiveness of the surveyed sample, potential bias in surveyed opinions, weights attached to indi- vidual components of the synthetic indexes, cross-country comparability of opinions, etc.
Table 8.Continued
Country World Rank 2020 Score Category
Tajikistan 155 52.2 Mostly unfree
Turkmenistan 170 46.5 Repressed
Source:https://www.heritage.org/index/ranking.
Note: The HFIEF is a synthetic index in the scale of 0–100 in which higher score means more freedom. It consists of 12 detail indexes related to property rights, judicial effectiveness, government integrity, tax burden, government spending,fiscal health, business freedom, labour freedom, monetary freedom, trade freedom, investment freedom andfinancial freedom.
14Gazprom has been frequently used by the Russian authorities as a foreign policy tool (Jirusek–Kuchynkova 2018). It has also been a subject of anti-trust investigations in the EU (Tagliapietra 2017).
Table 9. Transparency International Corruption Perception Index, 2019
Country CPI score 2019 Rank
Estonia 74 18
Lithuania 60 35
Slovenia 60 35
Poland 58 41
Czechia 56 44
Georgia 56 44
Latvia 56 44
Slovakia 50 59
Croatia 47 63
Belarus 45 66
Montenegro 45 66
Hungary 44 70
Romania 44 70
Bulgaria 43 74
Armenia 42 77
China 41 80
Serbia 39 91
Bosnia and Herzegovina 36 101
Kosovo 36 101
Albania 35 106
North Macedonia 35 106
Kazakhstan 34 113
Moldova 32 120
Azerbaijan 30 126
Kyrgyzstan 30 126
Ukraine 30 126
Russia 28 137
Tajikistan 25 153
Uzbekistan 25 153
Turkmenistan 19 165
Source:https://images.transparencycdn.org/images/2019_CPI_FULLDATA.zip.
Note: The TICPI uses the scale of 1–100 in which higher score means less corruption.
Table 10.The World Bank World Governance Indicators scores, 2018
Country
Control of corruption
Government effectiveness
Political stability and absence of violence/
terrorism
Regulatory quality
Rule of law
Voice and accountability
Albania 0.52 0.11 0.38 0.28 0.39 0.21
Armenia 0.35 0.02 0.42 0.27 0.15 0.11
Azerbaijan 0.83 0.10 0.70 0.38 0.60 1.50
Belarus 0.19 0.30 0.35 0.66 0.83 1.35
B&H 0.57 0.62 0.39 0.21 0.23 0.24
Bulgaria 0.15 0.27 0.42 0.58 0.03 0.32
China −0.27 0.48 −0.26 −0.14 −0.20 −1.45
Croatia 0.13 0.46 0.77 0.45 0.32 0.50
Czechia 0.50 0.92 1.04 1.26 1.05 0.93
Estonia 1.51 1.19 0.60 1.56 1.24 1.21
Georgia 0.71 0.61 0.43 1.12 0.33 0.25
Hungary 0.05 0.49 0.76 0.60 0.56 0.32
Kazakhstan 0.50 0.02 0.00 0.14 0.43 1.17
Kosovo 0.52 0.43 0.61 0.28 0.37 0.12
Kyrgyzstan 0.95 0.61 0.58 0.35 0.91 0.37
Latvia 0.33 1.04 0.42 1.19 0.96 0.81
Lithuania 0.50 1.07 0.75 1.11 0.96 0.92
Moldova 0.73 0.47 0.35 0.05 0.41 0.11
Montenegro 0.02 0.13 0.11 0.36 0.10 0.08
North Macedonia
0.36 0.09 0.20 0.52 0.28 0.01
Poland 0.64 0.66 0.55 0.88 0.43 0.72
Russia 0.85 0.06 0.50 0.54 0.82 1.06
Romania 0.12 0.25 0.06 0.45 0.33 0.46
Serbia 0.37 0.11 0.08 0.01 0.15 0.00
Slovakia 0.36 0.71 0.75 0.81 0.53 0.88
Slovenia 0.87 1.13 0.91 0.69 1.06 0.99
Tajikistan 1.42 1.10 0.72 1.05 1.28 1.69
Turkmenistan 1.36 1.04 0.01 2.00 1.45 2.14
(continued)
However, this is the only available method to compare economic systems and institutions of individual countries in a quantitative way.
In the WBDBS 2020, the best scores are recorded by Georgia, three Baltic countries, North Macedonia, Kazakhstan, Russia and China, and the worse ones – by Tajikistan, Bosnia and Herzegovina, Albania, Kyrgyzstan, Uzbekistan, Ukraine and Bulgaria. Turkmenistan is not included in the survey. There is no strong sub-regional pattern apart from relatively good performance of the Baltic States and relatively poor performance of Central Asia (except for Kazakhstan). China fares better than most CEE and FSU economies.
The HFIEF offers a partly different picture (Table 8). On the one hand, three Baltic countries and Georgia are the leaders and three Central Asian countries (Uzbekistan, Tajikistan and Turkmenistan) and Ukraine are at the bottom of the ranking, like in the WBDB survey. On the other hand, China and Russia’s rating is worse than that in the WBDB while several Central European and Western Balkan countries and Armenia are ranked better.
In the TPCPI (Table 9) all former centrally planned economies are rated, on average, less favourably than in the WBDBS and HFIEF. Once again, Estonia is a leader of this group fol- lowed by Lithuania, Slovenia, Poland, Czechia, Georgia and Latvia. Most of the FSU countries are placed at the bottom of this ranking. China occupies a middle position: its corruption performance is worse than in most of CEE but better than in most of FSUs (and few Western Balkan countries).
The WBWGI assess the quality of government and governance in six categories, which relate to both economic and political system: control of corruption, government effectiveness, political stability and absence of violence and terrorism, regulatory quality, rule of law, and voice and accountability. Data ofTable 10are in line with thefindings of other surveys discussed earlier in this subsection. The Baltic countries, Slovenia, Czechia and Slovakia are the leaders while the Central Asian countries (except Kazakhstan) occupy the bottom of this ranking. On average, the EU new member states are doing better than the FSU countries (with a positive exception of Georgia). The Western Balkan sub-region is between both but remains internally differentiated –Montenegro and Serbia represent better scores than their neighbours. Interestingly, China’s performance is similar to that of the FSU countries and poor Western Balkan performers with one important positive exception – government effectiveness. This may confirm historical findings, which track back effectiveness of China’s central government and public service to ancient times (Fukuyama 2012).
Table 10.Continued
Country
Control of corruption
Government effectiveness
Political stability and absence of violence/
terrorism
Regulatory quality
Rule of law
Voice and accountability
Ukraine 0.87 0.42 1.83 0.22 0.72 0.01
Uzbekistan 1.07 0.55 0.28 1.10 1.07 1.62
Source:https://databank.worldbank.org/source/worldwide-governance-indicators, updated on 11 July 2019.
Note: Performance in each category is rated in the scale of–2.5 toþ2.5 with higher scores meaning better performance.
Even if the picture provided by the above four surveys and Subsection 4.4 is not fully ho- mogenous it suggests existence of some systematic cross-sub-regional differences in the devel- opment of market institutions, economic freedom, business and investment climate, and quality of government. On average, the new EU member states, in particular, the Baltic countries have a stronger private sector, more mature market-economy institutions and policies, are more business-friendly and free from excessive government interference. The situation in the FSU region is, on average, worse and more differentiated. With exception of Georgia and, to some degree, Armenia, economic systems of these countries are less business friendly, with more government interference and overregulation, associated corruption, state capture, insecure property rights, less domestic and external competition and weaker private sector. There are few evident reform laggards–Turkmenistan, Tajikistan, Uzbekistan and Belarus.15
The Western Balkan countries are somewhere between both groups. While in the decade of 2000s their reform dynamics supported by the EU accession perspective had suggested good chances of catching up with the EU new member states in terms of quality of economic and political systems, a decade later this process stagnated (Dabrowski–Myachenkova 2018) amid negative impact of the global and Europeanfinancial crises and increasing enlargement scep- ticism among the incumbent EU member states. Worse, the quality of economic and political governance in some new EU member states, in particularly, Hungary and Poland, also sub- stantially deteriorated (see Section 5).
According to most examined metrics, China’s economic system looks similar to the FSU countries, in particular, Russia rather than to the one of the CEE sub-region.
5. POLITICAL SYSTEMS AND THEIR IMPACT ON ECONOMIC GOVERNANCE
While the beginnings of market transformation in China and most CEE–FSU countries were different in terms of political developments (Subsection 2.4), this has changed during the next three decades. The original democratisation wave triggered by the collapse of the communist regimes in CEE and FSU has not proved sustainable in the entire region.
The reversal of political freedom and democratisation started in Central Asia, Southern Caucasus and Belarus already in 1990s and in Russia in 2000s. In 2010s, an anti-democratic drift hit part of CEE, including the EU member states and candidates such as Hungary, Poland, North Macedonia and Serbia. In few cases, authoritarian tendencies have been stopped, at least temporarily, by mass popular protests–in Georgia in 2003, in Ukraine in 2004 and 2013–2014, in Kyrgyzstan in 2005 and 2010, in North Macedonia in 2015–2016, and in Armenia in 2018. However, rarely they led to a sustainable transformation of political system towards liberal democracy.
According to the Freedom House’s Nations in Transit survey, between 2007 and 2017, the number of the CEE and FSU countries where the degree of political freedom deterioration exceeded systematically the number of countries where it improved (Schenkkan 2018). The negative trend concerned all sub-regions and all subcategories of political and civil rights. This corresponded with the global deterioration of democracy and freedom scores recorded by two leading global political surveys–the Freedom House’s Freedom in the World (FHFiW) 2018
15In the decade of 2010s, Belarus and Uzbekistan made some progress in market-oriented reforms while Tajikistan backtracked.
(Abramowitz 2018) and the Bertelsmann Foundation’s Transformation Index (BTI) 2018 (Bertelsmann 2018).
As a result of this authoritarian drift, the contemporary political systems in several FSU countries, including Russia, does not differ so much if at all from that of China (Figure 7).16The only externally visible difference relates to ideological foundation of political regimes. The Chinese political and economic system continues to refer to the ideology of Marxism and Maoism and the leading role of the CPC (see Subsection 4.4) while in the case of the authoritarian or semi- authoritarian regimes in the FSU and CEE the Marxist-Leninist ideologies of the past were replaced by the nationalist and sometimes religious slogans as means of political mobilisation.
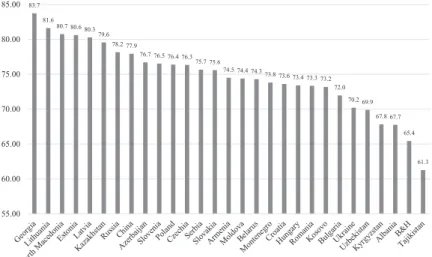
Figure 7 also confirms the existence of sub-regional differences similar to those related to eco- nomic systems (see Subsection 4.5). The group of politically Free countries (according to the Freedom House Global Freedom Scores (FHGFSs)) consists of only the EU new member states, except Hungary which was recently downgraded to the Partly Free group. The later also includes all Western Balkan countries plus Ukraine, Georgia, Moldova, Armenia, and Kyrgyzstan. Russia, Belarus, Azerbaijan, the remaining Central Asian countries and China belong to the Not Free category.
An interesting question, also in the context of historical discussion on transition strategy (see Subsection 2.4 and Section 3), is whether authoritarian drift has a negative impact on economic reforms. While the analysis of interrelations between economic and political freedoms, and between market and democracy goes beyond the remit of this paper,17 Figure 8 suggests a certain correlation between both. Nevertheless, there are some outliers, especially below the
Figure 7. Freedom House Global Freedom Scores, 2020.
Note: F, PF, and NF stand for Free, Partly Free, and Not Free. Global Freedom Scores are in the scale of 1–100, with higher scores meaning more political freedom.
Source:https://freedomhouse.org/countries/freedom-world/scores
16It worth to notice that the level of political control and repression in China increased in the second half of 2010s.
17For a more comprehensive debate seeDabrowski (2018).
trend line, that is, countries where degree of economic freedom is substantially higher than political freedom. It applies, infirst instance, to Azerbaijan and Kazakhstan and, to a lesser extent, to China, Russia, Belarus and Uzbekistan.
However, a closer inspection ofFigures 7and8andTable 8suggests that there are limits of‘pro- market authoritarianism.’None of the countries with poor political freedom score belongs to the
‘mostly free’category in the HFIEF. Furthermore, historical analysis of transition process suggests that in the countries that experienced authoritarian drift market oriented economic reforms were either stopped or reversed. This has happened, among others, in Slovakia (1994–1998), Belarus after 1996, Russia after 2003, China since mid-2000s, North Macedonia and Hungary since the beginning of 2010s, Ukraine (2010–2014) and Poland after 2015. On the contrary, progress in democratisation enabled launching or return to economic reforms. This was the case of Slovakia after 1998, Serbia after 2000, Georgia after 2003, Ukraine since 2014 and North Macedonia since 2016.
6. CONCLUSIONS
China and the CEE–FSU countries faced different initial conditions (economic and political) on their way to a market economy what had an impact on the choice of transition strategies. China, after itsfirst radical step (de-collectivisation of agriculture in 1978) could move more gradually what was allowed by its economic structure (low share of heavy industry in GDP and total employment) and retaining administrative control over the economy, and determined by the political controversies inside the CPC. The over-industrialised CEE and FSU countries, where the
GE
AZ KZ
AM
TM
TJ UZ
UA
CN KG
RU BY
XK MK
EE LT CZ LV SI
HR SK
BA ME MD
RS AL HU
BG PL RO
Figure 8.Interrelation between economic and political freedom, 2019 Notes: See notes toTable 8andFigure 7.
Source: https://www.heritage.org/index/rankingandhttps://freedomhouse.org/countries/freedom- world/scores
previous command system of economic management spontaneously collapsed at the end of 1980s, did not have such an option. They had to conduct market-oriented reforms as quickly as they could, with all the associated economic and social pain. Those which were unable to move quickly experienced an even deeper and more prolonged output decline and build up more distortions.
Regardless of speed and strategy of transition, almost all previously centrally-planned econ- omies, including China, completed building basic foundations of a market system by the early 2000s, although quality of economic and political institutions and policies differ between the sub- regional groups and individual countries. On average, the new EU member states in the CEE region (in particular, the Baltic countries) have more advanced and matured market institutions, more efficient governments and enjoy better business and investment climate. Their political systems are freer and more democratic. Most of the FSU region is less developed, characterised by deep structural and institutional distortions, is less business friendly, and it suffers from a far-going authoritarian drift in a political sphere. The Western Balkan countries and few FSU ones, espe- cially Georgia and Armenia, are somewhere between both the groups in terms of quality of in- stitutions and economic policies. China, despite its impressive economic growth and poverty reduction record, is close to the FSU region in institutional and systemic terms.
Almost everywhere significant market-oriented reforms stopped around mid-2000s and, in several cases, the earlier reforms were partly reversed. This can be explained by reform fatigue after the heroic period of 1990s, completing the EU accession process by most of the CEE countries, unclear EU enlargement prospects for the Western Balkan countries, good economic performance in the early and mid-2000s but in some countries also in mid- and late-2010s, the authoritarian and populist drift in a political sphere, and others.
In the first half of 2020, all countries in the world have been hit heavily by economic and social consequences of the COVID-19 pandemic. However, this is not the only challenge faced by the CEE–FSU region and China. Few years earlier, most of them, apart from the post-Soviet Central Asia and Azerbaijan, entered the stage of population decline and ageing.
This means that the previous high rates of economic growth, in China and elsewhere, are no longer possible. There are also clear limits of growth model of many FSU countries based on high commodity prices, especially given the potential impact of green transition on oil and gas producers. However, sectoral restructuring, increasing investment and total factor productivity, which may at least partly substitute the shrinking labour force and decreasing commodity dependence, require a new wave of reforms, going beyond pure economic policy measures.
Increasingly, problems with the rule-of-law, lack of independent and effective judiciary, and professionally competent civil service, excessive power of security and law enforcement agencies, insecure property rights, corruption and state capture, restrictions against foreign investors, etc.
are seen as the key obstacles to business and investment activity and, therefore, to economic development. In turn, this kind of deep institutional changes are impossible in the political environment of hard or soft authoritarianism or distorted, imperfect democracy.
REFERENCES
Abasov, M. (2017): Comparison of Chinese Reform Experience with Other Transition Economies (in the Example of Russia). Middle East Technical University, Ankara, 27 May, Munich Personal RePEc Archive.https://mpra.ub.uni-muenchen.de/79841/1/MPRA_paper_79841.pdf.