PA LE OG EO GR AP HY A ND L OE SS
PALEOGEOGRAPHY AND LOESS
PLEISTOCENE CLIMATIC AND
ENVIRONMENTAL RECONSTROCTIONS
AKADÉM IAI KIADÓ ■ D UD A PEST
PALEOGEOGRAPHY AND LOESS
(Studies in Geography in Hungary, 21.) Edited by
M. PÉCSI and A. A. VELICHKO
The INQUA Commission on Loess and Com- mision on Paleogeographic Atlas discussed and fixed the contents of the Paleogeographic Atlas of the Northern Hemisphere: a series of maps registering global paleoenvironmental changes during the Upper Pieistocene. The lectures presented at the joint session of the two commissions are published in this volume.
Papers are mostly concerned with Late Quaternary environmental changes and climates in Europe relying on the analyses of loesses, paleosols, moraines of the succession of biogenic phenomena and of fossil animal and plant finds and, last but not least, of climatic and relief changes.
A K A D É M IA I KIADÓ, BUDAPEST
PALEOGEOGRAPHY AND LOESS
PLEISTOCENE CLIMATIC AND
ENVIRONMENTAL RECONSTRUCTIONS
STUDIES IN GEOGRAPHY IN H U N G A R Y , 21
Geographical Research Institute Hungarian Academy o f Sciences
Editor in chief:
M. PÉCSI
Editorial board:
L . BASSA Z. KERESZTESI Mrs. M. KRETZOI D. LÓCZY Mrs. J. SIMONFAI
P A L E O G E O G R A P H Y A N D LOESS
PLEISTOCENE CLIMATIC AND ENVIRONMENTAL RECONSTRUCTIONS
Contribution o f the INQ UA Hungarian National Committee to the XHth INQUA Congress
Ottawa, Canada, 1 9 8 7
Edited by
MÁRTON PÉCSI ANDREY VELICHKO
A K A D É M I A I KIADÓ, BUDAPEST 1987
Technical editor:
L. BASSA Mrs. M. KRETZOI Revised by
L. BASSA D. LÓCZY 0 . SOFFER 0 . TOMSCHEY
Translated by N. A. GOLUBOVA B. N. KLOPOTOVSKAYA
n i r\C7\
M. E. SHEVCHENKO I. I. SPASSKAYA
Technical board:
K. EVERS, J. FÜLÖP, Mrs. ZS. KERESZTESI, Mrs. J. LÄNG M. MO LNÁR, J. NÉMETH, I. POOR, Mrs. E. T A R P A Y
HU - ISSN 0081-7961 ISBN 963 05 4650 7
(C) Akadémiai Kiadó, Budapest 1987 Printed in the Geographical Research Institute Hungarian Academy of Sciences
C O N T E N T S
PREFACE 7
VELICHKO, A.A.: Relationship of climatic changes in high and low latitudes of the Earth during the Late Pleis
tocene and Holocene... 9 MOJSKI, J.E.: Chronologic correlation of loesses and
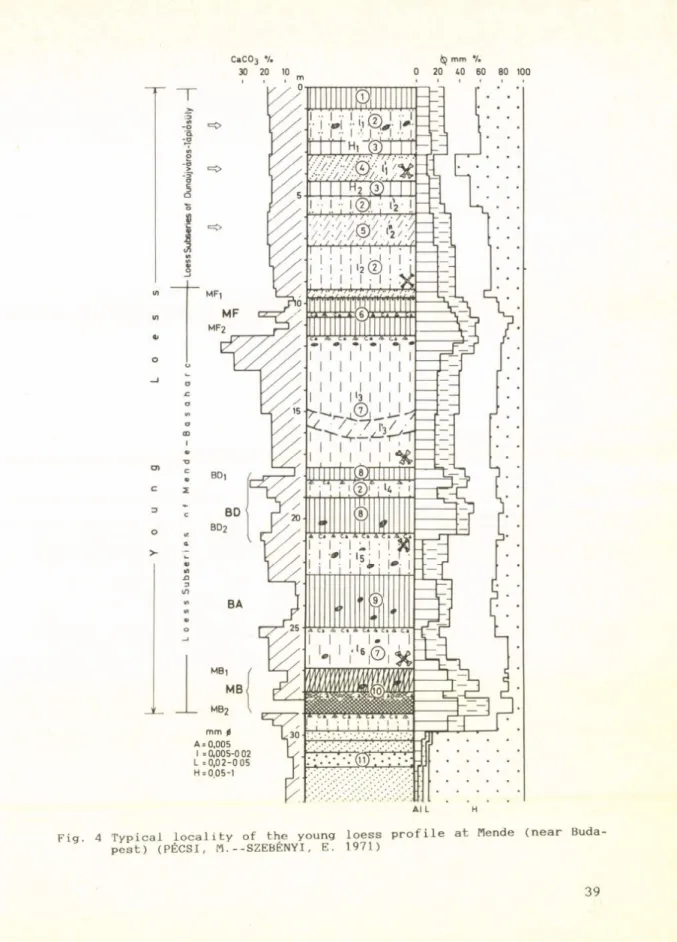
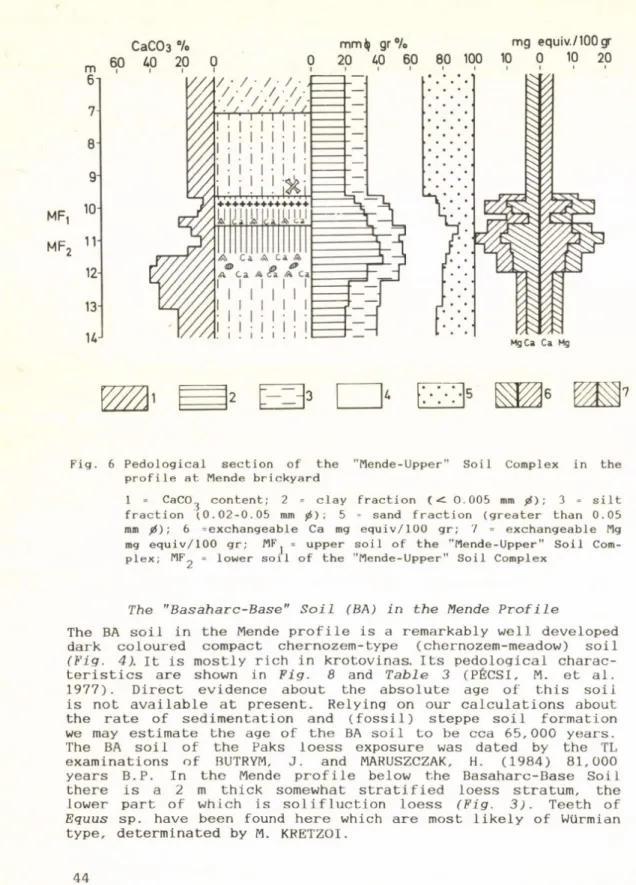
glacial deposits in Poland... 27 PÉCSI, M. : Type-locality of young loess in Hungary at
Mende... 35 VELICHKO, A.A.--KHALCHEVA, T .A.--CHIKOLINI, N.I.: Composi
tion of Late Pleistocene loesses of the European USSR... 55 DODONOV, A.E.: Geochronology of loess in Central Asia
and Quaternary events... 65 BORSY, Z.: Paleogeography of blown sand in Hungary... 75 MARKOVA, A.K.: Paleoclimatic reconstruction of the Late
Pleistocene in the Upper and Middle Dnieper regions and in Byelorussia from data on small mammals... 89 KLOPOTOVSKAYA, N .B .--DJANELIDZE, A.: Vegetation recon
struction from relict localities of modern plants in the Caucasus... 99 MOROZOVA, T.D.: Methodical aspects of genetic diagnostics
of fossil soils... 109 MOROZOVA, O. : Morphological features of paleosols from
Paks with regard to their paleoecological inter
pretation...
SPASSKAYA, I.I.: Relief-forming processes during the last ice age... 135 MAISURADZE, G.M.--DJANELIDZE, A.: Evolution of the Late
Pleistocene environment in the Caucasus... 145
5 la
P R E F A C E
The reconstruction of the changes of the physical, human and transformed environment during the youngest geological period, the Quaternary, falls within the scope of numerous disciplines.
Quaternary research attempts to follow in a retrospective way the evolution of life and Earth history during the last two million years with special regard to the last hundred" thousand years. One of the goals of this study is to determine the im
pact of the cyclically changing climate and paleoenvironments of the Quaternary on the present environmental conditions. The paleogeographic indications of global climatic and environ
mental changes can be especially well traced in glacial forms, terrestrial sediments, particularly in loess and paleosol series. In various loess layers the traces of fossil plants, animals and early man with his tools as well as physical pro
cesses, for instance, remnants of landforms developed under permafrost conditions, have also been preserved. At the same time, based on the recognition of the genetic types of paleo- sols intercalated between loess layers the warmer and more humid ecological conditions similar to but not entirely iden
tical with the present-day environment, can be reconstructed.
Thus, the identification of changes in a loess series and the results of loess stratigraphy are closely related to the interpretation of Quaternary events and changes in the paleo- environment. The age and nature of a characteristic paleoen- vironment can be reconstructed through the interdisciplinary investigations of paleosols intercalated in loess and of the enclosed paleontological and archeological finds.
With the aid of these methods, in the joint meeting held at Budapest, two committees of the INQUA (the Commission on Loess and Commission on Paleogeographic Atlas) discussed and fixed the contents of an Atlas of Paleogeography, a series of maps registering global paleoenvironmental changes in the Northern Hemisphere during the Upper Pleistocene.
The lectures presented at the joint session of the two commissions are published in a volume entitled 'Paleogeogra
phy and Loess' in the English-language series of 'Studies in Geography in Hungary' edited in the Geographical Research Institute of the Hungarian Academy of Sciences. Papers are mostly concerned with Late Quaternary environmental changes and climates in Europe relying on the analyses of loesses, paleosols, moraines, of the succession of biogenic phenomena and of fossil animals, plants and paleoarchaeological finds, and last but not least, of climatic and relief changes.
The publication is dedicated to the Congress of the Inter
national Union for Quaternary Research to be held in Ottawa, in order to demonstrate the close corporation and interdepen-
7
dence in subject and methods between loess and paleogeography studies. We believe the papers on the Late Quaternary paleo- environments to be useful contributions to the UNESCO Project 'Global Change' as well as to the interpretation of the maps in the Atlas of Paleogeography.
Budapest. May 1987
Márton Pécsi and Andrey VelichkQ
Pécsi, M .- - V elichko, A .A . (eds.) Paleogeography and Loess
Akadémiai Kiadó Budapest, 1987
R E L A T I O N S H I P O F C L I M A T I C C H A N G E S I [\J H I G H A N D L O W L A T I T U D E S O F T H E E A R T H
D U R I N G T H E L A T E P L E I S T O C E N E A N D H O L O C E N E
A.A. VELICHKO
ABSTRACT
Classical Quaternary paleogeography disting uish es the follow ing global la titu d in a l belts:
glacial, p e rig la c ia l and a rid -p lu v ia l. Chronological correlation of natural events w ithin these belts is an indispensable precondition to global clim a tic reconstructions important for the general conception of c lim a tic changes.
A t present, research workers of the Department of Paleogeography Institu te of Geography Academy of Sciences USSR have compiled a se rie s of maps, representing reconstructions of paleoclim ates on the basis of special paleogeographic qu antitative methods. The series includes temperature maps fo r July, January, mean annual temperature and that of total annual p re c ip ita tio n for the extratro pica l northern hemisphere; the maps refer to the last interglacial optimum M ikulino (Eem) isotopic stage 5e, 30,000-120,000 B.P.) and the last glacial maximum (isotopic stage 2, 19,000-3000 B.P.). The quan tita tive pa le oclim atic data indicate an unambiguous maximum am plitude of thermal fluctu ation s suggested fo r high latitudes.
During the la s t interglacial optimum (stage 5e) a rc tic seasonal temperatures were about 10 °C higher than the present day values. W ithin subtropical and tro p ic a l zones the ano
malies were sm all (about 1 to 2 °C) but an alte rna tion of be lts of weakly p o s itiv e and negative anom alies occurred. A narrow s trip w ith po s itiv e anomalies was situated at the equator. Annual precipitation increased in most of extratropical Eurasia in the la s t in te r
glacial maximum.
During the la st glacial maximum (stage 2) the temperatures decreased not only in high latitudes but also in the medium ones. A t th is tim e the lower latitudes experiences a rid iz a - tion.
Solution of a fundamental problem is necessary to understand the causes of global c lim a tic changes: whether the phases of c lim a tic parameters (temperatures and pre cip itation ) coincid e in the northern and southern hemispheres. Global longitudinal paleogeographic p ro file s argue for a synchronous character of changes.
*
9
INTRODUCTION
Global paleoclimatic reconstructions permit us to analyze fluc
tuations in temperatures and precipitation which occurred in various natural terrestrial zones in the past. These data indi
cate drastic changes in the general circulation of the earth's atmosphere. The efficacy of this approach has been demonstrated by environmental reconstructions of the last glacial maximum.
Soviet researchers have also obtained similar data for the last interglacial optimum - i.e. for a period of high-temperatures similar to those expected to occur at the beginning of the next century given the technogenic growth of CO 2 contents in the atmosphere.
The availability of these data allows to compare paleoclimates of the high and low latitudes extant during the two counter
phases of a climatic macrocycle.
EEM INTERGLACIAL AND HOLOCENE
The last interglacial optimum (Eem, Mikuiino, or Riss-Würm) is a basic chronological segment which occurred about 130,000 years ago. It corresponds to the M-6 zone in palynological dia
grams of continental deposits and to stage 5e of the deep>-sea core record. We derived information on terrestrial climates by using paleobotanical methods for estimating past temperatures and precipitation (climagrams and areagrams) developed by SHAFER, V. and IVERSEN, J. and elaborated by GRICHUK, V.P. (1973, 1982).
Temperature estimates obtained by these methods are accurate to ± 1 °C and estimates for annual precipitation to + 50 mm.
GRICHUK, V.P., GURTOVAYA, E.E., and ZELIKSON, E.M. analyzed the published pollen data from 50 sites which had the necessary species definitions. The sites satisfying these requirements were primarily located in Europe. There were considerably fewer of them in extratropical Asia and only three in North America.
BARASH, M.S., BLUM, N.S., and NIKOLAEV, V.I. derived surface water temperatures of the Atlantic and the Pacific from extant literature. Their work took into account the distribution of planktonic Foraminifera groups in the deep-sea cores (BARASH, M.S. 1974), as well as paleotemperatures reconstructed on radio- laria, coccoliths, and oxygen-isotope data. Appropriate tables (STROKINA, 1982) were then used to transform these water tem
peratures into air temperatures.
Data on hand point out two main features of the Mikuiino (Eem) interglacial climate (VELICHKO, A. A. et al. 1982, 1984).
The climate of the interglacial optimum was, at least in the eastern hemisphere, warmer and more humid than today. There was also a considerable latitudinal uniformity in temperatures and in precipitation. Both deviated from mean latitudinal conti
nental values much less than they do today.
Mean annual temperatures as well as those for July and January months, together with estimates for the amount of annual preci
pitation were reconstructed and mapped for extratropical areas
of the northern hemisphere for the Eem interglacial optimum.
Air temperatures over low latitude oceans were also reconstruct
ed. This permitted us to interpolate air temperatures over adjacent continental regions as well. Furthermore, we were able to reconstruct the mean temperatures of the near surface air layer in the northern hemisphere through special calculations done on the latitudinal belts using grids with angles of 5°
latutide-longitude. Their value was l,7°-2° C warmer than today.
There is little reliable information on the low latitudes in the eastern hemisphere during the last interglacial optimum.
Studies done at the Shati lake in Lybia (PETIT-MAIRE, M. et al.
1982), for example, indicate that maximal water levels were reached 130,000 years ago (dated by the Th/U method). This cor
responds to the time of the interglacial optimum. On the whole, the pluvial in Africa north of the equator is comparable in time to the Eem Interglacial. Direct quantitative values for an
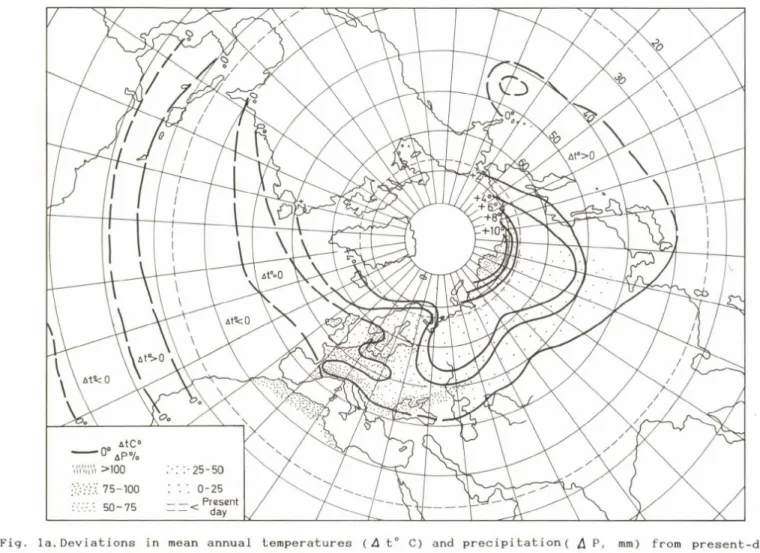
nual precipitation, to date, have been obtained only for Europe northern Africa, and for extratropical Asia (Fig. 1).
The existence of extensive Chronometrie data permits us to securely outline the changes in climatic events during the late glacial period and the Holocene, as well as to correlate changes observed at different latitudes. This can be done by comparing data received on the fluctuations in temperatures and precipitation in high and middle latitudes during the last
12,000 years (KLIMANOV, V.A.--ELINA, G. A. 1984; KLIMANOV, V.A.- BEZUSKO, V.G. 1981) with those on arid and pluvial phases in low latutides (based on research in the Sahara and in equatorial Africa) (BUTZER, K.W. et al., 1972; WILLIAMS, M. 1977; PETIT- MAIRE, M. et al., 1982; STREET, F. A.--GROVE, A.T. 1976, et al.).
This comparison is further justified because the studied regions lie in a single meridional belt of about 30° E. L., and thus form a paleogeographical profile. The results of this comparison are as follows (Fig. 2, Table 1).
The development of the two warm phases in high latitudes is quasi synchronous with that of the two humid phases in low latitudes. The correlation between them is not direct however.
In the tropical belt the main phase of humid climate occurred about 9,000 to 8,000 years ago. In the high and temperate lat
itudes that was the time of the first rather well pronounced, but not the principal, rise in temperatures. The humid phase in the low latitudes which corresponds to the time of the high
est temperatures in the high latitudes (the so-called thermal optimum, about 5,500 to 5,000 years ago) was not so pronounced.
Since the Holocene optimum was intermediate in heat supply between the Eem Interglacial and the climate of today, we can suggest that the mean global temperature during the main Holo
cene optimum was 1 °C higher than today. Paleoclimatic evalua
tions (HANSEN, I. et al., 1981) suggest the same conclusion.
If we combine the data sets on the interlatitudinal changes in the availability of heat and of moisture during the Eem and the Holocene, we can note the following (Fig. 3).
The high latitudes (from 60“ to 65°) featured the greatest rise in temperatures. In some places on continents temperatures in the summer were 6° to 8° and in the winter 10° to 12° higher than today. The warming, however, was not worldwide and depended on local features of atmospheric circulation.
11
Table 1 Phases of fluctuations in heat and moisture supply in the eastern hemisphere during the Holocene
High and low latitudes Low latitudes Late glacial, 12,000-
10,000 years ago
The growth of heat supply Beginning of humidifying Early Holocene
thermal optimum, 9,500-5,000 (8,000) years ago
During some phases (8,500; 7,800 years ago) heat supply higher than at present
The main phase of humidity
Insignificant falls in temperature within the Middle Holocene, 7,500 (8,000)-6,000 years ago
Heat supply drops to the level close to the present-day one
Humidity somewhat reduced
The main climatic optimum, Middle Holocene,
6,000-4,000 (3,000) years ago
Heat supply is the highest
High humidity
Late Holocene,
3,000 (3,500) years ago to the present;
regular fall in temperatures
Heat supply decreases, approaching,
with fluctuations, the present level
Aridization
In the middle latitudes (up to 45°-50'J) there was also a rise of temperature. Here, however, the rise was not so signifi
cant. The value of positive temperature deviations here gradual
ly, north to south, dropped to zero (compared to present-day ones).
in the low latitudes temperatures decreased only slightly.
At the same time, it seems probable that local increases in temperatures (compared to present-day ones) may have occurred during the time of general cooling. These rises were quite in
significant (not more than 1° to 2° C). This conclusion is sug
gested by temperature data from the Atlantic which indicate that one such belt of slightly increased temperatures was locat
ed at 20°-15° N. A second one was positioned near the equator.
The 2° mean annual rise in temperatures which took place during the Eem (Mikulino) was accompanied in all extratropical areas of Eurasia by an increase in precipitation. This increase in all areas (including in high and middle latitudes) was up to 50 to 70 per cent. The increase (in absolute values) was considerably greater in the west than in the east of Eurasia.
A considerable increase in annual precipitation (up to 100 per cent) was typicaL for the zone located south of the 45° - 50° latutides. This area today features a deficit of moisture.
During the Holocene optimum mean annual temperature rose by 1° C (i.e. an increase half as large as during the Mikul ino optimum) in the high and, partially, in the temperature lat-
Fig. la. Deviations in mean annual temperatures ( 4 t° C) and precipitation ( A P, mm) from present-day values in the Eem (Mikulino) interglacial optimum
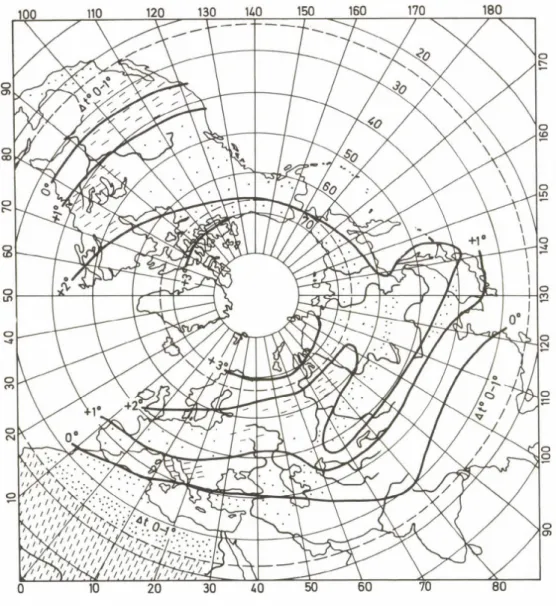
Fig. lb.Deviations in mean annual temperatures ( A t° C) and precipitation ( A P, mm) from present-day values in the Holocene optimum
itudes. Although precipiation was also somewhat higher, this increase was noticeably less than during the Mikulino optimum, and did not exceed 100 or 150 mm per year. Some sites in the south of the forest zone indicate that precipitation not only did not increase, but was 25 to 50 mm per year lower than at present (KLIMANOV, V.A.— ELINA, G.A. 1984; KHOTINSKY, N.A.- SAVINA, S.S. 1985). At the same time, the extratropical low latitudes (including areas with semi-arid and extra-arid cli
mates today) witnessed a sharp increase in humidity during the main warm phase of the Holocene. Judging from lake sediments data from Africa and western India, the most pronounced increase in precipitation (more than 300 mm per year) occurred about 9,000 to 8,000 years ago (KUTZBACH, J.E. 1981).
It is not difficult to notice that, on the whole, the inter- tropical areas with increased precipitation during the Holocene were those which experienced small decrease in temperatures during the Eem optimum. It is worth noting that at least the northern part of the same zone of decreased temperatures (the subtropics) featured a considerable increase in precipitation during the Eem interglacial optimum. In still lower latitudes, this time is comparable to the pluvial.
The above observations permit us to draw the following con
clusions. On continents, a considerable global increase in tem
peratures (a mean annual rise of not less than 2°) was accom- pained by a significant global rise in precipitation. In the high and middle latitudes, an increase in precipitation was accompained by a rise in temperatures. In the lower latitudes this increase was associated with localized small decreases in temperatures (compared to present-day ones). This decrease in temperatures occurred as a result of increased evaporation in more humid climates, rather than as a result of changes in the input of heat. Under conditions of lower rank global warming (global temperature rise about 1 °C), the increase in precipita
tion was not as pronounced in the high and middle latitudes of the eastern hemisphere. There, in some cases, precipitation even decreased locally.
The correlation between heat and humidity was essentially different on the continents of the western hemispheres. Here during the Holocene thermal optimum, annual precipitation rates
increased considerably (locally by more than 200 mm) in most parts of the temperature and subtropical zones (WEBB, T.--CUSH
ING, E.J.--WRIGHT, H.E. 1983).
THE EPOCH OF THE LAST GLACIAL MAXIMUM
The relationship between climatic events in high and low lat
itudes extant during the last glacial maximum (20,000 to 17,000 years ago) has been discussed in great detail in the literature, and several global maps published which depict the state of the natural components at that time (McINTRYRE, A. et al. 1976;
BOWEN, D.D. 1979).
This period saw a fall in temperatures which resulted in the expansion of glaciers, ice sheets, and of permafrost on
15
Fig. 2 Correlation of heat and moisture supply in high and low latitudes during the Holocene (after KLIMANOV, V .A .--BEZUSKO, V.G. 1981; KLIMANOV, V.A.--ELINA, G . A . 1984; BUTZER, K.W.--ISAAC, G.L. et a l . 1972; FAURE, H.-WILLIAMS, M. 1977; GOUDIE,
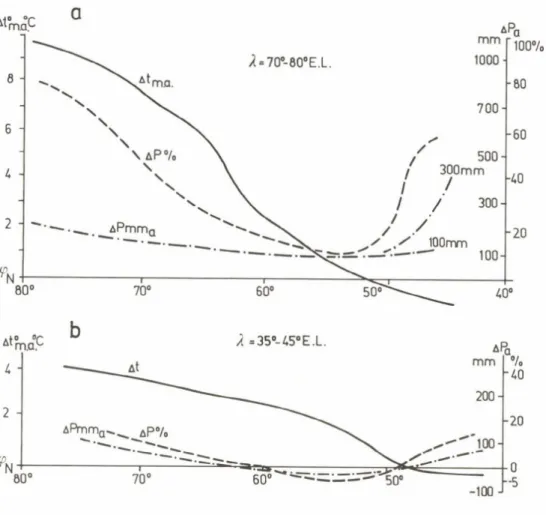
Fig. 3 Meridional profile of deviations from present-day values of mean annual temperatures ( A t ° C) and precipitation ( A ? “ year):
a) during the Mikul ino optimum in Western Siberia and in Kazakhstan by 70°-80° E; b) during the Holocene on the Russian Plain by 35- 45° E
the continents, as well as an expansion of the sea ice in the direction of the equator (up to 35° or 40° N . L . in the northern hemisphere). A sharp global decrease in precipitation was an equally important second feature of this glacial maximum (Fig.
4). This decrease, which occurred during the maximum of the last glacial epoch, resulted in the destruction of the zonal components not only in the area of the tropical forests but also in the bipolar forest zones of the northern and southern temperate belts. The latter two are global indicators of lat
itudinal belts of stable humidity. The situation, in reality, was even more complex. The woodland territories in temperate
17 2 Paleogeography and Loess
latitudes of North America differed considerably from this arid scenario. We have considered the reasons for this elsewhere (VELICHKO, A. A. 1980). Increases in humidity were also recorded in some regions of South America and of Africa - in South Kala
hari, in particular (HEINE, K. 1980). The existence of these wetter regions, however, does not warrant replacing our current concept of a predominantly arid hyperzones with one which em
phasizes migrating belts of humidity in both hemispheres. During the last glacial maximum the following three natural belts form
ed in the eastern hemisphere under the impact of decreased tem
peratures and increased aridity: the glacial one (in high and middle latitudes), the cryoarid one (in middle and high lat
itudes). The zonal structure of the earth simplified consider
ably at this time and was replaced by a hyperzone (VELICHKO, A.A. 1973).
Data on hand permit us to evaluate both the overall climate as well as inter-latitudinal changes in climate extant during the last glacial maximum as follows.
The global level of heat supply was much lower than at present. Some researchers (HANSEN, I. et al. 1981), estimate the mean global fall in temperatures during the period of the greatest cooling as 5,3° for the continental regions and 2.3°
for ocean surfaces. Global cooling was about 3° C and primarily resulted from the fall in temperatures during the cold seasons.
Mean annual t°C P r e c ip ita tio n /y e a r
N.L. 90
°
70°
50°
30°
10°
0°
10°
30° '
50°
70°
90° S.L.ii ii ii 1 vw 2 .v..v 3 .... 4 %K 5 #4 6 i t t 7 t t t 8 /»a 9
Fig. 4 Meridional landscape-climatic profile of the earth during the last glacial maximum
Vegetation: 1 = tundra; 2 = steppe; 3 = semi-desert; 4 = desert;
5 = broad-leaved forest; 7 = coniferous forest; 8 = deciduous small
In the northern hemisphere, the greatest fall in tempera
tures occurred in high latitudes (over 60°) in the glacial and north of the cryoarid belts (VELICHKO, A. A. 1980). Mean annual temperatures over the Scandinavian ice sheet dome approached -35°. At present, the mean annual temperature here is close to 0°-2°. At the same latitudes, temperatures in permafrost regions were somewhat higher than those over the glacier:
-25° to -27° (today they are -16°). In the periglacial belt there was also a considerable fall in mean annual temperatures.
Values close to the margin of the Scandinavian glacier approach
ed -10° to -12° (at present they are +6°). They were 14° to 18° lower near the southern margin of the permafrost area (i.e.
in the latitudes 50° to 45° N.L.).
Although sparse, the available data (in particular on South America, Australia, and South Africa) on the mean annual tempe
ratures in lower latitudes (20°-30°) indicate a drop of 8° to 10° (BOWLER, J.M. 1976; HAGEDORN, J. 1982 and others).
Finally, a fall in mean annual temperatures also occurred within the equatorial belt. In Columbia, for example, they fell by 6° (VAN GEEL, B. - -VAN DER HAMMEN, T. 1973). In this belt, a fall in temperatures is also observed in some oceanic regions.
For example, the equatorial water temperatures in the eastern half of the Atlantic ocean dropped by 2° (McINTYRE, A. et al.
1976) .
The decrease in the amount of precipitation was also global.
The sum of annual precipitation over glaciers in high latitudes (the Scandinavian ice sheet, for example) decreased by at least 55% to 60%. These values are derived without taking into account the increased amount of precipitation in mountains today. In the cryoglacial belt (as estimated for Eastern Europe) in high and middle latitudes, precipitation diminished by at least 40%.
Precipitation also decreased in intertropical areas. This occur
red later in regions where deserts prevail today and in areas with present-day monsoon climates.
The strongest aridization took place in the equatorial belt. Annual precipitation there decreased by 60% to 75% and tropical forests were replaced by savannas (VAN DER HAMMEN, T. 1974). In general then, comparisons of inter-latitudinal data indicate a uniform but lowered level of precipitation.
These general climatic features of the glacial maximum were expressed differently in the two hemispheres. In the west
ern hemisphere: 1) aridization was weaker, 2) glaciers were more extended (aside from the Wisconsin ice sheet), 3) some elements of forests persisted in the periglacial zone, and ac
cording to some 4) pluvial lakes in the American southwest reached their highest stands.
COMPARISON OF INTER-LATITUDINAL CHANGES IN CLIMATE
DURING THE LAST INTERGLACIAL OPTIMUM AND THE LAST GLACIAL MAXIMUM
Taking the Late Pleistocene macrocycle as an example, we can compare climatic conditions of the two opposite phases (Table 2), These phases had the following characteristics in comparison to conditions today (Fig. 3).
19
Table 2 Comparison of climatic events in different latitudes Interglacial optimum
(stage 5e)
Last glacial maximum (stage 2)
January temperatures
amount of annual precipitation
January temperatures
amount of annual precipitation
High sharp rise (> 10° C)
increase in some places 50%
sharp fall (> 20° C)
decrease (> 50%) Middle rise (< 10° C,
in the south- about 0°)
increase (in the south up to 100%)
fal 1 (> 10 °C up to 20° C)
decrease in some places Low alternation of
belts of weak positive and negat i ve anomalies
increase (in present desert areas 100%)
weak fall (from 1c to 3°)
considerable decrease (in some places, where now forests are common,
over 50%
to 75%)
Temperature deviations were much more intensive during the glacial epoch than during the interglacial one. Based on mean global air temperature values, we can suggest that the earth's surface cooled off much more intensively during the glacial maximum than it warmed up during the interglacial opti
mum (in comparison to temperatures today). Meridional profiles of both temperature and precipitation deviations were asymmet
rical .
The greatest change in temperatures during both phases (the glacial and interglacial ones) took place in the high lat
itudes. These regions were responsible for the fact that glacial cooling was far more pronounced than was interglacial warming.
At the same time it should be underscored that deviations from this pattern (namely, temperature rise during the inter
glacial and fall during the glacial periods) existed even at the equator.
Patterns of change in annual precipitation in high and partly in middle latitudes, during both glacial and interglacial epochs were similar to those observed for temperatures. Their trend during the last interglacial optimum, however, in the latitude 45° to 50° N.L. was ambiguous. During the interglacial a slight fall in temperatures (compared to present day values) was accompained by a sharp rise in precipitation. This increase was probably most acute in latitudes up to 10°-15°. This area also experienced increasing aridization during the glacial epoch.
The greatest relative decrease in precipitation, however, occur
red in the equatorial belt.
Fig. 5 Generalized scheme of changes in climatic parameters in high and low latitudes at the time of interglacial optimum and the glacial maximum
( A t m.a. and A P - deviations of mean annual temperatures and precipitation from the present-day values)
The climatic changes discussed above reflected changes in both the general circulation of the earth's atmosphere, as well as changes in the earth's heat balance. While numerous studies exist on general air circulation during the glacial period, fewer deal with atmospheric circulation during the inter
glacial optimum - a question considered in earlier articles (VELICHKO, A. A. 1980).
Here we will deal with only some ideas pertaining to gen
eral circulation. In extra-tropical regions, the interglacial optimum saw a considerable increase in the transfer of mois
ture from Atlantic to the continents (i.e. from west to east).
In high latitudes, this process coincided with the intensifica
tion of the North Atlantic warm stream. The Gulf stream penet
rated far to the east. This resulted in the warming of the whole Eurasian Arctic region (especially in its Asiatic part). At the same time, there was a decrease in the area affected by the North Asiatic anticyclone. This was especially true during the winter months. This decrease brought about a more frequent
21 2a
penetration of the area by western cyclones, and resulted in the rise of both temperatures and of precipitation in the middle latitudes, especially in inter-continental regions.
This increased influence of the western transfer was, how
ever, relative rather than absolute. Its importance became more obvious because of the reduction in the meridional circulation pattern.
It is important to consider more closely the factors res
ponsible for the more stable manifestation of the western trans
fer extant during the interglacial optimum (i.e. under condi
tions of higher global thermal regime). This phenomenon, which is reliably documented by the available data, contradicts climat
ological theory which holds that the western transfer should be weakened when high latitudes undergo warming and the thermal gradient (pole - equator) is decreased.
One possible explanation for this may be the delay in the response of atmospheric and oceanic circulation systems to the warming. The latter recreated high thermal regimes near the equator as nearly as the late glacial, while glacial systems in high latitudes dissipated more slowly and conserved low tem
peratures longer. McINTYRE, RUDDIMAN, MANGERUD, and VELICHKO in a series of publications (e.g. VELICHKO, A. A. 1980) have suggested that this asymmetry can account for some phenomena which occurred between the warm oceans and cold land masses.
Holocene research indicates that the same low temperatures ex
isted in the high latitudes as late as the beginning of the interglacial. Thus, the equator-pole temperature gradient was higher at that time than during any other period of the whole climatic macrocycle (glacial-interglacial age). This brought about a more active western transfer and an acceleration of the warm Gulf stream. Due to the inertia of the system, however, the stream reached its maximum somewhat later than the peak of the temperature gradient. This occurred during the first part of the interglacial, and soon decreased due to the absence of "feeding mechanism". Thus, it is not coincidental that ocean- ological data indicate that the Eem warming was extremely short
lived in the equatorial Atlantic.
These observations indicate that the thermal "circulation"
optimum must have occurred close to the beginning of the inter
glacial - a conclusion supported by Holocene data as well. They also explain the existence of an older thermal optimum (dated between 9,000 and 7,000 years ago) which featured high humidity.
This humidity was a result of active latitudinal circulation present everywhere, including in such arid regions as the Sahara, and the Middle East and others. This optimum may also correspond to the short global phase when the thermal regime was quasi- stable. The meridional gradient was lessened by then - which, probably, accounts for the observed lack of increase in precipi
tation in the middle latitudes.
If the above arguments are correct, then we can assume that the same double optimum existed during the Mikulino (Eem) Interglacial as well. Data from the Barbados and other regions which document several phases in the rise of ocean levels, as well as pollen information from the Grand Pile sections studied by G. W0ILLARD-R0C0UR, are in accord with such an assumption.
The fundamental differences in the mechanisms which produc
ed the two thermal optima and the resulting differences in the precipitation regimes are very significant and should be con
sidered when using paleoclimatic data to model future climatic scenarios of man-induced warming. Specific attention should be paid to past worldwide increases in precipitation. It is possible that these increases were partly due to the "circula
tion optima". Since man-induced warming cannot produce this effect, precipitation will increase less in the future than it did in the past. Furthermore, this increase in precipitation will be mostly due to an increase in evaporation in the ice- free oceans and the subsequent transfer of this moisture to the continents. This pattern has been already confirmed by spe
cialists on modern precipitation regimes (M. I. BUDYKO, O.A.
DROZDOV, etc.).
At the same time, data on hand indicate that surface water temperatures near the equator were higher during the inter- glaical optimum than recorded at present. This suggests that higher thermal states of the troposphere existed at those lat
itudes and resulted in a considerable lowering of the tropo- pause. This would have favoured 1) the preservation of the pole- equator gradient, 2) the western transfer during the climatic optimum, and 3) the transportation of moisture from the Atlantic to interior Eurasia.
The period of maximal cooling during the glacial epoch saw a general weakening in the centers of activity of atmos
pheric circulation. This feature has been extensively consider
ed in the literature (FAIRBRIDGE, R. 1972; GATER, L. 1976, etc.).
Anticyclonic systems predominated in atmospheric circulation of regions outside of the tropics. In the south they merged with the belt of the high pressure. During the late glacial maximum the sea within the present-day areas of low pressure (in particular the Icelandic minimum) became covered by ice so that activity of the atmospheric centres decreased and con
sequently intensity of inter-latitudinal exchange reduced. The joint action of these phenomena created states prerequisite for a general reduction in precipitation over the continents.
This trend towards aridization, however, was less pronounced in the western hemisphere (in North America) than in the eastern one.
We can see some regional differences in hydrothermal re
gimes during the warm and cold epochs. These differences are more evident when events in the two hemispheres are compared to each other. The noted differences in atmospheric circulation have already been discussed elsewhere (VELICHKO, A.A. 1980).
There was a considerable decrease in both temperatures and precipitation in the equatorial belt. This indicates that the zone of the intratropical convergence was not as active as today, and suggests that radical changes occurred in the atmospheric circulation pattern.
Finally, fluctuations in the thermal patterns of equatorial belts also raise the eternal question about the causes of cli
matic changes. The cooling of these belts during the glacial maxima and their warming during interglacial optima, together with the synchronized thermal fluctuations observed in both
23
hemispheres do not favour arguments about changes in the earth's orbit advocated by supporters of the Milankovich theory. Rather, they favour the hypothesis of fluctuations in the total heat income of the earth as a whole.
REFERENCES
BARASH, M.S. 1974. Migratsiya klimaticheskikh poyasov Atlanticheskogo okeana v verkhnechetvertichnoye vremya. (Migration of climatic belts of the Atlantic in the Upper Quaternary.) - Doklady AN SSSR.
216. 5. pp. 1158-1160.
BOWEN, D.D. 1979. Glaciations, past and future. - Geographical Magazine.
London. 52. 1. pp. 60-67.
BOWLER, J.M. 1976. Aridity in Australia: age, origins and expression in aeolian landforms and sediments. - Earth Science Reviews. 12.
pp. 179-310.
BUTZER, K.W.--ISAAC, G .L .--RICHARDSON, I .L .--WASHBOURN-KAMAU, C. 1972.
Radiocarbon dating of East American lake levels. New observations provide fresh insight into Late Quaternary paleoclimates. - Science#
175. pp. 1069-1076.
FAIRBRIDGE, R. 1972. Climatology of glacial cycle. - Quaternary Research, 2. pp. 238-302.
FAURE, H.--WILLIAMS, M. 1977. Quaternary paleoclimates and water resour
ces. - Bull, de liason ASEQUA. 51. pp. 64-68.
GATES, L. 1975. Modeling the ice-age climate. - Science, 191. pp. 1130- 1149.
GOUDIE, A. 1977. Environmental change. Clarendon Press, Oxford. 244 p.
GERASIMOV, I.P.--VELICHKO, A. A. (eds.) 1982. Paleogeografiya Evropy za poslednie 100 000 let. (Paleogeography of Europe for the last 100 000 years.) Moskva, Nauka. 156 p.
GRICHUK, V.P. 1973. Klimaticheskie usloviya severnogo polushariya v atlantichesky period golotsena. (Climatic conditions of the north
ern hemisphere in the Atlantic period of the Holocene.) - In:
Teplovaya melioratsiya severnykh shirot. Moskva, Nauka. pp. 107- 128.
HAGEDORN, J. 1982. Pleistocene periglacial forms in the mountains of South Africa and paleoclimatic implications. - In: 11th INQUA Congress. Abstracts. I. Moscow, p. 128
HANSEN, I.--I0HANS0N, D.--LACIS, A. et al. 1981. Climatic impact of increasing atmospheric CO^- - Science, 213. p p . 957-966..
HEINE, K. 1978. Radiocarbon chronology of Late Quaternary lakes in Kala
hari, Southern Africa. - Catena, 5. pp. 145-149.
KHOTINSKY, N .A .--SAVINA, S.S. 1985. Paleoklimaticheskye shemy territorii SSSR v borealnoe, atlanticheskoe i subborealnoe vremya. (Paleo
climatic schemes of the USSR territory in the Boreal, Atlantic and Subboreal.) - Izvestiya AN SSSR, ser. geogr. 1985. 4. pp.
18-34.
KLIMANOV, V.A . --BEZUSKO, V.G. 1981. Klímát i rastitelnost Malogo Polesya v golotsene. (Climate and vegetation of the Maloe Polese in the Holocene.) - Ukrainsky Botanichesky Zhurnal, 37. 4. p p . 24-26.
KLIMANOV, V.A.--ELINA, G.A. 1984. Izmenenya klimata na severo-zapade Russkoi ravniny v golotsene. (Changes of climate in the North- West of the Russian Plain in the Holocene.) - Doklady AN S S S R . 274. 5. pp. 1163-1166.
KUTZBACH, J.E. 1981. Monsoon climate of the early Holocene: climatic experiment using the Earth orbital parameters for 9000 years ago.
- Science, 19. pp. 59-61.
McINTYRE, a. et al. 1976. The surface of the Ice age Earth. - Science.
191. pp. 1131-1144.
PETIT-MAIRE, M. et al. 1982. Paleoenvironments du Sahara Central.
Rapport d'activité du Labor, de Ge ol . du Quaternaire, Centre Uni- versitaire de Marseille, p p . 53-82.
STREET, F.A.--GROVE, A.T. 1976. Environmental and climatic implications of Late Quaternary lake level fluctuations in Africa. - Nature, 261. pp. 385-389.
STROKINA, L.A. 1982. Srednie shirotnye znacheniya temperatury vody i vozdukha dlya mirovogo okeana. (The mean latitudinal values of the temperature of water and air for the world ocean.) - Meteorolo- giya i gidrologiya, 1982. 4 pp. 50-55.
VAN DER HAMMEN, T. 1974. The Pleistocene changes of vegetation and cli
mate in tropical South America. - I. Biogeogr. I. pp. 3-23.
VAN GEEL, B.--VAN DER HAMMEN, T. 1973. Upper Quaternary vegetational and climatic sequences of the Fequene parea (Eastern Cordillera, Columbia). - Paleogeogr., palaeoclim., palaeoecol. 14. pp. 9-92.
VELICHKO, A.A. 1973. Prirodny protsess v pleistotsene. (Natural process in the Pleistocene.) Nauka, Moskva. 255 p.
VELICHKO, A.A. 1980. Shirotnaya asimmetriya v sostoyanii prirodnykh komponentov lednikovykh epokh v severnom polusharii. (Latitudinal asymmetry in the state of natural components in the glacial epoch in the northern hemisphere.) - Izvestiya AN SSSR, ser. geogr.
1980. 2. pp. 5-23.
VELICHKO, A.A.--BARASH, M .S .--GRICHUK, V .P .--GURTOVAYA, E .E .--ZELIKSON, E.M. 1984. Klimat severnogo polushariya v epokhu poslednego, mikulinskogo
mezhlednikovya. (Climate of the northern hemisphere in the epoch of the last /Mikulino/ interglacial.) - Izvestiya AN SSSR, ser.
geogr. 1984. 1. pp. 1-18.
VELICHKO, A.A.--GRICHUK, V .P .--GURTOVAYA, E .E .--ZELIKSON, E .M .--BORISOVA, O.K. 1982. Paleoklimaticheskie rekonstruktsii dlya optimuma mikulinskogo
mezhlednikoviya na territorii Evropy. (Paleoclimatic reconstruc
tions for the optimum of the Mikulino interglacial in Europe.) - Izvestiya AN SSSR, ser. geogr. 1982. 1. pp. 15-27.
WEBB, T. Ill--CUSHING, E .J .--WRIGHT, H.E. 1983. Holocene changes in the vegetation of the Midwest. - In: Late Quaternary environment of the United States. Vol . 2. The Holocene. University Minnesota Press, Minneapolis, pp. 142-165.
25
WRIGHT, H.E. 1971, Late Quaternary vegetation history of North America.
-In: Turekian, K. (e d .): The Late Cenozoic ice ages. Yale University Press, New Haven, pp. 425-464.
ADDRESS OF AUTHOR:
A .A . VELICHKO Institute of Geography Acad. Sei. USSR Staromonetny per. 29 MOSCOW 109017
Pécsi, M.—Velichko, A .A . (eds.) Paleogeography and Loess
Akadémiai Kiadó Budapest, 1987
C H R O N O L O G I C C O R R E L A T I O N O F L O E S S E S / \ r \ I D G L A C I A L D E P O S I T S I (M P O L A N D
J.E. MOJSKI ABSTRACT
Theoretical base of age correlation between loess and g la c ia l deposits in Poland is out
lined. A stratigraphic subdivision of Polish Quaternary based on chronologic data is pro
posed w ith special reference to the stratigraphy and chronology of loesses. The main prob
lems of chronologic correlation of gla cia l deposits and loesses in Poland are discussed.
*
INTRODUCTION
During the last decade considerable number of studies concerning the stratigraphic subdivision and dating of Quaternary deposits were published in Poland (e.g. LINDNER, L. 1982, MARUSZCZAK, H.
1980, 1984, 1985, 1986; MOJSKI, J.E. 1982a, 1982b, 1985, 1986 in print; ROZYCKI, S.Z. 1980; WOJTANOWICZ, J. 1983). The strati
graphic subdivision is usually compared with so-called absolute age but with different accuracy. The dating of deposits is per
formed by means of the thermoluminescence (TL) method and com
prises the main Pleistocene facies including loess and recently also tills. Methodical premises of the thermoluminescence dating are as widely known as the doubts revealed mainly by physicists.
At least one thousand TL data were obtained in Polish labora
tories but only some of these have been published, and only few have been evidenced properly by geological data. These data with all their controversies allow to correlate the index de
posits of Polish Pleistocene series, i.e. loesses and giacigene sediments in time. Both of the facies are very common, moreover these were formed under similar climatic conditions. This con
firms the opinion on the approximately synchronous forming of the succeeding series and makes possible the attempt of cor
relation.
27
REVIEW OF RESEARCH IN POLAND
In Poland the time relations between the periods of deposition of loess and the periods of origin of glacigene sediments as well as their relationship with the type of climate have been the subject of investigations for a long time. These concerned the position of loess in the glacial cycle (development, maximum extent and decay of an ice sheet in accord with the evolution of climate). The opinion on loess formed mainly during the maxi
mum extent of the ice-sheet (SAWICKI, L. 1932; JERSAK, L. 1977) as well as during the beginning of its thawing prevails (JAHN, A. 1950, 1956). The opinion of ROZYCKI, S.Z. (1961, 1972) on the loess dust deposition at the beginning of a glacial cycle seems to be rather isolated. The idea of cyclic accumulation of loess is very old but was introduced into the Polish litera
ture by JERSAK, J. only in 1977. At the same time, the research carried out in the Polish Lowland required the adaptation of the "glacial cycle" (GALON, R. 1981) in the analysis of glacial series in the Lower Vistula River valley. The above mentioned studies were confirmed by the results of investigations on the time of accumulation and alteration of the loess cover (MARUSZ- CZAK, H. 1980, 1985, 1986). Finally, these have led to the con
clusion that a glacial cycle should not be identified with the entire glacial period, i.e. with a stage in the stratigraphic sense, because it is a lower rank unit, usually stadial (sub
stage), and it can occur many times during a cold glacial stage.
STRAIIGRAPHY AND CHRONOLOGY OF GLACIAL DEPOSIIS
The present correlation is based on the subdivision of the Pol
ish Pleistocene proposed by the author in recent papers (MOJSKI, J.E. 1986, in print). In case of loesses the correlation com
prises the last 400,000 years including two interglacials: the Mazovian and Eemian ones, and three corresponding glacial stages i.e. Wilganian, Odranian and Vistulian. In Poland no older loes
ses were recognized in details. However, there are some notices about their occurrence in the southeastern part of the Polish Lowlands within the San Glaciation deposits (RZECHOWSKI, J.
1967).
Two of these glaciations are stratigraphically divided into subunits (stadials and interstadials), and at least nine of these occur within the Odra and Vistula units. This subdivi
sion is shown in Fig. 1 illustrating both the duration and the nomenclature of subunits. It is worthy of mention that warm stages and substages (interglacials and interstadials) were comparatively short. Each of these lasted not longer than 20 ka. On the other hand, cool (cold) stages and substages were long and lasted over 100 and 20 ka respectively. Moreover, the warm units are defined according to the palaeobotanical evi
dences comprising a characteristic evolution of flora during an interstadial (interglacial) period.
5 180 Cu rv e SH A C K LE TO N ÄU PD IK E 1973
Loess s t r a t i g r a p h y Glacial s t r a t ig r a p h y M A R U S Z C Z A K M O J SK I 1 9 8 6
1 985
N e o p l e i s t o c e n e c h r o n o s t r a t i g r a p h y
P O L A N D W E U R O P E GES SUBSTAGfS
FLANDRIÁN
U P PE P L E N IG t A C /A L IN reu PL E N IG L A C IA L
1 »
VISTULIAN
M A I N G R U D Z I ^ D Z
P R E - G R U D Z I / \ D Z
K O N I N
K A S Z U B Y
| E E M I AN
0DRAN1 AN
L A T E O D R A N I AN U N I T S W A R T I A N
P O L I C H N A M A X I M U M Z B Ó J N O ? P R E - m a x i m u m
M AZ OVI AN
7
W I L G I A N
LOWER PLE N IG L A C IA L
E A R L Y G L A C IA L
E EM I AN
SAALIAN s.l.
HOLSTEINIAN
f l - f l u v i a l d e p o s it s f g - f l u v i o g l a c l a l - g l i - g l a c i l i m n i c
Fig. 1 Chronologic correlation of loess and glacigene deposits in Poland Some problems, however, remain unsolved, e.g. the long- lasting Warta unit (between 210 and 140 ka). Although at that time a few marginal belts were formed, especially in the Pod- lasie Plain, there are insufficient evidences of lithostrati- graphic classification in the recognized geological sections.
Paleontological evidences are also not strong enough to deter
mine the stratigraphic position of the time period just before the Warta unit. Thus, in an adequate column a question mark is inserted. It is also worthy of mention that according to the recent investigations a cool substage was separated from the Maximum Stadial (Substage) by the Zbójno unit (LINDNER, L.- BRYKCZYNSKA, E. 1980) which displays the characteristics of a warm interstadial (interglacial?).
STRATIGRAPHY AND CHRONOLOGY OF LOISSES
Stratigraphic and chronologic data concerning loesses derive from the studies by MARUSZCZAK, H. (1976, 1980, 1984, 1985, 1986) and their major part is shown in Fig. 1. It follows from
29
these data that during the last 400,000 years two interglacial resound appeared in the loess profiles in Poland, i.e. the older (330-300 ka BP) and the younger one (130-110 ka BP). Both of these are expressed by grey brown forest lessive soils which occur in loess profiles. Each soil bears particular, typological features and contains typical epigenetic periglacial (frost) structures which facilitate their recognition in the field. The features mentioned above are exemplified in the vicinity of Hru- bieszow in Eastern Poland (Fig. 2). These two soils divide the entire Polish loess profile into three parts which relate to three cold stages. The Oldest Loess (nomenclature after MARUSZ- CZAK, H.) corresponds to the Wilga Stage, and the Old and Young ones correspond to the Odra and Vistula stages, respectively, whereas the TL time intervals are 350-330 ka BP, 300-130 ka BP and 110-12 ka BP. In Old and Young Loess beds there are some sedimentary gaps caused by considerable decrease of the rate of loess deposition. MARUSZCZAK, H. has distinguished six such gaps in the Odranian loess (Old Loess). The third gap from the
Fig. 2 Fossil soils typology of Eemian and Mazovian age in loesses of Poland
E = Eemian; 0 - Odranian; M = Mazovian; V = Vistulian; A, A^.
B = genetic soil horizons
bottom (335-325 ka BP) is marked by a well-developed forest soil that possibly evidences the interglacial climate conditions of short duration. All the remaining soils enclosed in the Odra- nian loess are poorly developed (initial gley soils or cherno
zems) as these were formed during periods of a few thousand years.
There are three soils (initial subarctic brown soils and chernozems) distinguished in the Vistulian (Young) loess. These were formed in 80-75 ka BP, 42-37 ka BP and 32-28 ka BP inter
vals, respectively. The older one evidences a considerable warm
ing, whereas both of the younger soils evidence the complicated evolution of climate which preceded the maximum extent of an ice-sheet in Europe during the Late Vistulian. The above soils divide the Vistulian loess into four horizons which correspond to cool substages. Out of these substages only the last but one can be questioned because of the small thickness of its local loess bed.
CHRONOLOGIC CORRELATION OF GLACIGENE DEPOSITS AND LOESSES IN POLAND
A proposal of chronologic correlation of glacigene deposits and loesses in Poland is presented in Fig. 1.
As far as the subdivision is concerned the Oldest Loess corresponds to the Wilgian, and the Old and Young Loesses cor
respond to the Odranian and Vistulian, respectively. Each sub
stage has its equivalent also within the loess cover. In the Odranian a Pre-Maximum Substage of this stage with wel1-develop
ed till horizon (300-280 ka BP) is related to the Lowermost Old Loess (according to the terminology of MARUSZCZAK, H.) the age being estimated to 310/300-280/270 ka BP. The Maximum Sub
stage (Stadial) corresponds to the Lower Old Loess (280/270- 260/255 ka BP) and to the Middle Old Loess (255-230/225 ka BP) together with a poorly developed gley soil between them. At Nieledew an initial chernozem occurs in the place of this soil.
There are no data so far about an interstadial period in glaci
gene sections.
The Middle Old Loess (MARUSZCZAK, H. 1985) is not weathered and based on its typical development it can be distinguished from other Old L,oess horizons. Thus, it evidences the full de
velopment of periglacial conditions that predominated within a narrow extraglacial belt in front of the maximum limit of Odranian ice sheet.
Higher up there is a hiatus (235-225 ka BP) expressed by a forest soil. There are no reliable evidences in the glacial series concerning this period but in some sections the inter
stadial flora was recorded. In one of these sites, in the Lublin Upland, at Polichna village, the age of’ deposits was determined by means of the TL method. This particular site is situated in the marginal belt of all the Pleistocene glaciations and from its name the unit is called the Polichna Substage (accord
ing to the investigations carried out by LINDNER, L.--MARUSZCZAK, H.--W0JTAN0WICZ, J. 1985).
31