Apoplast acidification in growing barley (Hordeum vulgare L.) leaves
Tamás Visnovitz (‘Okleveles Biológus’; MSc)
The thesis is submitted to University College Dublin in fulfilment of the requirements for the degree of Doctor of Philosophy
School of Biology and Environmental Science Head of School: Prof. Thomas Bolger Principal Supervisor: Dr Wieland Fricke
Members of the Doctoral Studies Panel: Dr Paul McCabe & Prof. Bruce Osborne
August 2011
Contents
Contents __________________________________________________________________ ii List of figures ______________________________________________________________ v List of tables ______________________________________________________________viii Abstract __________________________________________________________________ x Statement of Original Authorship______________________________________________xi Collaborations ____________________________________________________________ xii Acknowledgements ________________________________________________________xiii 1 General Introduction __________________________________________________ - 1 - 1.1 Plant growth _________________________________________________________- 1 -
1.1.1 Plant cell expansion________________________________________________________ - 1 - 1.1.1.1 Cell wall ______________________________________________________________ - 1 - 1.1.1.2 Solutes _______________________________________________________________ - 3 - 1.1.1.3 Water ________________________________________________________________ - 4 - 1.1.2 pH conditions in the apoplast________________________________________________ - 4 - 1.1.3 ‘Acid growth’ theory ________________________________________________________ - 5 - 1.1.3.1 ‘Acid growth’ and effect of auxin and fusiccoccin on growth _____________________ - 5 - 1.1.3.2 Experimental systems using coleoptiles______________________________________ - 6 - 1.1.3.3 Acid growth of coleoptiles ________________________________________________ - 6 - 1.1.3.4 Acid growth of dicotyledonous leaves _______________________________________ - 8 - 1.1.3.5 Acid growth of roots ____________________________________________________ - 9 - 1.1.4 Potassium uptake and ‘acid growth’__________________________________________ - 10 - 1.2 Plasma membrane H+-ATPase________________________________________- 11 - 1.2.1 Isoforms of PM-H+-ATPase_________________________________________________ - 12 - 1.2.2 Structure of PM-H+-ATPase ________________________________________________ - 14 - 1.2.3 Catalytic cycle of P-type ATPase and H+ transport mechanism __________________ - 15 - 1.2.4 Control of PM-H+-ATPase__________________________________________________ - 15 - 1.2.5 Fusicoccin-dependent PM-H+-ATPase activation______________________________ - 17 - 1.3 Barley ______________________________________________________________- 18 - 1.3.1 The two weeks old barley seedlings and their advantage_______________________ - 18 - 1.3.1.1 Morphology of developing barley leaves____________________________________ - 19 - 1.3.1.2 Anatomy of developing barley leaf ________________________________________ - 20 - 1.3.2 Growth and potassium uptake of barley______________________________________ - 21 - 1.4 Technical approaches _______________________________________________- 22 - 1.5 Objectives of the present study_______________________________________- 23 -
2 Materials and Methods _______________________________________________ - 24 - 2.1 Plant material _______________________________________________________- 24 -
2.1.1 Plant growth for study of leaves_____________________________________________ - 24 - 2.1.2 Plant growth for study of coleoptiles _________________________________________ - 25 - 2.2 Apoplast pH measurements__________________________________________- 25 - 2.2.1 In-vitro gel system_________________________________________________________ - 26 - 2.2.2 Microelectrode measurements______________________________________________ - 27 - 2.3 Confocal microscopy ______________________________________________________ - 29 - 2.3 LVDT measurements_________________________________________________- 30 - 2.3.1 Leaf growth measurements_________________________________________________ - 30 - 2.3.2 Analysis of cell wall properties______________________________________________ - 31 -
2.4 Expression analyses_________________________________________________- 32 - 2.4.1 Plant harvest_____________________________________________________________ - 32 - 2.4.2 RNA extraction and cDNA synthesis_________________________________________ - 33 - 2.4.3 PCR_____________________________________________________________________ - 34 - 2.4.4 qPCR ___________________________________________________________________ - 36 - 2.4.5 Analysis of qPCR data_____________________________________________________ - 37 - 2.5 Cell size and tissue ratio measurements_______________________________- 38 - 2.5.1 Mesophyll and epidermis cell size___________________________________________ - 38 - 2.5.2 Tissue ratio calculation in elongation zone and emerged blade__________________ - 38 - 2.5.3 Cell size and plasma membrane surface estimation for qPCR analysis ___________ - 38 - 2.6 Plasma membrane isolation__________________________________________- 39 - 2.6.1 Plant harvest_____________________________________________________________ - 39 - 2.6.2 Preparation of microsomal fraction___________________________________________ - 39 - 2.6.3 Purification of plasma membrane vesicles____________________________________ - 40 - 2.7 Determination of the total protein content of plasma membrane vesicles - 41 - 2.7.1 Bradford method__________________________________________________________ - 41 - 2.7.2 Densitometric analysis of Laemmli gels ______________________________________ - 41 - 2.8 Polyacrylamide gel electrophoresis (PAGE) ___________________________- 42 - 2.8.1 Gradient polyacrylamide gel electrophoresis (PAGE)___________________________ - 42 - 2.8.1.1 Solubilisation of membrane protein ________________________________________ - 42 - 2.8.1.2 Gradient PAGE gel system ______________________________________________ - 43 - 2.8.2 Linear (12 %) PAGE_______________________________________________________ - 45 - 2.9 ATPase assay_______________________________________________________- 45 - 2.10 Approach for light microscopy _______________________________________- 46 - 2.10.1 Fixation of leaf tissue____________________________________________________ - 46 - 2.10.2 Dehydration and embedding _____________________________________________ - 46 - 2.10.3 Staining with toluidine blue_______________________________________________ - 47 - 2.11 Immunological methods for PM-H+-ATPase detection___________________- 48 - 2.11.1 Qualitative Western blot analysis__________________________________________ - 48 - 2.11.2 Quantitative Western blot analysis ________________________________________ - 49 - 2.11.3 Immunostaining of paraffin-embedded sections_____________________________ - 50 - 2.11.4 Densitometric analysis of Western blots ____________________________- 51 - 2.12 Protoplast experiments______________________________________________- 51 - 2.12.1 Protoplast isolation______________________________________________________ - 51 - 2.12.2 Purification of protoplasts________________________________________________ - 52 - 2.12.3 Calculation of size and surface of the protoplast_____________________________ - 52 - 2.13 Statistical analysis_____________________________________________________- 52 -
3 Results ____________________________________________________________ - 53 - 3.1 Apoplastic pH measurements ________________________________________- 53 -
3.1.1 In-vitro agarose gel system_________________________________________________ - 53 - 3.1.2 Microelectrode measurements______________________________________________ - 57 - 3.1.1 Confocal microscopy ______________________________________________________ - 60 - 3.2 LVDT analyses of growth responses to treatments_____________________- 65 - 3.2.1 Leaf elongation under different treatments____________________________________ - 65 - 3.2.2 Cell wall changes in response to treatments __________________________________ - 69 - 3.3 Expression analysis of PM-H+-ATPase using qPCR_____________________- 70 - 3.3.1 Quality control of the standard required for absolute qPCR______________________ - 71 - 3.3.2 Calculation of cell number and membrane surface_____________________________ - 72 - 3.3.3 Gene expression data based on absolute qPCR method________________________ - 74 - 3.4 PM-H+-ATPase activity and expression at protein level _________________- 77 - 3.4.1 Optimization of membrane isolation and ATPase assay ________________________ - 78 - 3.4.1.1 Plasma membrane isolation ______________________________________________ - 78 - 3.4.1.2 Determination of total protein content in plasma membrane vesicles ______________ - 79 -
3.4.1.3 ATPase assay _________________________________________________________ - 79 - 3.4.2 Quality of plasma membrane fractions _______________________________________ - 81 - 3.4.3 Quantitative analysis of PM-H+-ATPase protein _______________________________ - 82 - 3.4.4 Activity of PM-H+-ATPase__________________________________________________ - 83 - 3.4.5 Immunolocalisation of PM-H+-ATPase _______________________________________ - 83 -
4 Discussion _________________________________________________________ - 85 - 4.1 Growth-associated apoplast acidification______________________________- 85 -
4.1.1 Apoplast pH difference between growing and non-growing leaf tissue____________ - 85 - 4.1.2 Reliability of pH values measured in elongation zone and emerged blade_________ - 85 - 4.1.3 Relation between apoplast acidification and leaf growth ________________________ - 86 - 4.2 K+ and apoplast acidification_________________________________________- 87 - 4.2.1 Potassium uptake and leaf growth___________________________________________ - 87 - 4.2.2 High affinity potassium transporters and leaf growth____________________________ - 88 - 4.3 PM-H+-ATPase expression and leaf elongation_________________________- 89 - 4.3.1 PM-H+-ATPase density in plasma membrane and leaf growth___________________ - 90 - 4.3.2 qPCR data_______________________________________________________________ - 91 - 4.3.4 Immunolocalisation of PM-H+-ATPase _______________________________________ - 92 - 4.4 Leaf growth and changes in cell wall properties________________________- 92 - 4.5 ‘Acid growth’ in barley leaves?_______________________________________- 93 - 4.6 Model of leaf growth in barley ________________________________________- 93 -
5 Conclusions and future work __________________________________________ - 97 - 5.1 Conclusions ________________________________________________________- 97 - 5.2 Future works________________________________________________________- 98 -
6 Literature __________________________________________________________ - 99 - 7 Appendix _________________________________________________________ - 109 - 7.1 Processing of qPCR data____________________________________________- 109 - 7.2 List of chemicals___________________________________________________- 115 -
List of figures
Figure 1.1 Model how expansins might interact with other wall components ... - 3 -
Figure 1.2 Fusicoccin and auxin effect on maize coleoptiles... - 7 -
Figure 1.3 Root elongation growth rate (REGR) and apoplast pH changes ... - 9 -
Figure 1.4 Trajectory of a root element ... - 10 -
Figure 1.5 Potassium transport dependency of abraded maize coleoptiles ... - 11 -
Figure 1.6 Structure of AHA2 without auto-inhibitory domain ... - 14 -
Figure 1.7 Catalytic cycle and H+ transport of PM-H+-ATPase ... - 15 -
Figure 1.8 Auto-inhibition of PM-H+-ATPase ... - 17 -
Figure 1.9 14-3-3 protein-fusicoccin-PM-H+-ATPase complex ... - 18 -
Figure 1.10 Two-week old barley seedling ... - 20 -
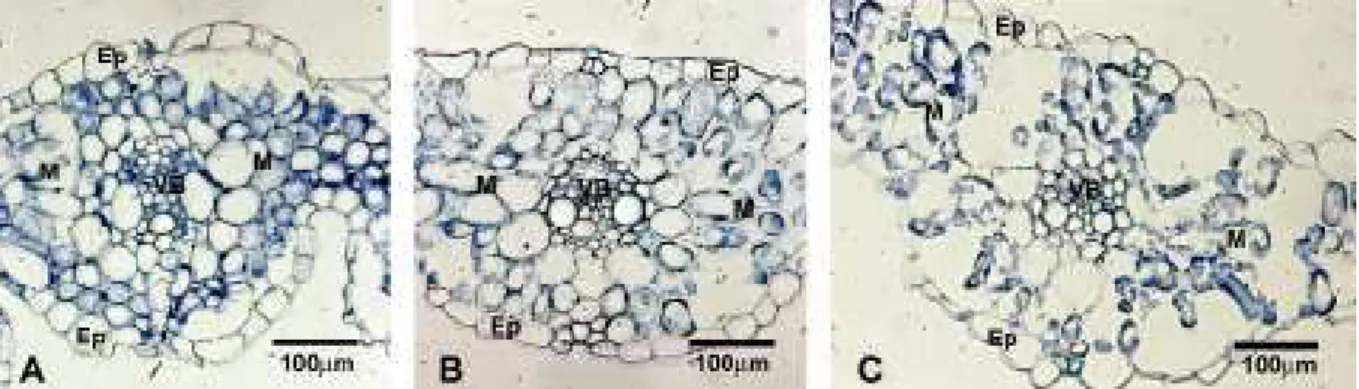
Figure 1.11 Toluidine blue stained cross section of barley leaves from different developmental stage ... - 21 -
Figure 2.1 Leaf pieces in pH sensitive agarose gel medium ... - 27 -
Figure 2.2 Measurement of cell wall properties ... - 32 -
Figure 2.3 Thermal profile of the two step PCR reactions ... - 35 -
Figure 2.4 Thermal profile of qPCR reactions ... - 36 -
Figure 2.5 Five purification steps during plasma membrane isolation. ... - 41 -
Figure 2.6 Typical gel for the measurement of protein content of plasma membrane samples... - 42 -
Figure 2.7 Coomassie Brilliant Blue R250 stained gradient PAGE gels which were loaded with plasma membrane protein solubilised in two different ways ... - 43 -
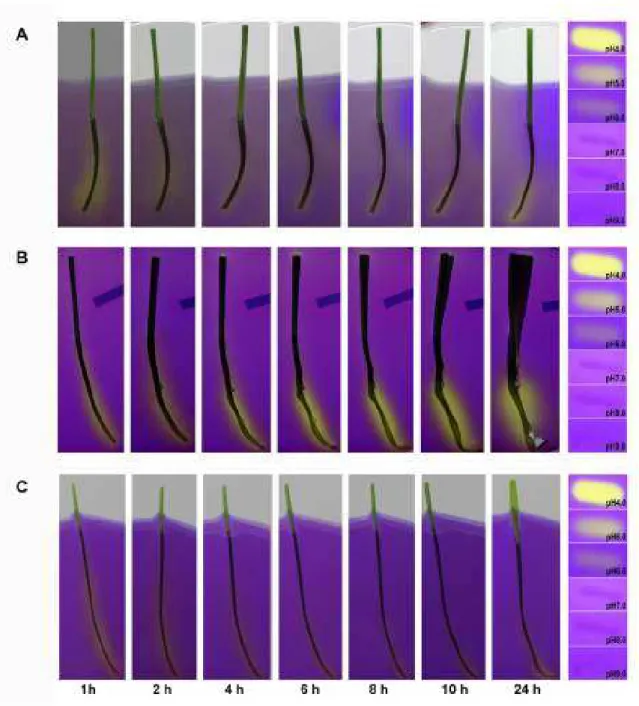
Figure 3.1 Leaf growth and apoplast acidification as analysed through the agarose gel system ... - 54 -
Figure 3.2 Time course of growth and acidification of in-vitro gel experiments .... - 55 -
Figure 3.3 Leaf growth and acidification in agarose gel under cold treatment... - 55 -
Figure 3.4 Average rate of leaf elongation (A) and medium acidification (B) in leaves exposed to fusicoccin, vanadate and caesium treatments as tested through the agarose gel system ... - 56 -
Figure 3.5 Effect of auxin on leaf growth and medium acidification using the in-vitro gel system ... - 57 -
Figure 3.6 Growth effect of auxin when applied in liquid medium... - 57 -
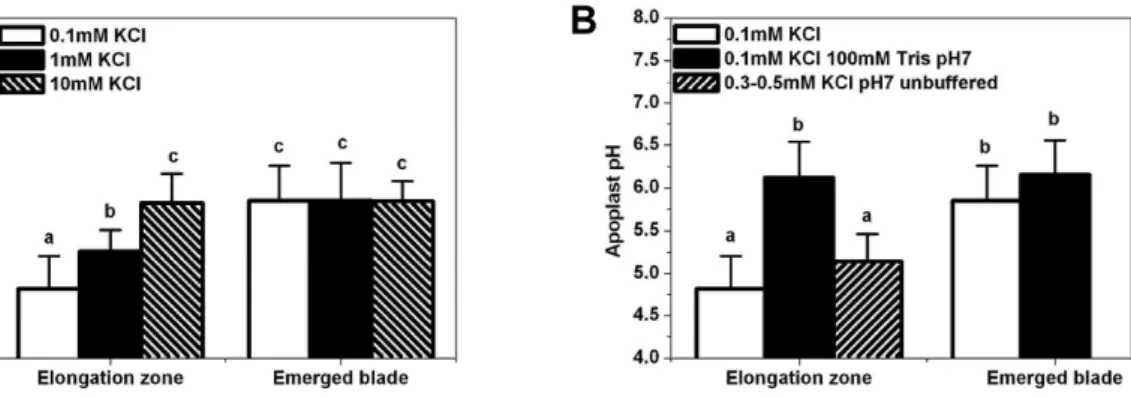
Figure 3.7 Microelectrode analyses of apoplast pH in the elongation zone and emerged blade-portion of leaf three of barley... - 58 -
Figure 3.8 Growth rate of leaf three in response to K+-treatments during micro pH measurements. ... - 59 - Figure 3.9 Microelectrode pH analyses in the leaf elongation zone of barley in
response to sodium orthovanadate and fusicoccin treatments... - 60 - Figure 3.10 Growth rate of leaf three of barley in response to vanadate and
fusicoccin treatments as analysed through different approaches... - 60 - Figure 3.11 Confocal microscopic analysis of apoplastic pH using acridine orange
fluoresce pH sensitive fluorescence dye ... - 62 - Figure 3.12 Confocal microscopic analysis of apoplastic pH using
5(6)carboxyfluorescein fluoresce pH sensitive fluorescence dye ... - 63 - Figure 3.13 Carboxyfluorescein and acridine orange accumulation pattern in
elongation zone and emerged blade ... - 64 - Figure 3.14 Effect of pH sensitive dyes on leaf growth rate ... - 64 - Figure 3.15 pH sensitivity of fluorochromes ... - 65 - Figure 3.16 Testing the responsiveness of the LVDT setup to treatments which were
expected to increase (37 °C) or stop growth (1 M Na Cl) ... - 66 - Figure 3.17 The effect of test reagents in the apoplastic bathing medium on leaf
growth as measured with the LVDT setup... - 67 - Figure 3.18 Potassium dependency of the leaf growth response to fusicoccin (5 µM)
and vanadate (500 µM) ... - 68 - Figure 3.19 Auxin effect on leaf elongation growth... - 68 - Figure 3.20 Cell wall changes under different treatments ... - 69 - Figure 3.21 Growth rate before and in response to an additional applied force ... - 70 - Figure 3.22 reference genes for qPCR experiments ... - 71 - Figure 3.23 Digital PCR pattern of external standard DNA ... - 72 - Figure 3.24 Representative cross sections used for determination of the contribution
of different tissues and air space to total leaf volume... - 73 - Figure 3.25 Expression of PM-H+-ATPase using absolute qPCR... - 75 - Figure 3.26 PM-H+-ATPase expression using absolute qPCR and relating expression data to total plasma membrane surface area ... - 76 - Figure 3.27 Comparison of molecular biological data using leaf tissues or mesophyll
protoplasts... - 77 - Figure 3.28 Impact on the quality of PAGE separation of washing steps during
plasma membrane isolation ... - 78 -
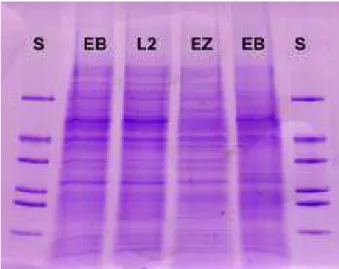
Figure 3.29 Protein measurement in plasma membrane vesicles using two different methods ... - 79 - Figure 3.30 Typical ATPase assay... - 80 - Figure 3.31 Kinetics of Pi detection assay ... - 80 - Figure 3.32 Coomassie stained SDS polyacrylamide gel and Western blot of plasma
membrane proteins from different leaf regions... - 81 - Figure 3.33 PM-H+-ATPase ratio in total membrane protein ... - 82 - Figure 3.34 ATPase activity of inside-out plasma membrane vesicles... - 83 - Figure 3.35 PM-H+-ATPase immunolocalisation on leaf cross and longitudinal
sections ... - 84 - Figure 4.1 Supposed effect of the treatments on barley leaf cells ... - 95 - Figure 4.2 Model of leaf elongation in barley leaves ... - 96 - Figure 7.1 Typical calibration curve for converting Ct values into transcript copy
number ... - 110 -
List of tables
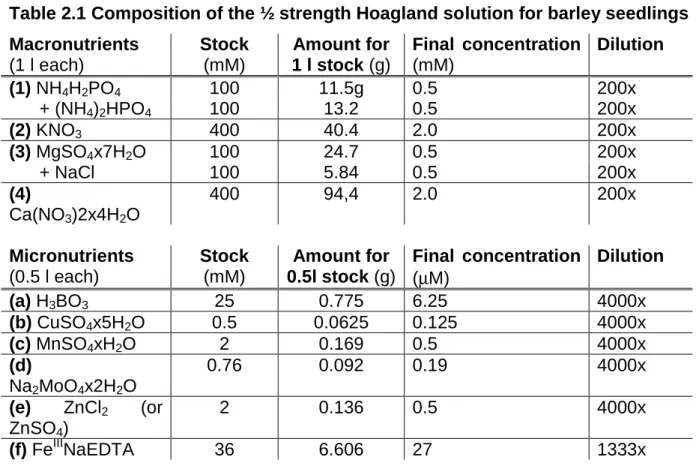
Table 1.1 Localisation of specific PM-H+-ATPase isoforms in plant body - 13 - Table 2.1 Composition of the ½ strength Hoagland solution for barley seedlings - 25 - Table 2.2 Composition of the pH sensor for microelectrodes - 28 - Table 2.3 Composition of the buffer solutions used for calibrating pH
microelectrodes - 29 -
Table 2.4 DNase treatment and reverse transcription - 34 -
Table 2.5 Components of PCR reactions - 35 -
Table 2.6 PCR primers - 35 -
Table 2.7 Composition of the stock solution (5x concentrated) of TRIS base
boric acid EDTA buffer (TBA) - 35 -
Table 2.8 Components of qPCR reaction - 36 -
Table 2.9 Composition of the homogenisation buffer used for membrane
isolation - 39 -
Table 2.10 Composition of the phase buffer used for membrane isolation - 40 - Table 2.11 Composition of the resuspension buffer used for membrane
isolation - 40 -
Table 2.12 Composition of Bradford reagent - 41 -
Table 2.13 Composition of Laemmli buffer used for PAGE - 43 - Table 2.14 Components of the gradient PAGE system - 44 - Table 2.15 Components of the solutions for Coomassie Brilliant Blue gel
staining - 44 -
Table 2.16 ATPase reaction buffer and colour development reagent - 46 - Table 2.17 Fixation and embedding of leaf samples for immunohistochemistry - 47 - Table 2.18 Staining embedded leaf sections with toluidine blue - 47 - Table 2.19 Composition of blotting buffer used for Western analyses - 48 - Table 2.20 Composition of TRIS buffer saline buffer (TBS) - 49 - Table 2.21 Composition of Tween®20 TRIS buffer saline buffer (TTBS) - 49 - Table 2.22 Protocol for immunostaining of embedded leaf sections - 50 - Table 2.23 Composition of phosphate buffer saline (PBS; pH 7.4) - 50 - Table 2.24 Composition of protoplast isolation buffer - 51 - Table 2.25 Enzyme concentrations in protoplast isolation buffer - 51 - Table 3.1 Water content of two different regions of leaf three in two cultivars of
barley - 72 -
Table 3.2 The contribution of different tissues to total leaf volume in the
elongation zone (EZ) and emerged blade (EB) of leaf three of barley. - 73 - Table 3.3 Cell size calculation based on the present and literature data. - 74 -
Table 3.4 Ct values of PM-H+-ATPase expression together with RNA content per cell in the elongation zone (EZ) and emerged blade (EB) of leaf three
of barley. - 75 -
Table 3.5 RNA content and PM-H+-ATPase expression in the elongation zone
(EZ) and emerged blade (EB) of leaf three of barley (Golf, Jersey). - 76 - Table 4.1 Summary of data for PM-H+-ATPase when related to surface area of
plasma membrane. - 89 -
Table 7.1 Example for qPCR calculation of Golf cultivar. -112- Table 7.2 Example for qPCR calculation of Jersey cultivar. -113- Table 7.3 Example for qPCR calculation of Jersey protoplasts. -114-
Abstract
Apoplast acidification associated with growth is well-documented in roots, coleoptiles and internodes but not in leaves. In the present project on barley (Hordeum vulgare L.) advantage was taken of the high cuticle permeability in the elongation zone of leaves to measure apoplast pH and growth in response to application of test reagents. The role of the plasma membrane H+-ATPase (PM-H+-ATPase) and K+ in this process was of particular interest. An in vitro gel system with bromocresol purple as pH indicator, pH microelectrodes and pH-sensitive fluorescence dye combined with confocal microscopy were used to monitor apoplast pH. Growth was measured in parallel or in separate experiments using a linear variable differential transformer (LVDT). Test reagents which blocked (vanadate) or stimulated (fusicoccin) PM-H+-ATPase, or which reduced (NH4+
, Cs+, tetraethylammonium) K+ uptake were applied. Plasma membranes were isolated from growing and mature leaf tissue and used to determine the activity (ATPase assay) and abundance (Western blotting) of PM-H+-ATPase protein. Protein localisation was studied by immunohistochemistry and expression of mRNA quantified using real time PCR (qPCR). Apoplast pH was by up to 1.0 pH unit lower in growing compared to non- growing leaf tissue. Depending on the K+ concentration in the bathing medium used during electrophysiological analyses, apoplast pH in the elongation zone ranged from pH 4.8 (0.1 mM K+) to pH 5.8 (10 mM K+). In the emerged blade, apoplast pH remained at about pH 5.8 irrespective of the K+ concentration in the bathing medium Growth was more responsive to test reagents than to changes in apoplast pH. Expression of PM-H+- ATPase was comparable between growing and non-growing leaf regions when expression was related to per unit extracted RNA or cell number. However, when expression was related to per unit surface area of plasma membrane, expression of PM-H+-ATPase was about twice as high in growing compared to non-growing leaf tissue. The same applied to the protein level and activity of PM-H+-ATPase.
Immunohistochemical analyses showed that PM-H+-ATPase was present in all living leaf tissues, particular in those (guard cells, phloem, and xylem parenchyma) associated with high rates of trans-membrane solute transport. It is concluded that leaf cell expansion in barley depends on the activity of the PM-H+-ATPase and K+ transport processes. The higher surface density of PM-H+-ATPase activity in growing barley leaf tissue aids apoplast acidification and growth. A H+ / K+ co-transport system may play a key role in linking growth with apoplast pH, H+ pump activity and K+-uptake.
Statement of Original Authorship
I hereby certify that the submitted work is my own work, was completed while registered as candidate for the degree of Doctor of Philosophy, and I have not obtained a degree elsewhere on the basis of the research presented in this submitted work.
………
Tamás Visnovitz
Collaborations
(i) pH measurements using pH microelectrodes were carried out under the supervision of Dr Anthony J. Miller at the Department of Plant Pathology and Microbiology of Rothamsted Research (Harpenden, Hertfordshire AL5 2JQ, UK).
Towards the end of this project, Dr Miller moved to the John Innes Centre (Norwich Research Park, Colney, Norwich, NR4 7UH, UK), which is similar to Rothamsted Research a BBSRC (Biotechnology and Biological Sciences Research Council) funded institute.
(ii) Plasma membrane isolation, SDS PAGE, ATPase hydrolysis assays and part of the Western blot analysis was carried out in the laboratory of Dr Éva Sárvári and Dr Ilona Rácz with the help of Ádám Solti at the Department of Plant Physiology and Molecular Plant Biology, Institute of Biology, Faculty of Science, Eötvös Loránd University (Pázmány Péter sétány 1/C, Budapest, Hungary, H1117).
Acknowledgements
• First of all I want to thank my supervisor Dr Wieland Fricke for his expert guidance and advice in all aspect during the three years. He not just guided my steps in science, he gave the opportunity to plan my research workflow, experiments and test my own ideas.
• I would like to thank the help to everybody who worked with me in our research group Matthieu Besse, Thorsten Knipfer, Mostefa Touati, Ehsan Bijanzadeh and Shimi Suku who helped me a lot and we could spend great time in the lab together.
• Many thanks for the technical assistance and help to Brendan, Eugen, Francis, Gwyneth, Eileen (UCD), Sue (Rothamsted), Györgyi and Zsuzsa (ELTE). Damian Egan and Eric Callaghan helped me especially a lot, and special thanks to Eric for his critical reading of the thesis.
• I would like to thank Prof. Jeremy C. Simpson for access to the confocal microscopy unit and Dr Gavin Stewart and Caragh Walpole for their help with Western blotting at UCD.
• I never will forget the days in Rothamsted, thanks a million for Dr Tony Miller for his help in all aspect and I hope I will have the chance to work together in the future.
• At Eötvös University I had extremely big help from Dr Éva Sárvári, Dr Ilona Rácz, Dr Szabolcs Rudnóy and from Prof. Zoltán Szigeti. Without the guides of
Ádám Solti the protein part of the work would not have been successful.
Dr György Csikós helped a lot in immune histochemistry.
• Enormous thanks for my wife Kriszti. Without her help I would not able to finish this research and thesis. She was always with me when I was despondent and felt that I never will finish.
• Thank to all of my friends at UCD, Rothamsted and ELTE whose are not mentioned by name.
• Particular thanks to IRCSET (Irish Research Council for Science, Engineering and Technology) which made this PhD project possible through awarding me an EMBARK post-graduate fellowship.
• …és végül de nem utolsó sorban köszönöm a támogatást szüleimnek akik támogattak mindenben és elviselték, hogy Írországban éltem és doktoráltam.
1 General Introduction
1.1 Plant growth
Plant growth can be defined as an irreversible increase in the size of cells, tissues, organs or whole plants (Csiszár et al., 2004). Cell expansion is generally considered to be caused by wall loosening and driven by turgor pressure (Christian et al., 2006).
The term ‘cell growth’ mainly refers to the increase in size of proliferating cells in the cell cycle (meristematic cells), with increase in the total nucleic acid and protein content without vacuolization of the protoplast. In contrast, the term ‘cell expansion’
refers to the manifold increase in size of newly produced cells that is associated with the formation of a large central vacuole and finally leads to cell differentiation (Perrot- Rechenmann, 2010). While plants need to produce new cells to grow, it is cell expansion which leads to the physical increase in plant size and biomass.
1.1.1 Plant cell expansion
The enlargement of cells reflects increase in water content of cells. Irreversibility of this process is guaranteed by the plastic properties of the cell wall. From the biophysical view, plant cells need a wall which gives in to turgor pressure (mechanical driving force) and solutes which drive water uptake through osmosis.
Therefore, cell expansion may be limited by the mechanical (yielding and extensibility) properties of the cell wall and the rate at which water and solutes are taken up or produced (solutes) by cells internally (Fricke & Flowers, 1998; Fricke &
Peters, 2002).
1.1.1.1 Cell wall
It is a popular theory that expansion of leaf and root cells is controlled by cell wall properties. Based on the work of Green et al. (1971) on giant algae cells (Nitella sp.) and Lockhart’s (1965) theoretical considerations, a growth model was developed which relates the growth rate (GR) to extensibility properties (m), yield threshold of cell wall where no cell expansion occurs (Y) and cell turgor (P):
GR = m · (P-Y)
The impact of the mechanical properties of the cell wall for plant growth was found in many studies both in roots and shoots (Cosgrove, 1993; Pritchard, 1994; Cosgrove,
1998; Hsiao & Xu, 2000). The implication of these studies is that the rate of cell expansion, and therefore plant growth, may be regulated by altering the mechanical properties of the wall, making it ‘softer’ (more growth) or ‘harder’ (less growth). One way to alter wall properties is through changes in wall (apoplast) pH.
Acidification can affect growth through cell wall loosening (Rayle & Cleland, 1970) and different theories have been proposed to explain this phenomenon. One hypothesis suggested that H+ directly affects non-covalent bonds between β-glucan within the cell wall, causing wall loosening (Hohl et al., 1991). Another hypothesis suggested that due to H+ excretion Ca2+ ions are displaced in the cell wall and that this leads to a more flexible cell wall (Arif & Newman, 1993). A breakthrough in our understanding of pH-related wall loosening came in 1992 when two proteins were extracted from cucumber hypocotyls which were capable of inducing extension in isolated, heat-inactivated cell walls of several plant species. These ‘wall loosening’
proteins were termed ‘expansins’. The pH optimum of these proteins was pH3.5 - 4.5 (McQueen-Mason et al., 1992) and this may explain at least in part why apoplast acidification increases the growth rate of plant organs.
Expansins are specifically expressed in growing tissues of monocotyledons and dicotyledonous plants. They are highly conserved in size and amino acid sequence (Cosgrove, 1996). However, studies on fescue suggest that another group of wall proteins, xyloglucan endotransglycosylases, may be more involved in regulation of cell expansion than expansins (Reidy et al., 2001).
Expansins do not induce wall extension through simple polymer hydrolysis.
They mainly disrupt hydrogen bonding not just in-vivo, in a paper sheet as well and reengineering the cell wall structure facilitating plant growth (McQueen-Mason, 1995). Promoting cell wall relaxation is necessary for expansion of plant cells (Cosgrove, 1993). An overview of expansin action is given in Fig. 1.1.
Figure 1.1 Model how expansins might interact with other wall components Expansins might cause a transient release of short segments of matrix hemicelluloses glycans attached to cellulose microfibrils. Wall hydrolyses cut matrix glucans into shorter segments leading to weakening but not to creep of the cell wall.
Transglycosylases are recombining glycans into shorter or longer pieces. PM-H+- ATPases may lower the wall pH and control enzymes by their pH optima. Reprint from Cosgrove (1998) based on open access policy of www.plantphysiology.org with copyright American Society of Plant Biologists.
1.1.1.2 Solutes
Based on the original growth model described above (Lockhart, 1965; Green et al., 1971), turgor pressure and solute uptake should have significant impact on cell expansion and growth. The availability of solutes seems to co-limit growth especially under water (Frensch, 1997; Hsiao et al., 1998) and salt stress (Fricke & Peters, 2002).
Osmolality and turgor pressure change little along the elongation zone of cereal leaves (Fricke et al., 1997; Fricke & Flowers, 1998; Martre et al., 1999; Fricke, 2002a) and roots (Pritchard, 1994). The implication of a constant turgor pressure in expanding cells might be that cells instantly deposit solutes to maintain osmolality as the osmotic force driving water uptake while they expand and cell contents become diluted (Fricke, 2002a).
1.1.1.3 Water
In barley, it has been suggested that the rate of tissue-water transport might limit cell expansion in leaves (Fricke, 2002b). Similar conclusions have been made for soybean hypocotyls and maize leaves by the work of Boyer and colleagues who coined the term ‘growth-induced water potentials’ (Boyer, 2001; Tang & Boyer 2008).
The mere existance of significant gradients in water potential between growing tissue and water source suggests that the conductance of the pathway between the two is limiting water transport. In a multi-layered tissue e.g. in roots, the radial hydraulic conductance can be one to three orders of magnitude larger under transpirating than under non-transpirating conditions (Steudle, 2000). Recent studies showed that in barley roots water uptake occurred along a pathway which involved crossing of membranes. It was not clear whether osmotic forces were sufficient to support water uptake (Knipfer & Fricke, 2011). Aquaporins have an essential role in the water transport at cellular level (Hachez et al. 2008). Aquaporins also may play essential role in elongation growth of barley leaves (Besse at al., 2011).
1.1.2 pH conditions in the apoplast
The present analyses did not, or did little distinguish between cell wall space and apoplast. The latter also comprises intercellular spaces and middle lamellae.
Therefore, and for simplicity, it is referred to ‘apoplast’ throughout the present work.
The apoplast of higher plants occupies typically 5 % or less of the total tissue volume. This applies in particular to living tissues. The apoplast determines ionic conditions around the cells; it affects transport solutes into and out of cells, provides a diffusion barrier in speciliased cases (e.g. Casparian bands) and defines mechanical and osmotic conditions – conditions which may be or may not be compatible with cell expansion. The latter applies in particular to the pH of the apoplast. Using different methods (pH indicators in agar, microelectrodes and fluorescence probes) a huge variety in apoplast pH has been reported for roots of different plant species. Values ranged from pH 4.0 to pH 7.0 with most values being in the region pH 5.0 to pH 6.5 (Grignon & Sentenac, 1991). Dicotyledonous plants have generally a higher (less acidic) pH than monocotyledonous plants have, and apoplast pH is lower in gymno- compared to angiosperms (Grignon & Sentenac, 1991).
In fully developed barley leaves an apoplast pH of pH 5.0 was measured using microelectrodes (Felle, 2006). The pH varied in dependence of oxygen availability
(anoxia) (Felle, 2005; Felle et al., 2005; Felle, 2006). Similar pH values have been reported for maize leaves using microelectrodes and fluorescence probes (Pitann et al., 2009a; Ehlert et al., 2011).
1.1.3 ‘Acid growth’ theory
‘Acid growth’ originally was discovered by Bonner in 1934 when he described that the growth rate of Avena coleoptiles in pH 4.1 buffer was significantly higher than in pH 7.2 buffer (Kutschera, 1994). Later this effect was re-discovered and characterised in more detail by Rayle & Cleland (1970) and Hager et al., (1971). Although in the literature ‘acid growth’ is mainly mentioned in relation to growth effects caused by the phytohormone auxin and the fungal toxin fusicoccin, which permanently activates PM-H+-ATPase, linked plant growth, acid growth is a more general phenomenon and can be induced by other factors (Vesper & Evans, 1979). In ‘acid growth’, acid related cell ‘wall-loosening’ may constitute the initial event (Rayle & Cleland, 1970;
Cosgrove, 1993). During the past decades, the ‘acid growth’ theory, or parts of the underlying mechanistic model, has been questioned repeatedly (Kutschera &
Schopfer, 1985a; Kutschera, 1994; Grebe, 2005), However, with some limitation it is
‘alive and well’ (Lüthen et al., 1990; Hager et al., 1991; Rayle & Cleland, 1992;
Kutschera, 2006). An alternative theory for ‘acid growth’ is the ‘facilitated solute uptake’ theory. This theory states that it is not the secreted H+ which are causing directly the increased growth rate through alteration of wall properties, but that a proton-coupled transport mechanism across the plasma membrane is stimulated (Brummer et al., 1984).
1.1.3.1 ‘Acid growth’ and effect of auxin and fusiccoccin on growth
Almost at the same time, Darwin and Sachs proposed the theory that growth and development of plants is controlled by hormones (Darwin, 1880; Kutschera 1994).
Using Avena sativa coleoptiles, Darwin, in 1880, showed that coleoptiles were bending towards the light source and once the tip of the coleoptiles was covered or cut, the coleoptiles were unable to produce this bending effect. In 1909, Fitting showed that coleoptile bending was a result of the non-homogeneous distribution of some factor, possibly a hormone (Katsumi, 2007). With gelatine cubes and glass pieces Boysen-Jensen (1913) proofed that this factor was transported from the tip to basal end of the coleoptile (Csiszár et al., 2004). Paál (1918) could induce coleoptile bending without light, changing the orientation of coleotile tips (Paál, 1918; Csiszár et
al., 2004). Finally, in 1937, Went discovered the hormone (auxin) and showed that if the hormone was in gelatine cubes the tip was not necessary for coleoptile bending (Kutschera 1994). Heyn in 1940 proposed that auxin (in its physiological form indol acetic acid - IAA) promotes growth by enhancing cell wall extensibility. In 1934 and 1970 the ‘acid growth’ theory was born to explain auxin related plant growth (Kutschera, 1994). Fusicoccin, a phytotoxin of the fungus Fusicoccum amygdale, was discovered as ‘super-auxin’ a few years latter (Marré, 1979) and is still used today in many plant growth studies.
1.1.3.2 Experimental systems using coleoptiles
Coleoptiles of monocotyledon plants have widely been used as a model system to study plant growth. Coleptiles can be obtained on plants which need to grow for only a few days, are well characterised in terms of their phototropic or gravitropic response, show defined regions of growth and auxin production, are simple in anatomy and are easy to handle and cut. The main disadvantage, however, of coleoptiles is that their cuticle provides a permeance barrier to applied test reagents and diffusion barrier for protons and that this causes difficulties for applying treatments and measuring apoplastic pH (changes). In different laboratories this problem has been solved in different ways by peeling off part of the outer epidermis (Rayle, 1973), abrasion of coleoptiles with wet emery cloth prior to cutting (Kutschera
& Schopfer, 1985a), abrasion with distilled water and SiC powder (Lüthen et al., 1990) or using dry polishing cloth for abrasion of coleoptiles before excision of segments (Schopfer, 1989). None of these methods were free from artefacts;
however the results have been informative.
In most experiments, the incubation medium in which pH measurements were conducted was slightly buffered to prevent pH changes as a result of changes in CO2
content of the atmosphere e.g. Rayle (1973); Stahlberg & Van Volkenburgh (1999) and Felle (2006). At the same time, the buffer capacity of the medium may affect pH measurements. Probably the best system for pH measurement was the method of ionostat (Döring et al., 1996), because the incubation medium was not buffered and changes in H+ efflux were measured rather than pH.
1.1.3.3 Acid growth of coleoptiles
Using maize coleoptiles, which were SiC-abraded in water and analysed using a computer controlled pH stat, both auxin and fusicoccin treatments affected growth in
a way which supported the ‘acid growth’ theory (Fig. 1.2). Neutral and alkaline solutions partly inhibited auxin- and fusicoccin-induced growth, whereas fusicoccin- induced growth under constant pH conditions. Fusicoccin and auxin did not show any additive effect (Lüthen et al., 1990). Cell wall pH and growth rate were in close temporal correlation indicating co-regulation of apoplast solute composition (Peters et al., 1998).
Figure 1.2 Fusicoccin and auxin effect on maize coleoptiles
Typical trace of fusicoccin (A) and auxin (IAA) effect (B). Dots represent the proton secretion while asterisks the coleoptiles growth rate. Experiments were carried out using SiC abraded maize coleoptile segments and a pH stat to maintain pH. Reprint from Lüthen et al. (1990) based on open access policy of www.plantphysiology.org with copyright American Society of Plant Biologists.
Other studies suggested that fusicoccin, but not auxin, caused ‘acid growth’.
Using the wet emery cloth abrading technique and buffered incubation medium, fusicoccin-induced growth was totally inhibited by alkaline solutions (Kutschera &
Schopfer, 1985b) while auxin-induced growth was not affected (Kutschera &
Schopfer, 1985a). The difference between these and the above-mentioned results might have been caused by the experimental set ups. The abrading technique was different and the solution was buffered in case of Kutschera & Schopfer (1985ab), while Lüthen at al. (1990) could use unbuffered solutions. Difference in cation composition might have impacted too, with 10 mM KCl and 1 mM Ca2+ used by Lüthen et al. 1990), while Kutschera & Schopfer (1985ab) used Ca2+ in the incubation medium and K+ at minimal concentrations (discussed in Lüthen et al., 1990).
It is possible that extension growth of multi-tissue organs such as roots, coleoptiles and leaves is limited mechanically by the extension of one component tissue. This idea, which dates back to the 19th century (Kutschera, 1994), is proposed in particular for the epidermis of round, compact organs (containing little intercellular
air space) such as hypocotyls and coleoptiles. Therfore the wall of the epidermis may be important for growth, and it is possible that ‘acid growth’ may occur in all tissues of an organ or only in the epidermis or in all tissue but the epidermis. This could explain discrepancies in results obtained between researchers and for different organs and species. Peeling off just part of the epidermis of coleoptiles might cause immediately changes in growth conditions but also experimental artefacts (Kutschera, 1994). It was assumed that fusicoccin may interact with proton pumps of inner coleoptile tissues whereas auxin affects H+ secretion of epidermal cells. Peeling off the epidermis caused 80 % less proton excretion of coleoptiles compared when coleoptiles were abraded with wet emery cloth (Kutschera et al., 1987). These results are supported by immunolocalisation results. Fusicoccin sensitive plasma membrane H+-ATPase (PM-H+-ATPase) proton pumps were found mainly in mesophyll cells rather than in the epidermis (Villalba et al., 1991); other authors, using electrophysiology, showed that auxin-induced H+ pump activity did not depend on the presence of epidermal cells in maize coleoptiles (Peters et al., 1992).
1.1.3.4 Acid growth of dicotyledonous leaves
The ‘acid growth’ theory has been tested much less in detail on dicotyledonous compared to monocotyledonous plants (coleoptiles) and the results in the literature are in part confusing. The validity of the acid growth theory appears to depend on the species tested. Light-induced leaf expansion of bean (Phaseolus vulgaris) and silver birch (Betula pendula) clearly showed an ‘acid growth’ type response. Apoplast pH decreased within 5 - 15 min of illumination, parallel to an increase in growth.
Exogenous acidic buffer induced loosening of the cell wall and stimulated leaf growth whereas buffer at neutral pH inhibited growth. Fusicoccin stimulated both leaf growth and apoplast acidification (Van Volkenburgh & Cleland, 1980; Taylor & Davies, 1985;
Cosgrove, 1996). In contrast, leaf expansion of sycamore (Acer pseudoplatanus) and tobacco (Nicotiana tabacum) could not be explained through ‘acid growth’. Apoplast acidification was not related to auxin-induced growth, yet fusicoccin-related ‘acid growth’ was present in tobacco leaves and independently of any auxin effect (Taylor
& Davies, 1985; Keller & Van Volkenburgh, 1998). Growth related acidification in dicotyledonous leaves seems controlled by light and follows a partially independent pathway from photosynthesis as experiments with pea (Pisum sativum) leaves showed (Stahlberg & Van Volkenburgh, 1999). In tobacco leaves, some mechanistic link between light-stimulated leaf growth, H+ excretion and K+ uptake (Stiles et al.,
2003; Stiles & Van Volkenburgh, 2004) was observed. The role of K+ could be to provide electrical counterbalance of H+ rather than to provide an osmolyte for uptake (Stiles & Van Volkenburgh, 2004).
1.1.3.5 Acid growth of roots
Early results suggested auxin linked ‘acid growth’ in roots (Moloney et al., 1981).
However, more recent data showed that auxin increased growth of shoot and coleoptiles yet equally rapidly inhibited root growth (Christian et al., 2006). Positive
‘acid (pH 4.0) growth’ has been not recorded in root elongation and at pH 3.5 organ elongation is reduced (Kutschera, 2006). In contrast with these results correlation was found between cell wall acidity and root elongation. Fusicoccin-induced H+ efflux and growth rate of maize roots rather than auxin that reduced both H+ efflux and root elongation (Lüthen & Böttger, 1988).
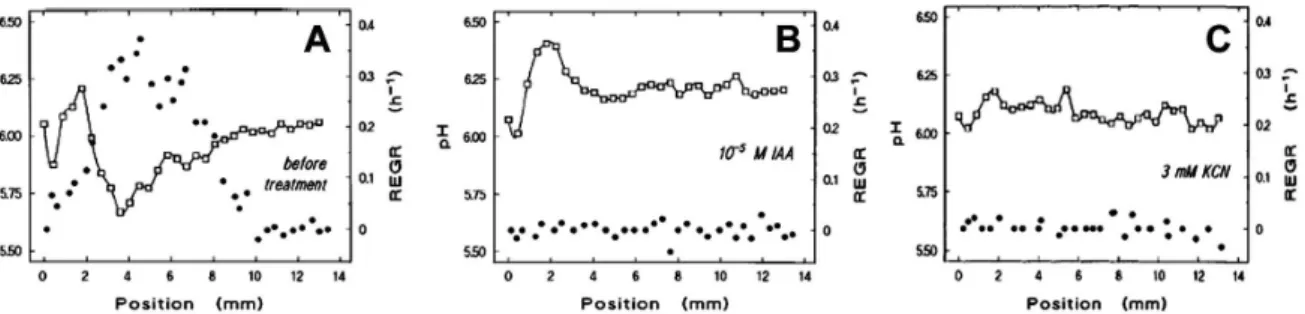
Using pH microelectrodes in the elongation zone of 4 day old maize primary roots a lower pH was recorded than in the non-growing zone when the pH was higher than pH 5.0 of the incubation medium (Fig. 1.3 and Fig. 1.4). Relative elemental growth rate and surface acidity were eliminated by auxin and cyanide treatments, respectively (Fig. 1.3) (Peters & Felle, 1999; Peters, 2004).
Figure 1.3 Root elongation growth rate (REGR) and apoplast pH changes Profile of surface pH () and REGR () along the apical 12 mm of a growing maize root measured in pH 6.75 medium (A) and after 10 µM IAA treatment (B) or 3 mM KCN treatment (C). Position 0 refers to the tip of the root cap. Reprint from Peters &
Felle (1999) based on open access policy of www.plantphysiology.org with copyright American Society of Plant Biologists.
Figure 1.4 Trajectory of a root element
The figure shows the relation of the parameter time, position on the root, relative elemental growth rate (REGR) and surface pH (colour-coded) in growing maize root.
The element considered is located at 0.2 mm above root apex at 0 time point. Reprint from Peters (2004) with the permission of the publisher (Licence No:
2693010825600, ’John Wiley and Sons’)
Amtmann et al., (1999) using different experimental systems had similar results on barley roots. They found that H+ excretion could have crucial role in activation of inward K+ channels. Changes in cytosolic pH and K+ might be significant factors which contribute to the root growth response to changes in K+ supply.
1.1.4 Potassium uptake and ‘acid growth’
Potassium is the main inorganic solute used by most plant cells to generate osmotic pressure. Its cytosolic concentration is tightly regulated. Therefore, one would expect that changes in the PM-H+-ATPase pump activity affect growth not only through changes in wall properties, but also through changes in K+ uptake. Recent data show that ‘acid growth’ and K+ uptake are related processes. Auxin and fusicoccin-induced growth was not present in absence of K+ (Claussen et al., 1997; Tode & Lüthen, 2001).
Claussen et al. in 1997 observed for abraded maize coleoptiles that auxin- induced growth and K+ uptake were related processes. For auxin-induced growth the K+ concentration in the medium was essential. In absence of K+ an effect of auxin on growth was not observed, whereas when K+ was added to the medium, auxin-related growth was immediately measured. The K+ channel blocker triethylammonium (TEA)
also suppressed the growth response to auxin, and when the blocker was removed, growth recovered as shown in Fig. 1.5 (Claussen et al., 1997). In a related study, a similar K+-dependency was observed for fusicoccin-induced growth (Tode & Lüthen, 2001).
Figure 1.5 Potassium transport dependency of abraded maize coleoptiles Potassium dependency of growth of coleoptiles was tested using a medium which contained 10 mM K+ or no added K+ (A). TEA, a K+ channel blocker, inhibited auxin- induced growth; the blockage was completely reversible (B). When TEA was removed and replaced by incubation medium containing 10 mM K+ and NAA, the growth rate recovered at the level before TEA treatment. Reprint from Claussen et al.
(1997) with the permission of the publisher (Licence No: 2693030934022, ‘Springer’) ZMK1 and ZMK2 K+ channels genes from maize were tested from the viewpoint of coleoptile growth. ZMK1 seemed to be growth related, acidification immediately increased channel activity and auxin increased its expression but acidic pH did not changed the expression pattern (Philippar et al., 1999). Over- expression of ZMK1 leads to K+ independent growth (Philippar et al., 2006). Similar results have been obtained for the Arabidopsis K+ channel AtKAT1 in growing hypocotyl and flower stalk (Philippar et al., 2004).
1.2 Plasma membrane H
+-ATPase
Plasma membrane H+-ATPase (PM-H+-ATPase) was first discovered in 1946 when acid dependent glucose transport was described during the fermentation of the yeast Saccharomyces cerevisiae (Conway & O’Malley, 1946). Cyanide and sodium azide caused plasma membrane potential decreases in Neurospora crassa within seconds, which also suggested an ATP-dependent H+ pump activity (Slayman, 1965). The enzyme from fungi Schizosaccharomyces pombe and S. cerevisiae was isolated and shown to be a proton-pumping ATPase creating -150 to -300 mV plasma membrane potential in plants and fungi (Morth et al., 2011).
PM-H+-ATPase is a single polypeptide with a molecular mass of ~ 100kDa (Michelet & Boutry, 1995). ATPase activity is usually between 1 - 2 µmol Pi min-1 mg-1 in purified plasma membrane (Morsomme & Boutry, 2000). The enzyme is essential for living plant cells as it constitutes, to the best of our current knowledge, the primary ion pump which generates the electrochemical potential across the plasma membrane. This electrochemical gradient is responsible for ionotropic signalling, secondary transport, nutrient uptake, pH homeostasis, salt tolerance, stomatal and leaf movements and cell growth (Palmgren, 2001; Moran, 2007; Duby & Boutry, 2009). The PM-H+-ATPase protein is a member of the family of P-type ATPases.
Other members of this family include the Na+,K+-ATPase, the principal ion pump in animals and humans (Morth et al., 2011).
1.2.1 Isoforms of PM-H
+-ATPase
Using the model plant Arabidopsis thaliana twelve PM-H+-ATPase isoforms were identified from the genome (AHA1-12). The AHA12 isoforms carries two large deletions and is possibly a pseudogene (Palmgren, 2001). AHA1 and AHA2 are virtually expressed in all tissues and organs and function as housekeeping gene (Gaxiola et al., 2007) while other PM-H+-ATPase isoforms show some tissue specificity of expression (Morsomme & Boutry, 2000; Palmgren, 2001; Gaxiola et al., 2007). Tissue-specific localization of PM-H+-ATPase is summarised in Table 1.1, based on information provided in (Palmgren, 2001).
There is only one isoform of PM-H+-ATPase known in full detail for barley (Hordeum vulgare) based on nucleotide and protein data bases (NCBI, http://www.ncbi.nlm.nih.gov/ and UniProt http://www.uniprot.org/). However, MS / MS results suggest that there exist at least two different PM-H+-ATPase isoforms in barley (Hynek et al., 2006).
Table 1.1 Localisation of specific PM-H+-ATPase isoforms in plant body (Palmgren, 2001)
Tissue PM-ATPase protein Plant
Seedlings:
Cotyledon PMA1, PMA2, PMA4 N. plumbaginifolia
Primary root PMA1, PMA4 N. plumbaginifolia
Root:
Cortex parenchyma PMA2, PMA3, PMA4 N. plumbaginifolia
Extension zone PMA4 N. plumbaginifolia
Lateral root initials PMA2, PMA4 N. plumbaginifolia
Lateral roots PMA4, PMA9 N. plumbaginifolia
Root hair and epidermis PMA1, PMA3, PMA4 N. plumbaginifolia
MHA2 Zea mays
Root cap PMA2, PMA4 N. plumbaginifolia
Stele (central cylinder) PMA2, PMA3, PMA4 N. plumbaginifolia Stem:
Axillary buds PMA2, PMA4, PMA9 N. plumbaginifolia Cortex parenchyma PMA1, PMA2, PMA4 N. plumbaginifolia
Pith PMA4 N. plumbaginifolia
Vascular tissue PMA2, PMA3, PMA4, PMA9 N. plumbaginifolia
MHA2 Zea mays
AHA3 A. thaliana
Leaf:
Guard cells PMA2, PMA4 N. plumbaginifolia
VHA1, VHA2 Vicia faba
MHA2 Zea mays
Mesophyll PMA2, PMA4 N. plumbaginifolia
VHA1, VHA2 Vicia faba
Trichomes (long) PMA4 N. plumbaginifolia
Trichomes (short) PMA6 N. plumbaginifolia
Vascular tissue PMA2, PMA3, PMA4 N. plumbaginifolia
MHA2 Zea mays
AHA3 A. thaliana
Flower:
Carpel PMA2 N. plumbaginifolia
Ovules PMA1, PMA2, PMA3, PMA4,
PMA6, PMA9
N. plumbaginifolia
AHA3, AHA10 A. thaliana
Nectaries PMA2 N. plumbaginifolia
Stamen; pollen PMA1, PMA2, PMA3, PMA4, PMA6, PMA6
N. plumbaginifolia
AHA3, AHA9 A. thaliana
Style PMA1, PMA3, PMA4 N. plumbaginifolia
Vascular tissue PMA1, PMA2, PMA3, PMA4, PMA6
N. plumbaginifolia
AHA3 A. thaliana
1.2.2 Structure of PM-H
+-ATPase
The crystal structure of AHA2, a PM-H+-ATPase from Ababidopsis thaliana, has recently been described (Fig. 1.6). The protein contains a transmembrane domain with ten helices (M1-10) and three cytosolic domains: a nucleotide-binding domain (N), a phosphorylation domain (P) and an actuator domain (A). ATP is bound with the adenosine part at the N domain and its triphosphate group protruded towards the P domain. ATPase binding site was determined using 5’-(β,γ-methlene)-triphosphate (AMPPCP) a non-hydrolysable analogue of ATP (Pedersen et al., 2007).
Figure 1.6 Structure of AHA2 without auto-inhibitory domain
AHA2 contains ten transmembrane helices (orange, green and brown); a nucleotide binding domain (N), red; a phosphorylation domain (P), blue; and an actuator domain (A); yellow. AMPPCP is shown as ball-and stick representation. The grey box represents the location of the plasma membrane; reprinted from Pedersen et al.
(2007) with the permission of the publisher (Licence No: 2693040963163, ’Nature Publishing Group’).
1.2.3 Catalytic cycle of P-type ATPase and H
+transport mechanism
PM-H+-ATPase undergoes conformational changes during each catalytic cycle. The enzyme has two distinct conformational states termed E1 and E2. The two conformation states differ in reactivity at the nucleotide binding site, which can be phosphorylated by ATP in the E1 form or by free Pi in the E2 form. E1 is the form that binds ATP and H+. The catalytic cycle is shown in details in Fig 1.7 (Morsomme &
Boutry, 2000; Pedersen et al., 2007).
Figure 1.7 Catalytic cycle and H+ transport of PM-H+-ATPase
Originally the catalytic cycle was proposed for Ca2+ ATPase (subfigure A) E1 form binding ATP and H+ (1), then a high energy intermediate is formed while ADP is released (2). Conformation of the enzyme is changing from E1 to E2 (3). Proton release to cell exterior (4), finally Pi is released (5) and conformation of the enzyme returning to form E1 (Morsomme & Boutry, 2000). The E1 form binds H+ and ATP better than the E2 binds these substances, as subfigure B shows; reprinted from Pedersen et al. (2007) with the permission of the publisher (Licence No:
2693040963163, ’Nature Publishing Group’).
1.2.4 Control of PM-H
+-ATPase
Activity of PM-H+-ATPase is modulated by several physiological signals (such as temperature and salt stress). In comparison, there exists little evidence of a regulation of PM-H+-ATPase activity through changes at the transcriptional or protein level. Moderate PM-H+-ATPase expression changes have been describe for high aluminium treatment, (Shen et al., 2005), iron deficiency (Santi et al., 2005), in presence of high sugar concentration (Mito et al., 1996) and high salt treatment (Maathuis et al., 2003) .
Higher (compared to the ‘average’ tissue) PM-H+-ATPase protein concentrations have been found in guard cells, root epidermis, phloem xylem parenchymas (Bouche-Pillon et al., 1994; Michelet & Boutry, 1995; Morsomme &
Boutry, 2000; Palmgren, 2001; Gaxiola et al., 2007) and motor organs of seismonastic plants (Fleurat-Lessard et al., 1997; Moran, 2007).
Regulated exocytosis of vesicles that contains PM-H+-ATPase molecules constitutes an alternative regulation pathway (Hager et al., 1991), yet post-
translational modification of the enzyme seem the most common control mechanism for causing changes in PM-H+-ATPase activity (Gaxiola et al., 2007).
Phosphorylation / dephosphorylation are further mechanisms through which PM-H+-ATPase can be regulated. Elicitor-induced dephosphorylation in tomato plants (Lycopersicon esculentum) resulted in an increase in PM-H+-ATPase activity (Vera- Estrella et al., 1994) while subsequent phosphorylation of the enzyme reduced its activity; although Ca2+-dependent phosphorylation caused decreased H+ pumping activity. Phosphorylation also activates PM-H+-ATPase activity through the fusicoccin (and 14-3-3 protein) activation pathway (Morsomme & Boutry, 2000).
The C-terminal auto-inhibitor regulation domain (R) could be mainly responsible for rapid activity changes of PM-H+-ATPase. Removal of the R domain from the enzyme by trypsin digestion activated PM-H+-ATPase (Palmgren et al., 1991). Structural information of molecular mechanism of the auto-inhibition is not available yet. In AHA2 neutralisation of the auto-inhibitory R domain by binding of 14- 3-3 protein results in pump activation. Before the activation process, the penultimate Thr947 needs to be phosphorylated by a protein kinase which is induced by environmental factors such as light, nutrient status and pathogens. This phosphorylation can lead to the binding of 14-3-3 protein on the R domain complex.
The Thr947 is not freely accessible to protein kinase activity, structural modification is necessary by ligand binding or kinase docking. Phosphorylation of Ser931 inhibits PM-H+-ATPase and destroys the 14-3-3 protein binding site (Sze et al., 1999; Morth et al., 2011). It seems that phosphorylation of most residues within the C-terminal domain impacts on 14-3-3 binding. The enzyme regulation is controlled by distinct protein kinases and phosphatases allowing gradual increase and decrease of the activity of PM-H+-ATPase (Speth et al., 2010). More details are provided in Fig. 1.8.