Salicylic Acid Pathway Changes in Barley Plants Challenged with either a Biotrophic or a Necrotrophic Pathogen
A. Al-Daoude*, E. Al-Shehadah, A. Shoaib, M. Jawhar and M.I.E. Arabi Department of Molecular Biology and Biotechnology, AECS, P. O. Box 6091 Damascus, Syria,
Damascus, Syria
(Received 4 November 2018; Accepted 11 January 2019)
The biotrophic Blumeria graminis (Bg) and the necrotrophic Cochliobolus sativus; (Cs) are economically important fungal pathogens of barley globally. To better understand barley mechanisms to resist these pathogens, changes in salicylic acid (SA) and its responsive genes particularly the pathogenesis related PR1, PR2, PR3 and PR5 were evaluated using qRT- PCR across four time points post infection. Data showed that SA contents significantly increased (P = 0.001) in infected plants of both resistant and susceptible genotypes 24 h post inoculation in comparison with non-infected controls. In addition, time-course tests revealed a notable contradiction in the defense-related genes expression patterns between barley and Bg and Cs interactions, showing that expression patterns of the same defense-associated genes were altered in adaptation to different pathogens. PR1 and PR2 genes were highlyac- tivated inresistant plants infected with the necrotrophic pathogen Cs rather than of the bio- trophic one. The uniformity in barley defense response mechanisms could be in convention with the well-accepted notion that these responses are high intense in the resistant genotype.
Our work provides useful information on the expected role of SA pathways in barley towards biotrophic and necroptrophic pathogens with different lifestyles.
Keywords: barley, powdery mildew, spot blotch, defense response, PCR (qPCR), sali- cylic acid
Introduction
Powdery mildew caused by the obligate biotrophic pathogen, Blumeria graminis f. sp.
hordei (Bg), and spot blotch caused by the necrotrophic [Cochliobolus sativus (Cs) Drechs. ex Dastur] of barley are among the most devastating fungal diseases causing significant yield losses across the world (Kumar et al. 2002; Rsaliyev et al. 2017). Barley plants infected with Bg and Cs pathogens excited defense response which is regulated by various signalling pathways, including plant hormones such as salicylic acid and patho- genesis-related (PR) proteins (Kogel and Langen 2005; Jawhar et al. 2017a,b). However, our understanding of the pathosystems mediating barley infection by these two biotroph- ic and necroptrophic fungi is still limited.
Salicylic acid (SA) is a key defense signal molecule against plant pathogens, and its production can be changed with the expression profiling of responsive marker genes
*Corresponding author; E-mail: scientific@aec.org.sy
(Alvarez 2000; Haffner et al. 2014). Additionally, discovery of SA targets and the under- standing of its molecular modes of action in physiological processes could help in the dissection of the complex SA signalling network, confirming its crucial role in both plant health and disease (Zhang et al. 2016).
A notable number of defense-related genes are activated during plant pathogen interac- tions (Nayanakantha et al. 2016), and SA levels often increase and induce the expression of several pathogenesis-related proteins and initiate the development of systemic acquired resistance and hypersensitive response (Alvarez 2000). However, the molecular events involved in SA signaling are not yet fully understood. Quantitative PCR (qPCR) is con- sidered to be an effective method of detection since it allows the measurement of the relative expression level of a particular transcript and determines its expression after ex- posure to a specific alteration, such as infection by a pathogen (Derveaux et al. 2010).
The present work aimed at evaluating the changes in SA andits responsive pathogen- esis related genes, viz. PR1, PR2, PR3 and PR5 during barley interaction with either abio- trophic (Bg) or a necrotrophic (Cs) pathogen deploying a qPCR approach.
Materials and Methods Plant material and experimental design
The most resistant Banteng and the universal susceptible control cv. WI2291 of barley (Hordeum vulgare L.) to all Bg and Cs isolates available for more than 10 years (Arabi and Jawhar 2004; 2012) were used in this study. Seeds of each genotype were planted in plastic boxes (60 × 40 × 8 cm) filled with sterilized peatmoss with three replicates for each pathogen, and each experimental unit consisted of 10 seedlings. They were placed in a growth chamber in a randomized complete block design at temperatures 22°C (day) and 18°C (night) with a day length of 12 h and 90% relative humidity.
Infection with Cs
The virulent isolate (Cs 16) of C. sativus (Arabi and Jawhar 2004) was used in the ex- periments. Mycelia were grown on Petri dishes containing potato dextrose agar (PDA, DIFCO, Detroit, MI, USA) for 10 days under 20°C in the dark. Then, conidia were col- lected with 10 mL of sterile distilled water and the suspension was adjusted to 2 × 10⁴ conidia/mL. A surfactant (polyoxyethylene-20-sorbitan monolaurate) was added (100 µL/L) to the conidial suspension to facilitate dispersion of the inoculum over the leaf surfaces. The primary leaves of 12-day-old seedlings were inoculated by uniformly spray- ing each plant with the conidial suspension using a hand-held spray bottle. Plants were covered for one night with plastic bags to increase humidity and plants were kept in the same greenhouse at 20°C with a 16 h photoperiod. Infection responseswere scored according to the method described by Fetch and Steffenson (1999).
Inoculation with Bg
Inoculation was performed according to the protocol described by Chaure et al. (2000) on 12-day-old seedlings with conidiospores of a virulent Bg isolate by employing a soft hair brush to give about 10–20 conidia per one microscope field at ×150 magnification.
Inoculated plants were placed under growth chamber conditions, while uninoculated con- trol plants were transferred to a separate “clean” growth chamber and kept under plastic boxes to avoid infection with Bg. Infections were recorded according to the scale de- scribed by Moseman and Baenziger (1981).
SA quantification
SA was quantified in barley third leaf tissuesat 24, 48, 72 and 96 hours post inoculation (hpi). Three replicates were achieved for each time point. SA was measured using the method described by Trapp et al. (2014) with minor modifications. Extraction was achieved by adding 1.0 ml of ethylacetate, dichloromethane, isopropanol and MeOH:
water (8:2) into each. The extract was centrifuged at 4°C at 16,000 g for 5 min and the supernatants were removed into a new 1.5 micro-centrifuge tubes and dried in speed vac.
After drying, 100 μl of MeOH was added to each sample, homogenized under vortex and centrifuged at 16,000 g and 4°C for 10 min. SA was analyzed by a high performance liquid chromatography (HPLC) system (Agilent Technologies, Germany).
RNA isolation and cDNA synthesis
Third barley leaves from three individual biological replicates were collected at 24, 48.
72 and 92 hpi, and immediately frozen in liquid nitrogen, and samples from non-inoculat- ed plants were collected as controls at the same time points. Non-inoculation was done by spraying plants with pathogen-free water. mRNA was extracted from samples with the Nucleotrap mRNA mini kit (Macherey-Nagel, Germany) following the manufacturer’s recommendations. cDNA synthesis was carried out with the Quanti Tect Reverse Transcription Kit (Qiagen, Germany) following the manufacturer’s instructions.
Quantitative real-time PCR (qPCR)
Gene expression was assayed in Step One Plus, 96 well using SYBR Green Master kit (Roche, USA). All cDNA samples, standards and controls (which were tested not to con- tain genomic DNA) were assayed in triplicate for each target gene in a single run. Four known defense-related PR1, PR2, PR3 and PR5 geneswere analyzed. The sequence infor- mation for all RT-PCR primers is given in Table 1. The threshold cycle (Ct) value was automatically determined for each reaction by the real time PCR system with default pa- rameters. The standard curve calculation and data analysis was performed with Rotor- Gene Q software (Qiagen). Raw data (not baseline corrected) of fluorescence levels and the specificity of the amplicons were checked by qRT-PCR dissociation curve analysis
using StepOne™ Software v2.3. Seedlings inoculated with distilled water served as a control.
Data analysis
The fluorescence readings of three replicated samples were averaged, and the blank value (from no-DNA control) was subtracted. Relative expression levels were determined using the average cycle threshold (Ct). Average Ct values were calculated from the triplicate experiment conducted for each gene, with the ΔCT value determined by subtracting the average Ct value of genes from the Ct value of the EF1α gene. Finally, the equation 2–ΔΔCT was used to estimate relative expression levels, and the fold change in putative target gene expression levels was determined as described by Livak and Schmittgen (2001), with EF1α as a reference (housekeeping control) gene. Standard deviation was calculated from the replicated experimental data. The statistical analysis was conducted through the Tukey’s test at the 0.05 level.
Results
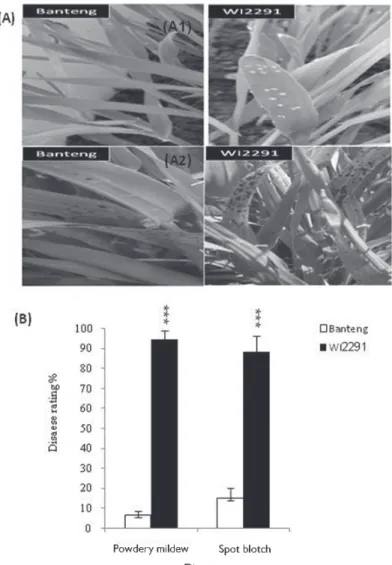
Infection responses of the two selected barley genotypes against Bg and Cs are shown in Figure 1A, B. For Bg, our first notable results were the phenotypic differences between Bg–S and R genotypes. Infected leaves of susceptible WI 2291 plants showed the typical small, yellow spots of Bg at 4 dpi compared with the control (non-inoculated) genotypes.
Several days later a white fluffy fungus can be seen in these spots (data not shown). The resistant genotype Banteng, in contrast, showed normal growth in comparison to WI 2291 as well as the uninoculated plants even at 14 dpi. The results are in agreement with our observations under natural field conditions during the past several years (Arabi and Jawhar 2012). On the other hand, the level of barley resistance to Cs, as assessed by
Table 1. Properties and nucleotide sequences of primers used in this study
Amplified fragment (bp) Sequence
Accession No.
Gene description Gene
TGGATTTGAGGGTGACAACA 167 AT1G07920
Elongation foctor-1 Alapha
EF1α CCGTTCCAATACCACCAATC
ACTACCTTTCACCCCACAACGC 182 AY005474
Pathogen-related protein
PR1 TTTCTGTCCAACAACATTCCCG
TCATCCCTGAACCTTCCTTG 193 AT3G57260
Beta1,3-glucanase2
PR2 GGGGCTACTGTTTCAAGCAA
GGGGCTACTGTTTCAAGCAA 187 AT3G12500
Basic chitinase
PR3 GCAACAAGGTCAGGGTTGTT
GGAGACTGTGGCGGTCTAAG 197 AT1G75040
Pathogen-related protein S
PR5 GCGTTGAGGTCAGAGACACA
lesion density and area under the disease progress curve under controlled conditions.
However, the disease symptoms (presence of necrosis and chlorosis) were always more severe in the highly susceptible cultivar WI2291 (data not shown), these are in line with our previous work (Arabi and Jawhar 2004). In order to evaluate the biochemical and physiological changes in barley responses to Bg and Cs infection, the total SA content and the induction of four important defense related genes viz., PR1, PR2, PR3 and PR5 were assayed.
Figure 1. A: Disease symptoms on the barley resistant cv. Banteng and susceptible cv. WI2291 by (A1) pow- dery mildew according to the scale of Moseman and Baenziger (1981), and by (A2) spot blotch according to the scale of Fetch and Steffenson (1999). B: Frequency of disease reactions incited on the barley resistant cv.
Banteng and susceptible cv. WI2291, 14 days after powdery mildew and spot blotch infection. Significance at
***P < 0.001 between the two genotypes for each disease
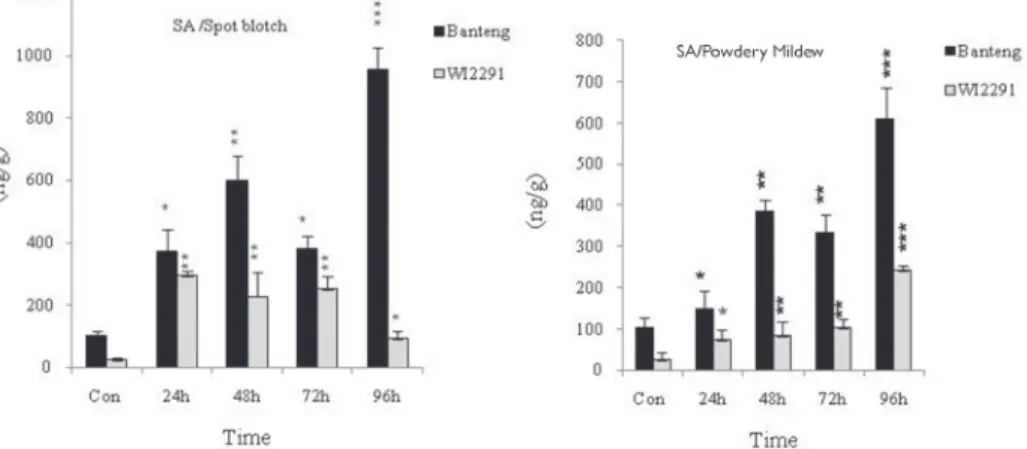
Figure 2. Quantification of total salicylic acid in barley leaves (cv. Banteng and cv. WI2291) 6 days post inoculation with Bg and Cs. Error bars are representative of the standard error (mean ± SD, n = 3). Significance at *P < 0.05; **P < 0.01 and ***P < 0.001 within each genotype during different periods comparing with the
control
Figure 3.
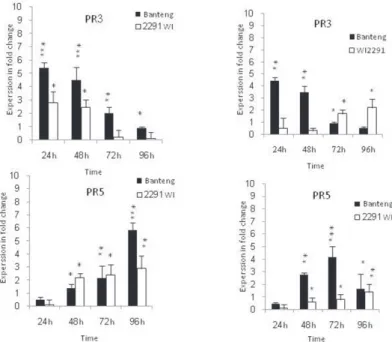
The results showed significant changes (P = 0.001) in SA and its responsive pathogen- esis related gene safter infection with both pathogens at 24, 48, 72 and 96 hpi in barley resistant and susceptible genotypes, and values were consistently higher in the resistant one (Figs 2 and 3). Data showed that SA level contents increased 24 hpi in leaves of the both genotypes as compared with non-inoculated plants, and the resistant genotype had higher levels than the susceptible one at each time point investigated (Fig. 2). This SA could be consideredto have an important role in the SA dependent signaling pathways during Bg and Cs infections. In addition, the remarkable expression of SA-related genes in the resistant ‘Banteng’ and susceptible ‘WI2291’ genotypes can be speculated that the positive role of SA in inducing systemic defense in barley upon Bg and Cs infection is less direct than other defense regulatory phytohormones.Moreover, PR1 and PR2 genes were highly expressed with 9.32 and 3.61-fold increases 72 hpi in resistant plants infected with necrotrophic pathogen Cs rather than of the biotrophic one (Fig. 3).
Discussion
Our results are supported by previous works indicating that the selected marker genes, which are relevant to the SA pathway, showed similar expression patterns in genotypes
Figure 3. Relative expression profiles of marker genes in the resistant genotype Banteng and in the susceptible genotype WI2291during the time course following Bg and Cs infections. Error bars are representative of the standard error (Mean ± SD, n = 3). Data are normalized to Elongation factor 1α (EF-1α) gene expression level (to the calibrator, Control 0 h, taken as 0). Significance at *P < 0.05, **P < 0.01 and ***P < 0.001 within each
genotype during different periods comparing with the control
with varying susceptibility, suggesting that the SA signaling pathway is efficiently acti- vated in the susceptible cultivar, which is in line with Zhang et al. (2016). However, in- creasing SA levels post Bg and Cs infection in a plant does not mean that SA is the main cause of barley resistance since the infection by both pathogens may induce plant re- sponses regulated by other hormones such as jasmonic acid, ABA and ethylene (Häffner et al. 2014). SA accumulation has been documented as a credible marker in defense re- sponses that are associated with redox homeostasis and hypersensitive cell death (Dong 2004), which might be due to the fact that SA binds and inhibits catalase activity (Shim et al. 2003).
Data demonstrated that selected genes in both barley genotypes displayed a different expression at P = 0.001, that were associated with the activation of SA levels. This might be due to the fact that C. sativus has an initial biotrophic stage during disease develop- ment, which would reflect a pathogenic strategy to cope with plant cell death-associated defense (Gupta et al. 2018). Interestingly, some genes were associated with a multi-gene resistance which removes the current credence that similar mechanisms are involved in defense responses to biotrophic and necrotrophic pathogens.
On the other hand, the PRs roles for encoding 1,3-β-glucanase that hydrolyses the β-O-glycosidic bond of β-glucan in plant cell walls which causes cell wall loosening and expansion have been well documented (Akiyama et al. 2009). This effect could be the cause of barley cell wall leakage during Bg and Cs infections. However, PR1 being a β-1, 3-glucanase, this protein is involved in the degradation of fungal cell walls, being re- quired for the hydrolysis of glucan (Van loor et al. 2006). In this work, PR1 transcripts peaked at 48 and 72 hpi in the resistant cv. Banteng for the Bg and Cs respectively, and presumably is targeting secondary hyphal growth for these both pathogens.
Furthermore, previous works indicate that PR genes are associated with MLO pow- dery mildew resistance (Tayeh et al. 2015) and so should be further investigated to sup- port the current results. It is of a particular interest to highlight the induction of defense- related genes at early stages of infection. It has been well established that biotrophic Uromycesvignae and hemibiotroph Mycosphaerella graminicola have suppressed the host defenses for parasitize that invaded host cells during the biotrophic phase (Panstruga 2003; Doehlemann et al. 2008).
In conclusion, this work demonstrated that significant increases in SA and its respon- sive pathogenesis related genes PR1, PR2, PR3 and PR5 were found at early stages upon barley challenged with biotrophs and necrotrophs, with values being higher in the resist- ant genotype. The results could suggest that SA signaling pathways probably work to- gether in the activation of defense responses against both pathogens. The uniformity in the defense response mechanisms could be in convention with the well-accepted notion that these responses are high intense in resistant genotypes. In addition, the data indicated that not only SA is paramount for the defense responses induction, but in the obscurity of pathogen attack, SA might sustain basal levels of genes connected with barley resistance responses and keep the defense system primed against biotrophic and necrotrophic patho- gens.
References
Akiyama, T., Jin, S., Yoshida, M., Hoshino, T., Opassiri, R., Cairns, J.R.K. 2009. Expression of an endo- (1,3;1,4)-beta-glucanase in response to wounding, methyl jasmonate, abscisic acid and ethephon in rice seedlings. J. Plant Physiol. 166:1814–1825.
Alvarez, M.E. 2000. Salicylic acid in the machinery of hypersensitive cell death and disease resistance. Plant Mol. Biol. 44:429–442.
Arabi, M.I.E., Jawhar, M. 2004. Identification of Cochliobolus sativus (spot blotch) isolates expressing differ- ential virulence on barley genotypes in Syria. J. Phytopathol. 152:461–464.
Arabi, M.I.E., Jawhar, M. 2012. Expression of resistance to Blumeria graminisin barley genotypes (Hordeum vulgare L.) under field and controlled conditions. J. Plant Biol. Res. 2:107–112.
Chaure, P., Gurr, S.J., Spanu, P. 2000. Stable transformation of Erysiphe graminis, an obligate biotrophic pathogen of barley. Nat. Biotech. 18:205–207.
Derveaux, S., Vandesompele, J., Hellemans, J. 2010. How to do successful gene expression analysis using real- time PCR. Methods 50:227–230.
Doehlemann, G., Wahl, R., Vranes, M., De Vries, R.P., Kämper, J., Kahmann, R. 2008. Establishment of com- patibility in the Ustilagomaydis/maize pathosystem. J. Plant Physiol. 165:29–40.
Dong, X.N. 2004. NPR1 all things considered. Curr. Opinion Plant Biol. 7:547–552.
Fetch, T.C., Steffenson, B.J. 1999. Rating scales for assessing infection responses of barley infected with Cochliobolus sativus. Plant Dis. 83:231–217.
Gupta, P.K., Vasistha, N.K., Aggarwal, R., Joshi, A.K. 2018. Biology of B. sorokiniana (syn. Cochliobolus sativus) in genomics era. J. Plant Biochem. Biotechnol. 27:123–138.
Häffner, E., Karlovsky, P., Splivallo, R., Traczewska, A., Diederichsen, E. 2014. ERECTA, salicylic acid, abscisic acid, and jasmonic acid modulate quantitative disease resistance of Arabidopsis thaliana to Verticillium longisporum. BMC Plant Biol. 14:71–85.
Jawhar, M., Shoaib, A., Arabi, M.I.E., Al-Daoude, A. 2017a. Changes in transcript and protein expression levels in the barley–Cochliobolus sativus interaction. Cereal Res. Comm. 45:104–113.
Jawhar, M., Al-Shehadah, E., Shoaib, A., Orfi, M., Al-Daoude, A. 2017b. Changes in salicylic acid and gene expression levels during barley–Blumeriagraminis interaction. J. Plant Pathol. 99:651–656.
Kogel, K.H., Langen, G. 2005. Induced disease resistance and gene expression in cereals. Cell Microb.
7:1555–1564.
Kumar, J., Schafer, P., Huckelhoven, R., Langen, G., Baltruschat, H., Stein, E., Nagarajan, S., Kogel, H.K.
2002. Bipolaris sorokiniana, a cereal pathogen of global concern: cytological and molecular approaches towards better control. Mol. Plant Pathol. 3:185–195.
Livak, K.J., Schmittgen, T.D. 2001. Analysis of relative gene expression data using real-time quantitative PCR and the 2(-Delta Delta C(T)) Method. Methods 25:402–408.
Moseman, J.G., Baenziger, P.S. 1981. Genes conditioning resistance of Hordeum spontaneumto Erysiphe gramininsf. sp. Hordi. Crop Sci. 21:229–232.
Nayanakantha, N.M.C., Rawat, S., Ali, S., Grover, A. 2016. Differential expression of defense-related genes in Sinapis alba and Brassica junceaupon the infection of Alternaria brassicae. Trop. Agri. Res. 27:123–
Panstruga, R. 2003. Establishing compatibility between plants and obligate biotrophic pathogens. Curr. Opin. 136.
Plant Biol. 6:320–326.
Rsaliyev, A., Pahratdinova, Z., Rsaliyev, S. 2017. Characterizing the pathotype structure of barley powdery mildew and effectiveness of resistance genes to this pathogen in Kazakhstan. BMC Plant Biol. 17:178.
Shim, I.S., Momose, Y., Yamamoto, A., DeaWook, K., Usui, K. 2003. Inhibition of catalase activity by oxi- dative stress and its relationship to salicylic acid accumulation in plants. J. Plant Growth Regul. 39:285–
292.
Tayeh, C., Randoux, B., Tisserant, B., Khong, G., Jacques, P., Reignaul, P. 2015. Are ineffective defense reac- tions potential target for induced resistance during the compatible wheat powdery mildew interaction. Plant Physiol. Bioch. 96:9–19.
Trapp, M.A., De Souza, G.D., Filho, E.R., Boland, W., Mithofer, A. 2014. Validated method for phytohormone quantification in plants. Fron. Plant Sci. 5:417.
Van Loor, L.C., Rep, M., Pieterse, C.M.J. 2006. Significance of inducible defense-related proteins in infected plants. Annu. Rev. Phytopathol. 44:135–162.
Zhang, Q.Y., Zhang, L.Q., Song, L.L., Duan, K., Li, N., Wang, Y.X., Gao, Q.H. 2016. The different interactions of Colletotrichum gloeosporioides with two strawberry varieties and the involvement of salicylic acid. Hort.
Res. 3:1–10.