Mitochondrial function after associating liver partition and portal vein ligation for staged hepatectomy in an experimental model
A. Budai1 , G. Horváth2, L. Tretter2, Z. Radák4, E. Koltai4, Z. Bori4, F. Torma4, Á. Lukáts3, P. Röhlich3, A. Szijártó1 and A. Fülöp1
1First Department of Surgery, Hepato-Pancreato-Biliary Surgical Research Centre,2Department of Medical Biochemistry and3Department of Anatomy, Histology and Embryology, Semmelweis University, and4Research Institute of Sport and Natural Sciences, University of Physical Education, Budapest, Hungary
Correspondence to:Dr A. Budai, First Department of Surgery, Hepato-Pancreato-Biliary Surgical Research Centre, Semmelweis University, Ulloi Street 78, Budapest, Hungary, H-1082 (e-mail: andras.budai.md@gmail.com)
Background:Associating liver partition and portal vein ligation for staged hepatectomy (ALPPS) is a two-stage strategy to induce rapid regeneration of the remnant liver. The technique has been associated with high mortality and morbidity rates. This study aimed to evaluate mitochondrial function, biogenesis and morphology during ALPPS-induced liver regeneration.
Methods:Male Wistar rats (n=100) underwent portal vein ligation (PVL) or ALPPS. The animals were killed at 0 h (without operation), and 24, 48, 72 or 168 h after intervention. Regeneration rate and proliferation index were assessed. Mitochondrial oxygen consumption and adenosine 5′-triphosphate (ATP) production were measured. Mitochondrial biogenesis was evaluated by protein level measurements of peroxisome proliferator-activated receptor𝛄co-activator (PGC) 1-𝛂, nuclear respiratory factor (NRF) 1 and 2, and mitochondrial transcription factor𝛂. Mitochondrial morphology was evaluated by electron microscopy.
Results:Regeneration rate and Ki-67 index were significantly raised in the ALPPS group compared with the PVL group (regeneration rate at 168 h: mean(s.d.) 291⋅2(21⋅4) versus 245⋅1(13⋅8) per cent, P<0⋅001; Ki-67 index at 24 h: 86⋅9(4⋅6)versus 66⋅2(4⋅9) per cent, P<0⋅001). In the ALPPS group, mitochondrial function was impaired 48 h after the intervention compared with that in the PVL group (induced ATP production); (complex I: 361⋅9(72⋅3)versus629⋅7(165⋅8) nmol per min per mg,P=0⋅038;
complex II: 517⋅5(48⋅8)versus794⋅8(170⋅4) nmol per min per mg,P=0⋅044). Markers of mitochondrial biogenesis were significantly lower 48 and 72 h after ALPPS compared with PVL (PGC1-𝛂 at 48 h:
0⋅61-fold decrease,P=0⋅045; NRF1 at 48 h: 0⋅48-fold decrease,P=0⋅028). Mitochondrial size decreased significantly after ALPPS (0⋅26(0⋅05)versus0⋅40(0⋅07)𝛍m2;P=0⋅034).
Conclusion:Impaired mitochondrial function and biogenesis, along with the rapid energy-demanding cell proliferation, may cause hepatocyte dysfunction after ALPPS.
Surgical relevance
Associating liver partition and portal vein ligation for staged hepatectomy (ALPPS) is a well known surgical strategy that combines liver partition and portal vein ligation. This method induces immense regeneration in the future liver remnant. The rapid volume increase is of benefit for resectability, but the mortality and morbidity rates of ALPPS are strikingly high.
Moreover, lagging functional recovery of the remnant liver has been reported recently.
In this translational study, ALPPS caused an overwhelm- ing inflammatory response that interfered with the peroxisome proliferator-activated receptor γ co-activator 1-α-coordinated, stress-induced, mitochondrial biogenesis pathway. This resulted in the accumulation of immature and malfunctioning mitochon- dria in hepatocytes during the early phase of liver regeneration (bioenergetic destabilization).
These findings might explain some of the high morbidity if confirmed in patients.
Paper accepted 13 July 2018
Published online 27 September 2018 in Wiley Online Library (www.bjs.co.uk).DOI:10.1002/bjs.10978
Introduction
Surgery remains the best treatment option in the man- agement of liver malignancies, with good 5-year overall survival rates (hepatocellular carcinoma 40–70 per cent;
colorectal liver metastasis 27–39 per cent)1. Owing to large tumour load, approximately 45 per cent of patients need extended liver resection for curative treatment2. In these patients, liver failure after hepatectomy arises if the future liver remnant (FLR) volume is too small3. The most significant innovation to enhance the FLR was preoperative portal vein embolization or ligation of the tumour-bearing liver parts (portal vein occlusion), which induces hypertrophy (liver regeneration) in the FLR4. Unfortunately, classical portal vein occlusion induces rela- tively slow regeneration, and the long interval (4–8 weeks) before liver resection increases the risk of tumour progression5,6.
Associating liver partition and portal vein ligation for staged hepatectomy (ALPPS), which combines portal vein ligation (PVL) with parenchymal transection, induces rapid liver regeneration (40–150 per centversus20–50 per cent FLR growth with portal vein occlusion) within a short time frame of 6–10 days7. Initially, ALPPS was associated with high morbidity (up to 80⋅6 per cent) and mortality (up to 28⋅7 per cent) rates8. Newer modifications (such as par- tial ALPPS and mini-ALPPS) and strict patient selection have reduced the rate of complications, but liver failure and mortality remain problematic8,9. There may be inadequate functional regeneration despite the volume increase10,11. The energy demand for liver regeneration is dependent on oxidative phosphorylation12,13 and mitochondrial bio- genesis, in which the pathway governed by peroxisome proliferator-activated receptor γ co-activator (PGC) 1-α is important. This mediator co-activates transcription factors, such as nuclear respiratory factor (NRF) 1 and 2, which control mitochondrial mass, structure and function (Fig. S1, supporting information)14–16. This experimental study aimed to evaluate alterations of cellular energetics, mitochondrial biogenesis and ultrastructure to find causes of the lagging functional recovery and vulnerability of ALPPS.
Methods
The experiments were approved by the Committee of Animal Welfare of Semmelweis University (approval number: PEI/001/1732-6/2015) and were reported according to the ARRIVE guidelines17. Further details of the methods can be found inAppendix S1(supporting information).
Operative procedure
Male Wistar rats (n=100) weighing 200–210 g underwent PVL or ALPPS. Operations were performed as described previously18(Fig.1). Animals were killed 24, 48, 72 or 168 h after the operation; control groups were spared surgery (Table S1, supporting information).
Regeneration ratio calculation
Livers were extracted whole and the lobes were weighed separately using an analytical scale (AG245;
Mettler Toledo, Greifensee, Switzerland). The regen- eration ratio was calculated by the following formula:
lobe weight/bodyweight at time of death)/(mean lobe weight/bodyweight in control group)×100 (%).
Histology
Tissue samples from the regenerating right median lobe (RML) were fixed in 4 per cent paraformaldehyde for 24 h and embedded in paraffin. Ki-67 immunostaining was per- formed according to the manufacturer’s recommendations using MIB-5 anti-Ki-67 antibody (Dako, Hovedstaden, Denmark). Histological slides were scanned (Pannoramic 250 Flash®; 3DHistech, Budapest, Hungary) and evalu- ated using Quant Center® software (3DHistec). Results are shown as percentage of positive cells per detection area.
Isolation of mitochondria
RML samples (0⋅5 g) were homogenized in a homogeniza- tion buffer (Table S2, supporting information) then cen- trifuged for 10 min at 585g. The supernatant was removed and centrifuged for 10 min at 10 200g, after which the pellet was resuspended. After washing three times, the pel- let containing isolated mitochondria was resuspended in 200μl homogenization medium.
Measurement of mitochondrial oxygen consumption
As the efficacy of oxidative phosphorylation is heavily dependent on the intactness of the respiratory chain, espe- cially its first and second enzyme complexes, the oxygen consumption and adenosine 5′-triphosphate (ATP) synthe- sis of these complexes was assessed.
Oxygen consumption was measured via reduced nicotinamide adenine dinucleotide dehydrogenase (first respiratory complex) and succinate dehydrogenase (sec- ond respiratory complex) using an Oxygraph-2 K® high- resolution respirometry system (Oroboros Instruments, Innsbruck, Austria) as reported previously19. Both state 4 (basal function; indicates the endogenous substrate supply)
RML LML RML LML
LLL LLL
RLL
a Schematic diagrams
b Operative images
CL RLL CL
RML
LML LLL
RLL CL
i ii iii
i ii iii
RML RML
LML RML
LML
LLL RLL
RLL
RLL RLL
LLL
iv v vi
LML
LML LML
LLL
LLL RML
RML
RML
Fig. 1aSchematic diagrams andbphotographs of the operative procedure in rats.a(i,ii),b(i–iii) After median laparotomy the portal vein branches feeding the right lateral lobe (RLL), left median lobe (LML), left lateral lobe (LLL) and caudate lobe (CL) are cleared and ligated (*).a(ii),b(iv) The concurrent change in the circulation of the liver causes a visible demarcation (colour change) between the portally perfused right median lobe (RML) and non-perfused LML.a(iii),b(iii) Parenchymal transection (arrow) is performed
according to the falciform ligament.b(v,vi) After transection the liver wounds are sealed with electrocautery (arrows)
and the adenosine 5′-diphosphate (ADP)-stimulated state 3 (induced function; indicates maximum oxygen con- sumption) oxygen consumption were evaluated. Complex I oxygen consumption was measured in the presence of glutamate–malate (GM), whereas complex II oxygen consumption was measured with succinate in the medium (Table S2, supporting information).
Assessment of mitochondrial ATP synthesis Mitochondrial ATP production was measured by the method of Tretter and colleagues20, based on coupled enzyme reactions, which result in the reduction of
nicotinamide adenine dinucleotide phosphate. The absorbance of reduced nicotinamide adenine dinucleotide phosphate was measured at 340 nm using a V650 UV/VIS double-beam spectrophotometer (ABL&E Jasco, Tokyo, Japan). The endogenous substrate supply indicating basal ATP production was investigated in the presence of mito- chondria and ADP only. To evaluate the induced, complex I or II-mediated maximum achievable ATP production, GM or succinate was added to the medium.
Measurement of steady-state NAD(P)H
Citrate cycle function (endogenous substrate produc- tion) leading to matrix reduced nicotinamide adenine
dinucleotide (phosphate) (NAD(P)H) autofluorescence was measured using a PTI Deltascan® fluorescence spectrophotometer (Photon Technology International, Lawrenceville, New Jersey, USA) at 37∘C, at 344 nm exci- tation and 460 nm emission wavelengths. Basal NAD(P)H autofluorescence was assessed with only mitochondria present in the incubation medium. GM or succinate was added to the medium to evaluate NAD(P)H content when complex I or II activity was induced19.
Western blotting
Liver tissue was prehomogenized in phosphate-buffered saline with an Ultra Turrax® homogenizer (IKAW- erke, Staufen im Breisgau, Germany). Some 100μl prehomogenate was rehomogenized in 1000μl RIPA buffer. Samples containing 20μg protein were elec- trophoresed on 8–12 per cent (v/v) sodium dodecyl sulphate–polyacrylamide gels. Proteins were transferred on to polyvinylidene difluoride membranes. Samples were incubated with primary antibodies (Table S3, sup- porting information). Bound primary antibodies were detected using horseradish peroxidase-conjugated sec- ondary antibodies (Jackson ImmunoResearch, West Grove, Pennsylvania, USA) and SuperSignal West Pico®
chemiluminescent substrate (Thermo Scientific, Waltham, Massachusetts, USA). Protein bands were visualized on X-ray films and quantified with FIJI software21. Total protein load served as internal control.
Electron microscopy
Following administration of a lethal dose of ketamine and xylazine, intracardial perfusion was carried out with 150 ml saline followed by 100 ml 4 per cent paraformalde- hyde and 200 ml 2 per cent glutaraldehyde. Pieces of RML (1×1×1 mm) were postfixed in 1 per cent osmium tetroxide for 1 h at 4∘, then dehydrated and embedded in Araldite® (Sigma-Aldrich, St Louis, Missouri, USA).
Ultrathin sections were prepared and contrast-stained with lead citrate. An H-7500 transmission electron micro- scope (Hitachi, Tokyo, Japan) equipped with a Megaview II digital camera (Olympus, Tokyo, Japan) was used for image acquisition. Mitochondrial area was measured in every fully captured cell using FIJI software21. To aid with interpretation, mitochondria with an area of less than 0⋅24μm2(median mitochondrial area in the control group) were classified as small.
Statistical analysis
Results are presented as mean(s.d.). Statistical analy- sis was carried out in GraphPad Prism® version 6.1
(GraphPad, La Jolla, California, USA). Results were assessed by two-way ANOVA with Bonferroni’s post hoc analysis. Curve fittings and calculations of mitochondrial area measurements were performed with OriginPro 2015 (Originlab, Northampton, Massachusetts, USA).P<0⋅050 was considered statistically significant.
Results
ALPPS accelerates liver regeneration
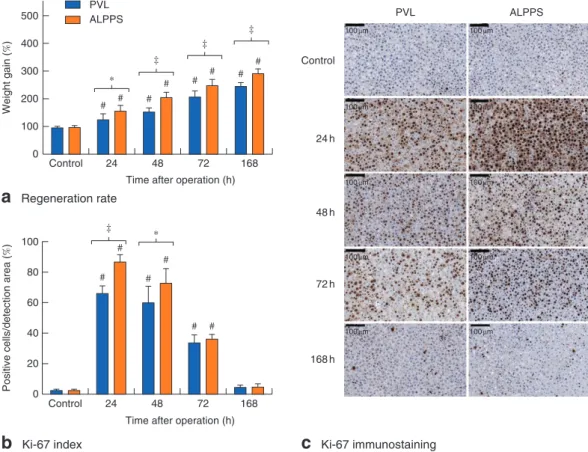
The weight gain and pace of hypertrophy of the RML was significantly higher after ALPPS than after PVL (168 h, P<0⋅001) (Fig.2a). The Ki-67 index was significantly higher in the ALPPS group after 24 h (P<0⋅001) and 48 h (P=0⋅015) (Fig.2b,c).
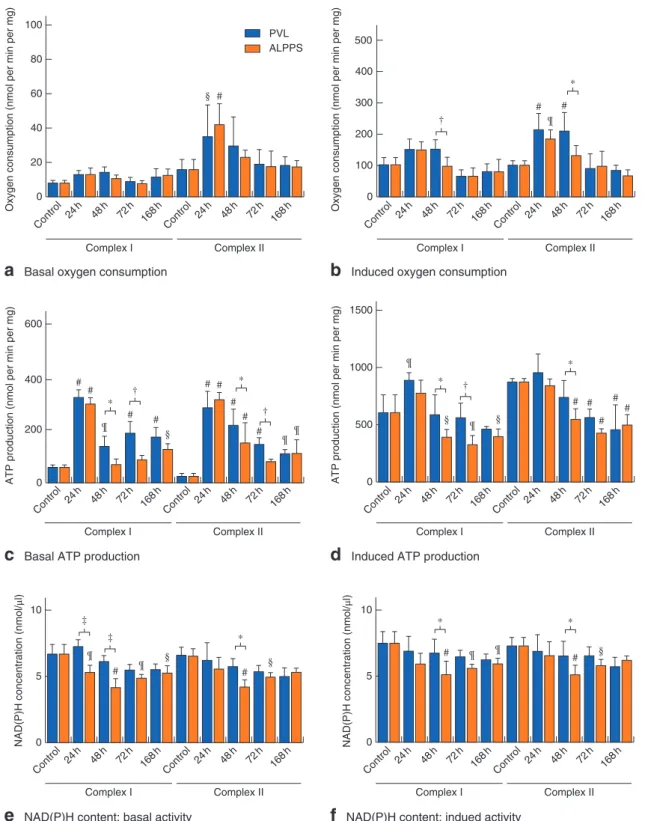
Mitochondrial oxygen consumption is less effective after ALPPS compared with PVL
Basal complex I activity was not affected by the opera- tions. Basal oxygen consumption via complex II increased significantly 24 h after ALPPS and returned to baseline 48 h after the intervention, with no significant differ- ences compared with control levels or the PVL group (Fig.3a). In the PVL group, induction of complex I by GM+ADP resulted in a tendency towards an increase in oxygen consumption 24 and 48 h after the interven- tions (Fig.3b). In the ALPPS group, the oxygen con- sumption increased initially then returned close to basal level, becoming significantly lower than that in the PVL group 48 h after operation (P=0⋅040). In the case of com- plex II induction, mitochondrial activity was significantly increased in both groups compared with controls after 24 h (PVL versus control, P=0⋅002; ALPPS versus con- trol, P=0⋅010). Induced complex II oxygen consump- tion in the PVL group remained significantly higher than the control value, whereas oxidation in the ALPPS group returned to the control level, becoming significantly lower than that in the PVL group (Fig.3b; Fig. S2, supporting information).
Mitochondrial ATP production is less effective after ALPPS compared with PVL
By 24 h, basal ATP production of complex I increased in both groups. In the PVL group, it remained raised throughout the experiment. However, 48 h after ALPPS, ATP production returned to baseline, becoming signif- icantly lower than that after PVL (P=0⋅014) (Fig. 3c).
Basal ATP production of complex II was increased sig- nificantly 24, 48 and 72 and 168 h after PVL compared
Control
Control 0 20 40 60 80
‡ *
Positive cells/detection area (%) 100
24 48
Time after operation (h)
72 168
100μm 100μm
100μm 100μm
100μm 100μm
100μm 100μm
100μm 100μm
PVL ALPPS
24 h
48 h
72 h
168 h
#
#
#
#
# # Control
0 200 400
*
‡
‡
‡
Weight gain (%)
24 48
Time after operation (h)
a
Regeneration rateb
Ki-67 indexc
Ki-67 immunostaining72 168
100 300 500
# # #
# # # # #
PVL ALPPS
Fig. 2Changes in regeneration rate and cell-cycle entry.aWeight gain of regenerating lobes andbKi-67 index in controls, and at 24, 48, 72 and 168 h after portal vein ligation (PVL)versusassociating liver partition and portal vein ligation for staged hepatectomy (ALPPS). Values are mean(s.d.) (n=5).*P<0⋅050,‡P<0⋅001; #P<0⋅001versusPVL or ALPPS control (2-way ANOVA, with Bonferroni’spost hoctest).cRepresentative histological images showing Ki-67 immunostaining (haematoxylin counterstain)
with control values (Fig.3c). In the ALPPS group, after a temporary increase at 24 h, ATP production quickly decreased, becoming significantly lower than that in the PVL group (48 h,P=0⋅019; 72 h,P=0⋅007). After induc- tion by GM, ATP production of complex I increased tem- porarily in the PVL group compared with control values, then returned to baseline level (Fig.3d). In the ALPPS group, induced ATP production by complex I lowered significantly, leading to a significant difference between ALPPS and PVL groups at 48 h (P=0⋅038) and 72 h (P=0⋅006). From 48 h onwards, induced ATP production by complex II decreased significantly in the ALPPS group compared with controls or the PVL group (PVL versus ALPPS,P=0⋅044) (Fig.3d).
Mitochondrial NAD(P)H concentration decreases in ALPPS-treated animals
The NAD(P)H concentrations during basal complex I and II activity after PVL did not differ significantly from
control values, whereas NAD(P)H concentrations in the ALPPS group gradually decreased after operation and were significantly lower than control values from 24 h onwards after operation (Fig.3e). Induction by substrates resulted in similar trends (Fig.3f). NAD(P)H concentrations in the PVL group showed no changes compared with control val- ues. In the ALPPS group, concentrations were significantly lower than control values at 48, 72 and 168 h in the case of complex I, and at 48 and 72 h for complex II induction.
These data indicate profound damage to endogenous sub- strate supply of oxidative phosphorylation (Figs S3andS4, supporting information).
ALPPS causes hepatic inflammatory cytokine release and activation of inflammatory pathways Liver tumour necrosis factor (TNF) α levels increased significantly in both groups compared with the con- trol value 24 h after operation. Protein levels of TNF-α normalized in the PVL group after 48 h, but remained
Control 0 20 40 60 80
Oxygen consumption (nmol per min per mg)
100
48h 24h
72h 168
h Control 24h
48h 72h
168 h
Control 48h 24h
72h 168
h Control 24h
48h 72h
168 h
Control 48h 24h
72h 168 h
Control 24h
48h 72h
168 h Control
48h 24h
72h 168
h Control
24h 48h
72h 168h
Control 48h 24h
72h 168
h Control 24h
48h 72h
168 h
Control 48h 24h
72h 168
h Control 24h
48h 72h
168 h
§ # #
¶
#
a
Basal oxygen consumptionPVL ALPPS
0 200 400
*
ATP production (nmol per min per mg)
600
#
§
¶ §
#
¶
# §
# #
¶
# #
#
#
# ¶ ¶
† #
‡
‡ *
* *
* * †
*
†
c
Basal ATP production0 5 10
NAD(P)H concentration (nmol/μl)
e
NAD(P)H content: basal activity0 200 400 500
†
Oxygen consumption (nmol per min per mg)
100 300
*
b
Induced oxygen consumption0 500 1000
ATP production (nmol per min per mg)
1500
#
¶ §
# ¶ ¶
# §
§
¶
#
#
# #
d
Induced ATP production0 5 10
NAD(P)H concentration (nmol/μl)
f
NAD(P)H content: indued activityComplex I Complex II Complex I Complex II
Complex I Complex II
Complex I Complex II
Complex I Complex II Complex I Complex II
Fig. 3Changes in mitochondrial function.aBasal andbinduced oxygen consumption,cbasal anddinduced adenosine 5′-triphosphate (ATP) production, andebasal andfinduced reduced nicotinamide adenine dinucleotide (phosphate) (NAD(P)H) content of complex I and complex II in controls, and at 24, 48, 72 and 168 h after portal vein ligation (PVL)versusassociating liver partition and portal vein ligation for staged hepatectomy (ALPPS). Values are mean(s.d.) (n=5).*P<0⋅050,†P<0⋅010,‡P<0⋅001;§P<0⋅050,¶P<0⋅010,
#P<0⋅001versusPVL or ALPPS control (2-way ANOVA, with Bonferroni’spost hoctest)
Control 0 0·05 0·20
*
Relative expression
0·25
48
24 72 168
0·10 0·15
a
Total cell lysate TNF-α protein levelsPVL ALPPS
Time after operation (h)
§ #
#
¶
Control 0 0·01 0·04
*
Relative expression
0·05
48
24 72 168
0·02 0·03
† *
c
Total cell lysate PGC1-α protein levels Time after operation (h)Control 0 0·05 0·15
Relative expression
0·20
48
24 72 168
0·10
e
Mitochondrial mTFA protein levels Time after operation (h)Control 0 0·02 0·08
*
Relative expression
0·10
48
24 72 168
0·04 0·06
*
b
Total cell lysate NF-κB p65 protein levels Time after operation (h)#
#
#
# ¶ ¶
Control 0
*
Relative expression
0·15
48
24 72 168
0·05 0·10
*
*
d
Total cell lysate NRF1 protein levels Time after operation (h)§ §
¶
Control 0 0·05 0·15
‡
Relative expression
0·20
48
24 72 168
0·10
†
†
f
Mitochondrial cytochrome c protein levels Time after operation (h)§ ¶
Fig. 4Changes in inflammatory and biogenesis-related protein levels. Total cell lysateatumour necrosis factor (TNF)α,bnuclear factor (NF)κB,cperoxisome proliferator-activated receptorγco-activator (PGC) 1-αanddnuclear respiratory factor (NRF) 1 protein levels, and mitochondrialemitochondrial transcription factorα(mTFA) andfcytochrome c protein levels, in controls, and at 24, 48, 72 and 168 h after portal vein ligation (PVL)versusassociating liver partition and portal vein ligation for staged hepatectomy (ALPPS).
Values are mean(s.d.) (n=5).*P<0⋅050,†P<0⋅010,‡P<0⋅001;§P<0⋅050,¶P<0⋅010, #P<0⋅001versusPVL or ALPPS control (2-way ANOVA, with Bonferroni’spost hoctest)
significantly higher in the ALPPS group (Fig.4a). In the first 72 h, nuclear factor (NF)-κB p65 concentrations were significantly increased in both groups. However, protein concentrations during the first 48 h were significantly higher after ALPPS compared with PVL (Fig.4b).
ALPPS causes impairment in PGC1-𝛂-coordinated mitochondrial biogenesis
At 48 h after operation, PGC1-α concentrations were significantly increased in the PVL group compared with those in the ALPPS group and control values (P=0⋅045)
Control 0 0·2 0·6
Area of mitochondria (μm2) 0·8
48
24 72 168
0·4
b
Mean mitochondrial areaa
Electron micrographsPVL ALPPS
PVL ALPPS
Time after operation (h)
0 0·05
0·5 1·0 1·5 2·0
0·20
% of mitochondria
0·25
0·10 0·15
e
Mitochondrial size distribution: ALPPS Mitochondrial transection area (μm2)0·5 1·0 1·5 2·0
Mitochondrial transection area (μm2) 0
0·05 0·20
% of mitochondria
0·25
0·10 0·15
d
Mitochondrial size distribution: PVLControl 0 20 60
% of mitochondria
80
48
24 72 168
40
c
Percentage of mitochondria <0·24μm2 Time after operation (h)Control 24 h 48 h 72 h 168 h Control
24 h 48 h 72 h 168 h
*
§
*
§ Control
5μm 5μm 5μm 5μm 5μm
5μm 5μm 5μm 5μm 5μm
PVL ALPPS
24 h 48 h 72 h 168 h
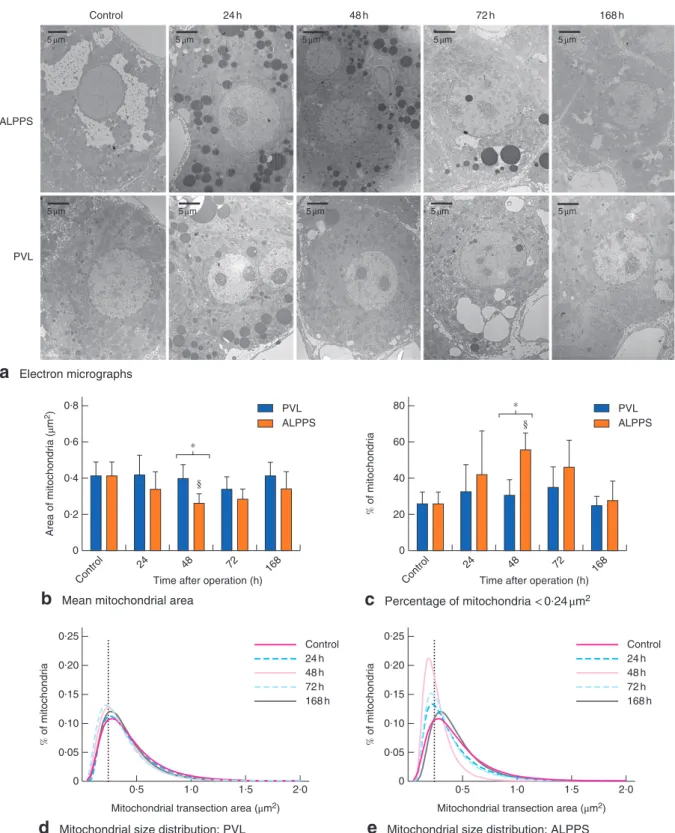
Fig. 5Changes in mitochondrial shape.aRepresentative electron micrographs,bmean mitochondrial area, andcpercentage of mitochondria with an area of less than 0⋅24μm2in controls, and at 24, 48, 72 and 168 h after portal vein ligation (PVL)versus
associating liver partition and portal vein ligation for staged hepatectomy (ALPPS). Values are mean(s.d.) (n=5).*P<0⋅050;§P<0⋅050 versusPVL or ALPPS control (2-way ANOVA, with Bonferroni’spost hoctest). Mitochondrial size distribution afterdPVL and eALPPS; the dotted line indicates the median mitochondrial area of the control group (0⋅24μm2)
(Fig.4c). NRF1 protein concentrations increased signif- icantly during the first 72 h after PVL, but remained unchanged throughout the experiment after ALPPS and were significantly lower than those after PVL (24 h, P=0⋅046; 48 h, P=0⋅028; 72 h, P=0⋅048) (Fig.4d).
NRF2 protein levels showed no significant changes in any of the groups (Fig. S5, supporting information). There were no significant differences between experimental groups regarding liver tissue cytochrome c and mito- chondrial transcription factor α (mTFA) protein levels (Fig. S5, supporting information). However, mitochon- drial mTFA levels increased gradually after PVL, but tended to decrease after ALPPS. This led to significant differences between the PVL and ALPPS groups at 48 h (P=0⋅002) and 72 h (P=0⋅029) (Fig.4e). Mitochondrial cytochrome c levels were raised in the PVL group 48 and 72 h after operation compared with control values. In the ALPPS group, however, they remained unchanged and were significantly lower than values in the PVL group (Fig.4f).
Mitochondrial morphology changes significantly after ALPPS
The mean mitochondrial area was unchanged after PVL compared with controls. However, mitochondrial area in the ALPPS group was significantly decreased 48 h after operation compared with control values (P=0⋅034) and the PVL group (P=0⋅038) (Fig.5a,b). The PVL group showed no significant changes in mitochondrial area dis- tribution compared with controls, whereas the majority of mitochondria were smaller than 0⋅24μm248 h after ALPPS (Fig.5c–e).
Discussion
Surprisingly, liver failure after hepatectomy is among the most common causes of patient death after ALPPS10, which suggests severe impairments in cellular energet- ics during the highly accelerated and energy-demanding regenerative process. This investigation therefore focused on the assessment of mitochondrial function, morphol- ogy and the PGC1-α-regulated biogenesis pathway. RML growth was significantly greater in the ALPPS group than in the PVL group from 24 h after operation and remained higher throughout the experiment. In addition, more hepatocytes entered the cell cycle in the first 48 h after ALPPS. Accordingly, ALPPS-induced accelerated weight gain is not the manifestation of passive conges- tion or oedema; it is indicative of cellular proliferation,
consistent with the clinical findings of Eshmuminov and colleagues22.
Although ALPPS forces more hepatocytes into prolifera- tion, causing significantly greater volumetric regeneration of the FLR, recent studies23,24 have reported signifi- cantly lagging functional recovery. As the maintenance of liver function is highly energy-dependent, hepatocyte bioenergy impairment presumably underlies this slower functional regeneration. Oxidative phosphorylation is the primary energy source of hepatocytes during cell division12. Complexes I and II are the points of entry to the respiratory chain for substrates of oxidative phospho- rylation, and their malfunction causes severe bioenergetic impairment. Accordingly, mitochondrial ATP produc- tion, oxygen consumption and NAD(P)H content during basal and induced complex I and II function were eval- uated here. Basal levels of oxygen consumption and ATP production refer to the endogenous substrate supply, whereas induced levels indicate the maximum ATP output and oxygen consumption capacity of the mitochondria.
After PVL, both basal and induced oxygen consump- tion as well as ATP production increased between 24 and 48 h after operation, when cell division is the most intense, which suggests enhancement of mitochondrial function during the early phase of liver regeneration. Accordingly, PVL-induced liver regeneration is a well balanced pro- cess, which has a sufficient energy supply provided by the increased mitochondrial function. This is in accor- dance with previous work25 that showed increased mito- chondrial function, as well as DNA and protein content, after PVL.
Regarding ALPPS, although oxygen consumption and ATP production increased temporarily after ALPPS, mito- chondrial activity decreased suddenly at 48 h, resulting in significantly reduced mitochondrial function compared with that in the PVL group. Accompanied by intense cell division, these changes may lead to imbalances in energy demand and supply of hepatocytes. In addition, mitochondrial NAD(P)H content remained unchanged after PVL, but decreased significantly 48 h after ALPPS, indicating profound damage to the endogenous substrate supply of oxidative phosphorylation; this was further supported by the lowered basal levels of ATP produc- tion. The energy imbalance of hepatocytes increases the vulnerability of the liver. Complications that exert addi- tional stress (such as biliary leakage and sepsis) can cause liver failure, in a vicious circle, owing to lack of energy reserves.
Mitochondrial function is maintained through mito- chondrial biogenesis. Therefore, the PGC1-α-controlled
biogenesis pathway was assessed. PGC1-α, a co-activator of stress-induced mitochondrial biogenesis, controls the expression of NRF1 and NRF2, which are essential transcription factors of nuclear-encoded mitochondrial proteins14,15. PGC1-α, NRF1 and mTFA levels were significantly increased after PVL compared with control values. NRF2 levels did not show significant changes, although there was a tendency towards an increase until 48 h after operation. These changes suggest that PVL-induced liver regeneration is characterized by upregulated, well balanced mitochondrial biogenesis, which results in sufficient energy production for the immense cell division.
The PGC1-αconcentrations showed different kinetics in the ALPPS group. PGC1-αlevels remained significantly lower in the ALPPS group than in the PVL group, but showed no significant changes compared with control values. NRF1 levels remained unchanged after ALPPS.
According to the authors’ hypothesis, the immense inflammation – a critical factor in ALPPS-induced accelerated liver regeneration – might suppress mito- chondrial biogenesis. In 2014, Schlegel and colleagues26 reported increased interleukin 6 and TNF-α expression after ALPPS. Although these cytokines are essential in the initiation of liver regeneration, overwhelming inflammation may impair mitochondrial function. As doc- umented previously27, TNF-αcould reduce the levels of PGC1-α. Furthermore, Alvarez-Guardia and co-workers28 reported direct suppression of PGC1-α by NF-κB p65, which resulted in mitochondrial dysfunction. Taking into account that TNF-αand NF-κB p65 protein levels were significantly increased after ALPPS during the present investigation, the negative interactions between PGC1-α and inflammatory mediators might be responsible for the decreased PGC1-α concentrations and consequently diminished mitochondrial biogenesis. PGC1-α controls the expression of NFR1, which is a major transcription factor for mitochondrial respiratory complex proteins.
The reduced expression of PGC1-αresults in decreased NRF1 levels16. The high rate of cell division combined with unchanged NRF1 protein levels might lead to relatively low expression of respiratory complex ele- ments, which eventually reduces the output of individual mitochondria.
Liver tissue lysate NRF2 concentrations remained unchanged after ALPPS, which might be explained by the different upstream pathway of this mediator, possibly coun- teracting the fluctuations in PGC1-αlevels29. NRF1 and NRF2 are critical factors in the expression of mTFA and respiratory chain elements such as cytochrome c15,16,30. Here, liver tissue lysate concentrations of mTFA and
cytochrome c were similar in the two experimental groups, whereas the mitochondrial lysate concentrations of these mediators were significantly lower after ALPPS.
As NRF1 and NRF2 control expression of the TOM (translocase of the outer membrane) complex, which is the universal transporter of mitochondrial proteins31, the reduced NRF1 concentrations may result in deficient TOM complex expression and translocation, leading to difficulties in nucleomitochondrial interactions.
PGC1-α and NRF1 also influence mitochondrial morphology15,16. Accordingly, the mitochondrial transection area was significantly smaller at 48 h in the ALPPS group, suggesting organelle shrinkage, and the proportion of small mitochondria increased signifi- cantly 48 h after operation compared with that in the PVL group. These data, together with the functional and biogenetic parameters, suggest that, although the number of mitochondria increases after ALPPS, these organelles are rather immature and lack proper function owing to inadequate biogenesis. It must be mentioned that animal studies have limitations in translating to humans. However, mitochondrial structure, energy pro- duction and biogenesis are highly conserved in mammals, and data gained from rats closely resemble those from humans32.
Acknowledgements
A.S. and A.F. contributed equally to this article. This work was supported by the Hungarian Scientific Research Fund (OTKA-K115607) of the National Research, Devel- opment, and Innovation Office (to A.S.) and the János Bolyai Research Grant of the Hungarian Academy of Sciences (to A.S.).
Disclosure:The authors declare no conflict of interest.
References
1 Abbas S, Lam V, Hollands M. Ten-year survival after liver resection for colorectal metastases: systematic review and meta-analysis.ISRN Oncol 2011;2011: 763245.
2 Liu H, Zhu S. Present status and future perspectives of preoperative portal vein embolization.Am J Surg2009;197:
686–690.
3 Guglielmi A, Ruzzenente A, Conci S, Valdegamberi A, Iacono C. How much remnant is enough in liver resection?
Dig Surg2012;29: 6–17.
4 Salem AI, Winslow ER. Current technical aspects of oncological hepatic surgery.Hepatobiliary Pancreat Dis Int 2017;16: 147–154.
5 Hoekstra LT, van Lienden KP, Doets A, Busch OR, Gouma DJ, van Gulik TM. Tumor progression after
preoperative portal vein embolization.Ann Surg2012;256:
812–817.
6 van Lienden KP, van den Esschert JW, de Graaf W, Bipat S, Lameris JS, van Gulik TMet al.Portal vein embolization before liver resection: a systematic review.Cardiovasc Intervent Radiol2013;36: 25–34.
7 Schnitzbauer AA, Lang SA, Goessmann H, Nadalin S, Baumgart J, Farkas SAet al.Right portal vein ligation combined within situsplitting induces rapid left lateral liver lobe hypertrophy enabling 2-staged extended right hepatic resection in small-for-size settings.Ann Surg2012;255:
405–414.
8 de Santibañes M, Boccalatte L, de Santibañes E. A literature review of associating liver partition and portal vein ligation for staged hepatectomy (ALPPS): so far, so good.Updates Surg2017;69: 9–19.
9 Stavrou GA, Donati M, Fard-Aghaie MH, Zeile M, Huber TM, Stang Aet al.Did the International ALPPS Meeting 2015 have an impact on daily practice? The Hamburg Barmbek experience of 58 cases.Visc Med2017;33:
456–461.
10 Serenari M, Zanello M, Schadde E, Toschi E, Ratti F, Gringeri Eet al.; ALPPS Italian Registry Group. Importance of primary indication and liver function between stages:
results of a multicenter Italian audit of ALPPS 2012–2014.
HPB (Oxford)2016;18: 419–427.
11 Truant S, Baillet C, Deshorgue AC, Leteurtre E, Hebbar M, Ernst Oet al.Drop of total liver function in the interstages of the new associating liver partition and portal vein ligation for staged hepatectomy technique: analysis of the ‘auxiliary liver’ by HIDA scintigraphy.Ann Surg2016;263:
e33–e34.
12 Fu D, Mitra K, Sengupta P, Jarnik M, Lippincott-Schwartz J, Arias IM. Coordinated elevation of mitochondrial oxidative phosphorylation and autophagy help drive hepatocyte polarization.Proc Natl Acad Sci U S A2013;110:
7288–7293.
13 Gnaiger E, Aasander Frostner A, Abumrad NA, Acuna-Castroviejo, Ahn B, Ali AAet al.; MitoEAGLE Network.Mitochondrial Respiratory States and Rates: Building Blocks of Mitochondrial Physiology Part 1; 2018. http://www .mitoeagle.org/images/4/49/MitoEAGLE_preprint_2018- 02-08.pdf [accessed 10 June 2018].
14 Spiegelman BM. Transcriptional control of mitochondrial energy metabolism through the PGC1 coactivators.Novartis Found Symp2007;287: 60–63.
15 Scarpulla RC. Nuclear control of respiratory gene expression in mammalian cells.J Cell Biochem2006;97:
673–683.
16 Evans MJ, Scarpulla RC. NRF-1: a trans-activator of nuclear-encoded respiratory genes in animal cells.Genes Dev 1990;4: 1023–1034.
17 Kilkenny C, Browne WJ, Cuthi I, Emerson M, Altman DG.
Improving bioscience research reporting: the ARRIVE guidelines for reporting animal research.Vet Clin Pathol 2012;41: 27–31.
18 Budai A, Fulop A, Hahn O, Onody P, Kovacs T, Nemeth T et al.Animal models for associating liver partition and portal vein ligation for staged hepatectomy (ALPPS):
achievements and future perspectives.Eur Surg Res2017;
58: 140–157.
19 Pesta D, Gnaiger E. High-resolution respirometry:
OXPHOS protocols for human cells and permeabilized fibers from small biopsies of human muscle.Methods Mol Biol 2012;810: 25–58.
20 Tretter L, Horvath G, Hölgyesi A, Essek F, Adam-Vizi V.
Enhanced hydrogen peroxide generation accompanies the beneficial bioenergetic effects of methylene blue in isolated brain mitochondria.Free Radic Biol Med2014;77:
317–330.
21 Schindelin J, Arganda-Carreras I, Frise E, Kaynig V, Longair M, Pietzsch Tet al.Fiji: an open-source platform for biological-image analysis.Nature Methods2012;9:
676–682.
22 Eshmuminov D, Tschuor C, Raptis DA, Boss A,
Wurnig MC, Sergeant Get al.Rapid liver volume increase induced by associating liver partition with portal vein ligation for staged hepatectomy (ALPPS): is it edema, steatosis, or true proliferation?Surgery2017;161:
1549–1552.
23 Kang D, Schadde E. Hypertrophy and liver function in ALPPS: correlation with morbidity and mortality.Visc Med 2017;33: 426–433.
24 Olthof PB, Tomassini F, Huespe PE, Truant S, Pruvot FR, Troisi RIet al.Hepatobiliary scintigraphy to evaluate liver function in associating liver partition and portal vein ligation for staged hepatectomy: liver volume overestimates liver function.Surgery2017;162: 775–783.
25 Katoh T, Tanaka M, Nimura Y, Kanai M, Nagino M, Ozawa T. Enhancement of rat liver mitochondrial function by portal branch ligation secures subsequent extended hepatectomy.Biochem Int1991;24: 107–116.
26 Schlegel A, Lesurtel M, Melloul E, Limani P, Tschuor C, Graf Ret al.ALPPS: from human to mice highlighting accelerated and novel mechanisms of liver regeneration.Ann Surg2014;260: 839–846.
27 Palomer X, Alvarez-Guardia D, Rodríguez-Calvo R, Coll T, Laguna JC, Davidson MMet al.TNF-alpha reduces PGC-1alpha expression through NF-kappaB and p38 MAPK leading to increased glucose oxidation in a human cardiac cell model.Cardiovasc Res2009;81:
703–712.
28 Alvarez-Guardia D, Palomer X, Coll T, Davidson MM, Chan TO, Feldman AMet al.The p65 subunit of
NF-kappaB binds to PGC-1alpha, linking inflammation and metabolic disturbances in cardiac cells.Cardiovasc Res2010;
87: 449–458.
29 Aleksunes LM, Manautou JE. Emerging role of Nrf2 in protecting against hepatic and gastrointestinal disease.Toxicol Pathol2007;35: 459–473.
30 Gleyzer N, Vercauteren K, Scarpulla RC. Control of mitochondrial transcription specificity factors (TFB1M and
TFB2M) by nuclear respiratory factors (NRF-1 and NRF-2) and PGC-1 family coactivators.Mol Cell Biol2005;25:
1354–1366.
31 Eisenberg-Bord M, Schuldiner M. Ground control to major
TOM: mitochondria–nucleus communication.FEBS J2017;
284: 196–210.
32 Friedman JR, Nunnari J. Mitochondrial form and function.
Nature2014;505: 335–343.
Supporting information
Additional supporting information can be found online in the Supporting Information section at the end of the article.
Snapshot quiz 19/2
Answer:This woman underwent urgent haemorrhoidectomy for presumed prolapsed haemorrhoids. The diagnosis on histopathology wasmalignantmelanoma of epithelioid type,with necrosis and ulceration of the surface. This is a very Snapshot quiz
uncommon type of melanoma, and there is no defined therapeutic pathway.