A new molecular classi fi cation to drive precision treatment strategies in primary Sjögren ’ s syndrome
Perrine Soret
1,29, Christelle Le Dantec
2,29, Emiko Desvaux
1,2, Nathan Foulquier
2, Bastien Chassagnol
1, Sandra Hubert
1, Christophe Jamin
2,3, Guillermo Barturen
4, Guillaume Desachy
1,
Valérie Devauchelle-Pensec
2,3, Cheïma Boudjeniba
1, Divi Cornec
2,3, Alain Saraux
2,3, Sandrine Jousse-Joulin
2,3, Nuria Barbarroja
5, Ignasi Rodríguez-Pintó
6, Ellen De Langhe
7, Lorenzo Beretta
8, Carlo Chizzolini
9,
László Kovács
10, Torsten Witte
11, PRECISESADS Clinical Consortium*, PRECISESADS Flow Cytometry Consortium*, Eléonore Bettacchioli
3, Anne Buttgereit
12, Zuzanna Makowska
12, Ralf Lesche
12,
Maria Orietta Borghi
13, Javier Martin
14, Sophie Courtade-Gaiani
1, Laura Xuereb
1, Mickaël Guedj
1, Philippe Moingeon
1, Marta E. Alarcón-Riquelme
4, Laurence Laigle
1& Jacques-Olivier Pers
2,3✉
There is currently no approved treatment for primary Sjögren ’ s syndrome, a disease that primarily affects adult women. The dif fi culty in developing effective therapies is -in part- because of the heterogeneity in the clinical manifestation and pathophysiology of the disease.
Finding common molecular signatures among patient subgroups could improve our under- standing of disease etiology, and facilitate the development of targeted therapeutics. Here, we report, in a cross-sectional cohort, a molecular classi fi cation scheme for Sjögren ’ s syn- drome patients based on the multi-omic profiling of whole blood samples from a European cohort of over 300 patients, and a similar number of age and gender-matched healthy volunteers. Using transcriptomic, genomic, epigenetic, cytokine expression and flow cyto- metry data, combined with clinical parameters, we identify four groups of patients with distinct patterns of immune dysregulation. The biomarkers we identify can be used by machine learning classi fi ers to sort future patients into subgroups, allowing the re-evaluation of response to treatments in clinical trials.
https://doi.org/10.1038/s41467-021-23472-7
OPEN
1Institut de Recherches Internationales Servier, Departments of Translational Medicine and Immuno-Inflammatory Diseases Research and Development, Suresnes, France.2LBAI, UMR1227, Univ Brest, Inserm, Brest, France.3CHU de Brest, Brest, France.4Department of Medical Genomics, Center for Genomics and Oncological Research (GENYO), Granada, Spain.5Reina Sofia Hospital, Maimonides Institute for Research in Biomedicine of Cordoba (IMIBIC), University of Cordoba, Cordoba, Spain.6Hospital Clinic, Institut d’Investigacions Biomèdiques August Pi i Sunyer, Barcelona, Catalonia, Spain.7Skeletal Biology and Engineering Research Center, KU Leuven and Division of Rheumatology, UZ Leuven, Belgium.8Scleroderma Unit, Referral Center for Systemic Autoimmune Diseases, Fondazione IRCCS Ca’Granda Ospedale Maggiore Policlinico di Milano, Milan, Italy.9Immunology & Allergy, University Hospital and School of Medicine, Geneva, Switzerland.10University of Szeged, Szeged, Hungary.11Klinik für Immunologie und Rheumatologie, Medical University Hannover, Hannover, Germany.12Pharmaceuticals Division, Bayer Pharma Aktiengesellschaft, Berlin, Germany.13Università degli studi di Milano, Milan, Italy.14Institute of Parasitology and Biomedicine López-Neyra, Consejo Superior de Investigaciones Científicas (IPBLN-CSIC), Granada, Spain.29These authors contributed equally: Perrine Soret and Christelle Le Dantec. *Lists of authors and their affiliations appear at the end of the paper.✉email:pers@univ-brest.fr
1234567890():,;
P rimary Sjögren’s syndrome (pSS) is a chronic, disabling, complex systemic autoimmune disease that mostly affects adult women and still lacks a specific therapy. Although the involvement of salivary and lachrymal glands is the hallmark of the disease, during pSS progression, various organs and systems can be involved including joints, lungs, kidneys, liver, nervous and musculoskeletal system1. Thus, the clinical spectrum of the disease ranges from a benign slowly progressive autoimmune exocrinopathy to a severe systemic disorder with significant symptom heterogeneity and scattered complications. The diag- nosis of pSS is currently based upon a combination of clinical, serological, histological, and functional parameters which are most often only satisfied at a late stage of the disease, i.e., when glandular dysfunction and symptoms already severely affect a patient’s overall quality of life. Moreover, one fifth of pSS patients may present major organ involvement with potentially severe end-organ damage
2and five percent of patients may also develop non-Hodgkin’s lymphoma
3. Primary SS is one of the few pro- totypic diseases to link autoimmunity, cancer development and infections, offering unique insights in many areas of basic science and clinical medicine. However, the pathogenesis of the disease remains elusive. Specifically, limited knowledge of existing pSS disease variants arguably represents the greatest obstacle to improve patients’ diagnosis and identify patients’ subsets in view of early stratification and personalized treatment
4. It was recently shown in the PRECISESADS IMI JU project that systemic autoimmune diseases exhibit a diverse spectrum and a complex nuanced or overlapping molecular phenotype with four clusters identified, representing ‘inflammatory’, ‘lymphoid’, ‘interferon’
and ‘healthy-like’ patterns each including all diagnoses and
defined by genetic, clinical, serological and cellular features
5. Many of them share susceptibility genes
6and an overexpression of interferon (IFN) inducible genes known as the IFN signature is observed in many of these patients
7. Such autoimmune diseases are driven by numerous environmental factors, therefore dis- playing a marked variability in their natural course as it relates to their initiation, propagation and flares.
The present study was undertaken to establish a precise molecular classification of patients affected by pSS into more homogeneous clusters whatever their disease phenotypes, activity or treatment. We report herein on the integrated molecular profiling of 304 pSS patients compared to 330 matched healthy volunteers (HV) performed using high-throughput multi-omics data collected within the PRECISESADS IMI JU project (genetic, epigenomic, transcriptomic, combined with flow cytometric data, multiplexed cytokines, as well as classical serology and clinical data). We identify 4 groups of patients with distinct patterns of immune dysregulation. The Cluster 1 (C1), C3 and C4 display a high IFN signature reflecting the pathological involvement of the IFN pathway, but with various Type I and II IFN gene enrich- ment. C1 has the strongest IFN signature with both Type I and Type II gene enrichment when compared to C3 (intermediate) and C4 (lower). C4 has a Type II gene enrichment stronger than Type I and equivalent to C3 while C3 has the opposite compo- sition. C2 exhibits a weak Type I and Type II IFN signature with no other obvious distinguishable profile relative to HV. We fur- ther characterized C1, C3 and C4 using multi-omics and clinical data. C1 patients present a high prevalence of SNPs, C3 patients an involvement of B cell component more prominent than in the other clusters and especially an increased frequency of B cells in the blood while C4 patients have an inflammatory signature driven by monocytes and neutrophils, together with an aberrant methylation status. Algorithms derived from machine learning discriminate the 4 clusters based on distinct biomarkers that can be easily used in a composite model to stratify patients in clinical trials. This composite model is validated by using an independent
inception cohort of 37 pSS patients. In conclusion, this work provides a clear understanding of pSS heterogeneity providing clinically and immunopathologically relevant signatures to guide precision medicine strategies. Decision trees coming from this patient classification have an immediate application to re-evaluate response to treatments in clinical trials.
Results
Four functional molecular clusters of pSS patients were iden- tified. Our initial study population comprised 382 pSS patients enrolled in the PRECISESADS cross-sectional study. Following complete quality control and diagnosis validation (each patient had to present either anti-SSA/Ro antibody positivity or focal lymphocytic sialadenitis with a focus score of ≥1 foci/mm
2), 78 patients were removed (Supplementary Fig. 1a–c). Patient char- acteristics are presented in Table 1. To perform the clustering of the remaining 304 samples, transcriptomics data were analyzed with a semi-supervised robust approach previously applied to breast cancer
8that iterates unsupervised and supervised steps and relies on the concordance between 3 methods of clustering (see Methods). Samples were divided into a discovery set and an independent validation set, representing 75 and 25% of samples, respectively. The discovery set allowed to cluster patients in four groups, as confirmed in the validation set (Fig. 1a). When the two sets were merged, Cluster 1 (C1) contained 101 patients (33.2%), Cluster 2 (C2) 77 patients (25.3%), Cluster 3 (C3) 88 patients (28.9%) and Cluster 4 (C4) 38 patients (12.5%). The supervised step allowed to select a subset of 257 top genes discriminating the 4 clusters of patients (Supplementary Fig. 2) and divided into 3 modules: M.a (105 genes), M.b (20 genes) and M.c (132 genes).
An enrichment analysis was used to annotate each gene module, showing that M.a was enriched in IFN signaling, M.b in lymphoid lineage pathways and M.c in inflammatory and myeloid lineage transcripts (Supplementary Fig. 3). C1, and to a lesser extent C3, presented overexpression of gene module M.a, whereas C3 showed overexpression of M.b as well and C4 strong over- expression of M.c (Fig. 1a). Because C2 had no obvious dis- cernible pattern, healthy volunteers (HV) were assigned to the 4 molecular clusters distance to centroids (Fig. 1b). When projected into the patient population, HV did not constitute a separate cluster but mainly matched with C2 (0.5%, 93%, 4% and 2.5% of HV merged with C1, C2, C3, and C4, respectively). This means that the C2 transcriptional signature is not different from HV, at least at the blood level. Interestingly, our data are consistent with the previous observation of a healthy-like patient group detected in a pooled population of 7 different autoimmune diseases
5.
We then assessed whether covariates like systemic treatments could drive the transcriptome-based clustering. Indeed, half of the pSS patients were treated with either anti-malarials, immuno- suppressants, or steroids at the time of the visit with a statistically significant difference in the distribution among the four clusters (p-values were respectively 0.002 for anti-malarials, <0.001 for immunosuppressants and steroids) (Table 2). When compared to the 3 other clusters, a higher proportion of patients treated with anti-malarials in C2 and a higher proportion of patients receiving immunosuppressants or steroids in C4 were observed. Impor- tantly, sensitivity analyses of treated versus untreated patients in each cluster showed no impact of treatments on cluster distribution (Supplementary Fig. 4).
In depth functional pathway analysis of individual pSS clusters.
To investigate molecular processes and their biological function
underlying each of the pSS patients’ clusters, specific differentially
expressed genes (DEG) signatures compared to HV were assessed
using Limma in the 4 clusters. Ingenuity Pathway Analysis (IPA)
was subsequently applied to determine the most significantly dysregulated canonical pathways with Benjamini–Hochberg false discovery rate (FDR) adjusted p-value ≤ 0.05 and absolute fold change (FC) ≥ 1.5. As a result, 284 DEG were found significant in C1, 301 DEG in C3 and 1686 DEG in C4 (Supplementary Data 1).
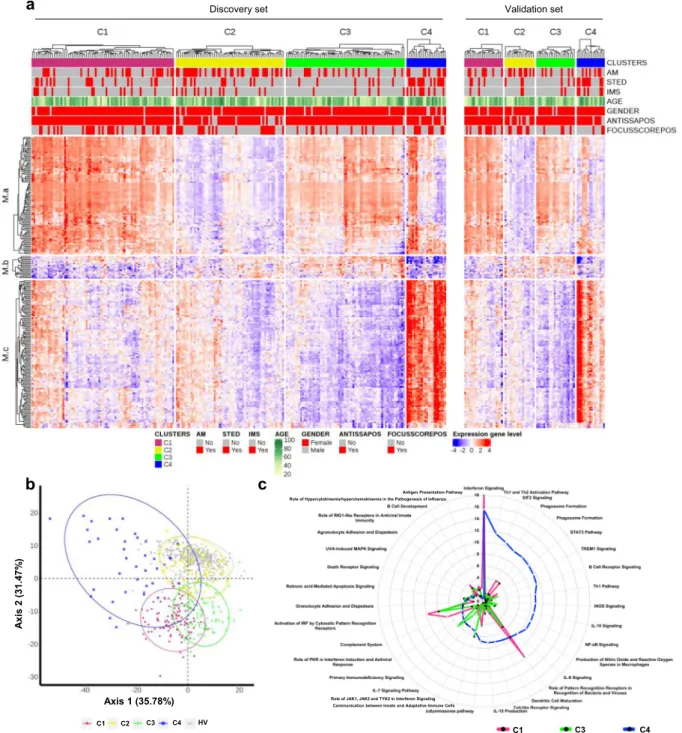
Since no DEG were noticed in C2 when compared to HV, only C1, C3, and C4 were functionally annotated. Top 20 significant canonical pathways within each DEG signature are presented in Supplementary Data 2 and pathways related to the most significantly enriched immunological responses are reported as radar plots in Fig. 1c. While all 3 clusters were enriched in genes involved in antiviral and anti-bacterial responses indicative of an innate-mediated activation profile, C1 was mainly enriched with IFN-related pathways including IFN signaling, role of pattern recognition receptors for bacteria and viruses and Interferon Regulatory Factor (IRF) activation. Notably, C3 and C4 were further characterized by alterations in biological networks linked to adaptive immunity. Specifically, significant activation of canonical pathways related to B cell activation such as B cell receptor signaling, and B cell development were observed in C3.
In addition, comparative analyses provided evidence for IL7- signaling up-regulation and LXR/RXR activation in C3 compared to C1.
Interestingly, C4 was the endotype with the highest number of DEG compared to HV with highly heterogeneous dysregulated canonical pathways. Ingenuity pathway analysis confirmed the activation of T and B lymphocyte related pathways reflecting Th1 and Th2 activation, B cell receptor signaling, together with
prominent inflammatory signatures most particularly linked to cytokine signaling (IL-6 and IL-10 signaling, IL-15 production, STAT-3 pathway).
Further upstream regulator analysis predicted significant activation of IFN-α in all three clusters, as well as CpG ODN in C3 and LPS, IFNγ, TNF-α, and IL-4 in C4, further highlighting B cell activity and inflammatory responses in C3 and C4, respectively.
Noteworthy, while C2 displayed no DEG compared to HV, 14 genes were differentially expressed in C2 patients positive for SSA antibodies compared to HV whereas only 2 DEG were found in SSA-negative C2 patients. These SSA-positive C2 patients were characterized by significant enrichment in IFN-related genes compared to HV including IFI44, IFI44L, IFI6, IFIFT1, IFIT3, ISG15, MX1, OAS3, SERPING1, and SIGLEC1 (Supplementary data 1).
To further characterize patient cluster variability at a molecular level, we then used the blood transcriptome modular repertoire recently established on an expended range of disease and pathological states. The latter includes 382 transcriptome modules based on genes co-expression patterns across 16 diseases and 985 unique transcriptome profiles
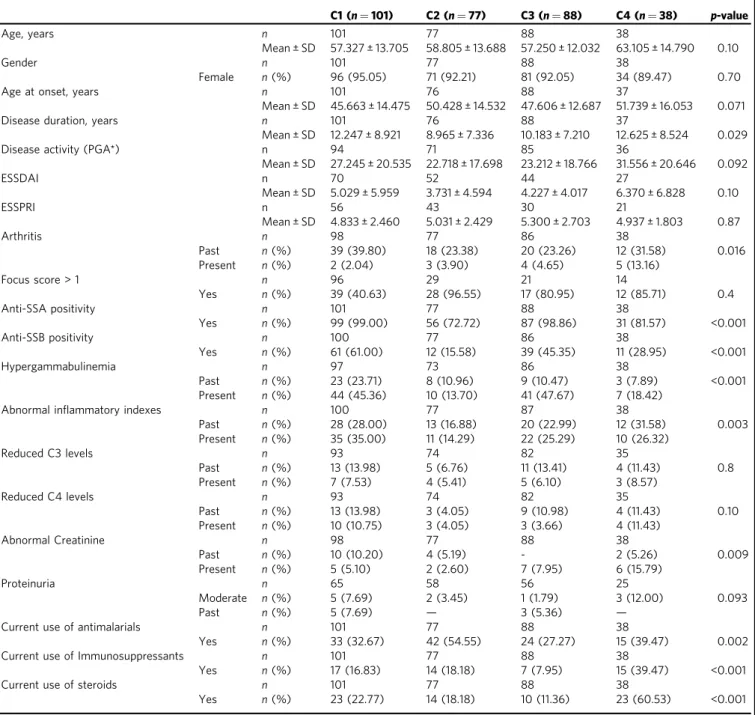
9. Again, no aggregate was found differentially expressed in C2 confirming the healthy-like profile of these patients, whereas an up-regulated IFN signature dominated in C1, C3, and C4 (Fig. 2). In C4, the most induced modules include genes associated with inflammation and neutrophils. As the highest inflammatory phenotype, C4 is associated with a hypercytokinemia/hyperchemokinemia
Table 1 Healthy volunteers (HV) and Primary Sjögren’s syndrome (pSS) patient characteristics.HV (N=330) pSS Discovery (N=227)
pSS Validation (N=77)
pSS All (N=304) Demography
Age n 330 227 77 304
Mean ± SD 53.294 ± 10.998
58.524 ± 13.440 58.039 ± 13.554 58.401 ± 13.448
Gender n 330 227 77 304
Female n(%) 302 (91.52) 211 (92.95) 71 (92.21) 282 (92.76)
Obesity (BMI >=30) n 328 218 74 292
Yes n(%) 24 (7.27) 30 (13.76) 3 (4.05) 33 (11.30)
Race n 330 227 77 304
Asian n(%) 2 (0.61) 1 (0.44) 1 (1.30) 2 (0.66)
Black/African American
n(%) — — 1 (1.30) 1 (0.33)
Caucasian/White n(%) 328 (99.39) 224 (98.68) 74 (96.10) 298 (98.03)
Other n(%) — 2 (0.88) 1 (1.30) 3 (0.99)
Diagnostic criteria
Focus score > 1 n — 82 27 109
Yes n(%) — 73 (89.02) 24 (88.89) 97 (88.99)
Anti-SSA positivity n — 227 77 304
Yes n(%) — 205 (90.30) 69 (89.61) 274 (90.13)
Disease activity Disease duration, years
n — 225 77 302
Mean ± SD — 10.788 ± 7.535 11.094 ± 9.620 10.866 ± 8.101
Disease activity (PGA*)
n — 211 75 286
Mean ± SD — 25.687 ± 18.976 24.840 ± 20.984 25.465 ± 19.488
ESSDAI (**) n — 133 60 193
Mean ± SD — 4.609 ± 5.358 4.850 ± 5.495 4.684 ± 5.388
ESSPRI (**) n — 106 44 150
Mean ± SD — 5.176 ± 2.286 4.568 ± 2.648 4.998 ± 2.405
n: Number of patients with available information.
(*) PGA: Physician Global Assessment.
(**) collected in a substudy.
observed in modules (M13.16, M15.84, M16.80) consistent with an upregulation of the TNF-associated module (M16.47) and a downregulation of the TGFβ-associated module (M16.65) (Fig. 2).
Some modules were under-expressed, such as those associated with both protein synthesis (M12.7, M11.1, M13.28, M14.80), B
cells (M13.27, M12.8) and T cells (M15.38, M14.42, M12.6).
Genes mainly overexpressed in C1 were also implicated in inflammatory responses and neutrophils (A33, A35), in parallel with down-regulated B and T cell signatures (Supplementary Fig. 5). Moreover, distinct sub-modules expressed in opposite
Discovery set Validation set
Axis 1 (35.78%)
Axis 2 (31.47%)
C1 C2 C3 C4 HV
a
c b
C1 C3 C4
Role of JAK1, JAK2 and TYK2 in Interferon Signaling Communication between Innate and Adaptative Immune Cells
Antigen Presentation Pathway Role of Hypercytokinemia/hyperchemokinemia in the Pathogenesis of Influenza
Fig. 1 Molecular pattern distribution is represented by 4 clusters of pSS patients with different canonical pathways. aHeatmap performed for 304 pSS patients (Discovery set: 227, Validation set: 77) showing the distribution of gene transcripts across the 4 clusters. In columns patients are grouped by cluster assignment and in rows genes are grouped by functional modules. Each subset of patients (discovery set on the left and validation set on the right) is presented separately. Red represents overexpression and blue represents under-expression. At the top of thefigure annotations show: each of the treatment groups for each individual (AM: antimalarials, STED: steroids and IMS: immunosuppressors, red represents patients with treatment and gray represents patients without treatment), age (levels of yellow to green with yellow for younger patients and dark green for older patients), gender (red represents woman and gray represents man), ANTISSAPOS: anti-SSA/Ro antibody positivity, FOCUSSCOREPOS: focus score of≥1 foci/mm2(red represents focus score of≥1 foci/mm2and gray represents focus score of <1 foci/mm2).bScatterplot of thefirst two components PCA (performed for 304 pSS patient and 330 HV) model showing clearly defined clusters in signature gene. HV (gray dot) are confused with C2 cluster (yellow dot).cTop 20 most significant canonical pathways for each cluster. Radar plots are represented according to‒log (p-value) (Fisher’s exact test) associated to the most significant pathways of each cluster; C1 (pink), C3 (green), C4 (blue).
directions allows to functionally discriminate C1 and C3. Patients from C3 demonstrated a significant under-expression of modules related to erythrocytes (A37; M9.2, M11.3) and cytokines/
chemokines (A35; M15.84, M13.16) and an increased expression in some of the B cell modules (A1; M12.8) (Supplementary Fig. 5 and Fig. 2).
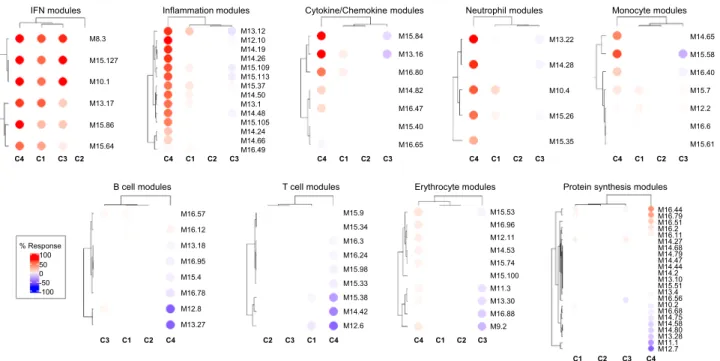
IFN signatures. Consistent with the literature, the most sig- nificantly enriched pathway confirmed to be up-regulated in all three clusters was the IFN signaling pathway (Fig. 2, Supple- mentary Fig. 5). In SLE, Chiche et al. have previously identified three strongly up-regulated IFN-annotated modules (M1.2, M3.4, and M5.12) from peripheral blood transcriptomic data, with for each module a distinct activation threshold
10. Genes within the
M1.2 module are induced by IFNα, while other genes from both M1.2 and M3.4 are up-regulated by IFNβ, corresponding to a type I IFN signature. The M5.12 genes are poorly induced by IFNα and IFNβ alone but are rather up-regulated by IFNγ characterizing a type II IFN signature
11. Moreover, transcripts belonging to M3.4 and M5.12 were only fully induced by a combination of Type I and Type II IFNs. Kirou et al. made similar observations and identified genes preferentially induced by IFNα or IFNγ
12. The different z-scores were then calculated accordingly to characterize further the IFN signature observed in the various clusters (Fig. 3). All IFN z-scores were increased to some extent in C2 when compared to HV. In line with the strong signal observed, C1 patients had the highest Type I and type II scores. Interestingly, C3 had higher Type I IFN score than C4 but these 2 clusters were not different for Type II IFN score.
Table 2 Descriptive analysis of the clinical parameters by primary Sjögren’s syndrome cluster.
C1 (n=101) C2 (n=77) C3 (n=88) C4 (n=38) p-value
Age, years n 101 77 88 38
Mean ± SD 57.327 ± 13.705 58.805 ± 13.688 57.250 ± 12.032 63.105 ± 14.790 0.10
Gender n 101 77 88 38
Female n(%) 96 (95.05) 71 (92.21) 81 (92.05) 34 (89.47) 0.70
Age at onset, years n 101 76 88 37
Mean ± SD 45.663 ± 14.475 50.428 ± 14.532 47.606 ± 12.687 51.739 ± 16.053 0.071
Disease duration, years n 101 76 88 37
Mean ± SD 12.247 ± 8.921 8.965 ± 7.336 10.183 ± 7.210 12.625 ± 8.524 0.029
Disease activity (PGA*) n 94 71 85 36
Mean ± SD 27.245 ± 20.535 22.718 ± 17.698 23.212 ± 18.766 31.556 ± 20.646 0.092
ESSDAI n 70 52 44 27
Mean ± SD 5.029 ± 5.959 3.731 ± 4.594 4.227 ± 4.017 6.370 ± 6.828 0.10
ESSPRI n 56 43 30 21
Mean ± SD 4.833 ± 2.460 5.031 ± 2.429 5.300 ± 2.703 4.937 ± 1.803 0.87
Arthritis n 98 77 86 38
Past n(%) 39 (39.80) 18 (23.38) 20 (23.26) 12 (31.58) 0.016
Present n(%) 2 (2.04) 3 (3.90) 4 (4.65) 5 (13.16)
Focus score > 1 n 96 29 21 14
Yes n(%) 39 (40.63) 28 (96.55) 17 (80.95) 12 (85.71) 0.4
Anti-SSA positivity n 101 77 88 38
Yes n(%) 99 (99.00) 56 (72.72) 87 (98.86) 31 (81.57) <0.001
Anti-SSB positivity n 100 77 86 38
Yes n(%) 61 (61.00) 12 (15.58) 39 (45.35) 11 (28.95) <0.001
Hypergammabulinemia n 97 73 86 38
Past n(%) 23 (23.71) 8 (10.96) 9 (10.47) 3 (7.89) <0.001
Present n(%) 44 (45.36) 10 (13.70) 41 (47.67) 7 (18.42)
Abnormal inflammatory indexes n 100 77 87 38
Past n(%) 28 (28.00) 13 (16.88) 20 (22.99) 12 (31.58) 0.003
Present n(%) 35 (35.00) 11 (14.29) 22 (25.29) 10 (26.32)
Reduced C3 levels n 93 74 82 35
Past n(%) 13 (13.98) 5 (6.76) 11 (13.41) 4 (11.43) 0.8
Present n(%) 7 (7.53) 4 (5.41) 5 (6.10) 3 (8.57)
Reduced C4 levels n 93 74 82 35
Past n(%) 13 (13.98) 3 (4.05) 9 (10.98) 4 (11.43) 0.10
Present n(%) 10 (10.75) 3 (4.05) 3 (3.66) 4 (11.43)
Abnormal Creatinine n 98 77 88 38
Past n(%) 10 (10.20) 4 (5.19) - 2 (5.26) 0.009
Present n(%) 5 (5.10) 2 (2.60) 7 (7.95) 6 (15.79)
Proteinuria n 65 58 56 25
Moderate n(%) 5 (7.69) 2 (3.45) 1 (1.79) 3 (12.00) 0.093
Past n(%) 5 (7.69) — 3 (5.36) —
Current use of antimalarials n 101 77 88 38
Yes n(%) 33 (32.67) 42 (54.55) 24 (27.27) 15 (39.47) 0.002
Current use of Immunosuppressants n 101 77 88 38
Yes n(%) 17 (16.83) 14 (18.18) 7 (7.95) 15 (39.47) <0.001
Current use of steroids n 101 77 88 38
Yes n(%) 23 (22.77) 14 (18.18) 10 (11.36) 23 (60.53) <0.001
n: Number of patients with available information, (*) PGA: Physician Global Assessment.
Statistical tests performed: chi-square test of independence for categorial variable and Kruskal–Wallis test for continue variable.
Upstream analysis of C4 DEG predicted IFNγ as an important regulator suggesting that Type II IFN activation was prominent in C4.
Genome-wide association study analysis. We investigated whe- ther clusters showed any differences in the genetic contribution of risk alleles known to be associated with pSS
13–15. Even in the mid-size cohort of patients analyzed (304 pSS and 330 HV), we unambiguously detected (with signals genome wide significance level <5 × 10
−8) 35 single nucleotide polymorphisms (SNPs) in C1 compared to only six in C3 and one in C4 (Fig. 4a, Supple- mentary Data 3). Interestingly, no significant enrichment was found in C2. The 35 SNPs assessed in C1 are found within genes associated with either the immune system (HLA-DQB1, HLA- DQA1, HLA-DRA, HLA-C, HLA-G), signal transduction (NOTCH4), developmental biology (POU5F1), gene expression (DDX39B) or cell cycle (TUBB). The presence of such significant genetic associations was already found in clusters of systemic autoimmune disease patients whose molecular disease pathway is the Type I IFN pathway
5. Moreover, a strong association of SNPs with HLA class II genes was reported in SLE patients with a high level of autoantibodies
16. One SNP (rs2734583) was common to C1 and C3 and is associated to the DDX39 gene. Of note, DDX39B, the protein encoded by this gene, is required for the prevention of dsRNA formation during influenza A virus infec- tion, thereby preventing the activation of the Type I IFN system
17. The five others SNPs in C3 are nearby HLA-DQA, HLA-DRA (2 SNPs), BTNL2 and HCG23. The only SNP (rs2247056) found in C4, also common with C1, is located in intron 1 of the LINC02571 gene and was previously associated with a risk for developing SLE.
Linkage disequilibrium is a non-random association of alleles at different loci in a given population. When analyzing linkage disequilibrium (Fig. 4b) in the loci of the 35 SNPs detected in C1
and located on chromosome 6 (from base 29809362 to 32681631), three SNPs were strongly associated in HLA-DQA1 locus (rs9272219, rs9271588, rs642093), five SNPs in HLA-DRA | HLA-DQA1 locus (rs7195, rs1041885, rs3129890, rs9269043, rs7749057) and three SNPs in HCG27 | HLA-C locus (rs3130473, rs2394895 and rs3130467). Two other regions contain strongly associated SNPs. The NOTCH4 | C6orf10 locus presented 5 associated SNPs (rs3130347, rs204991, rs3132935, rs7751896, rs9268220) as well as the IER3 | DDR1 locus (rs3094122, rs6911628, rs3094112, rs2517576, rs3095151).
Methylation analysis. The methylation analysis was performed with a Benjamini Hochberg FDR < 0.1 and absolute ΔBeta >
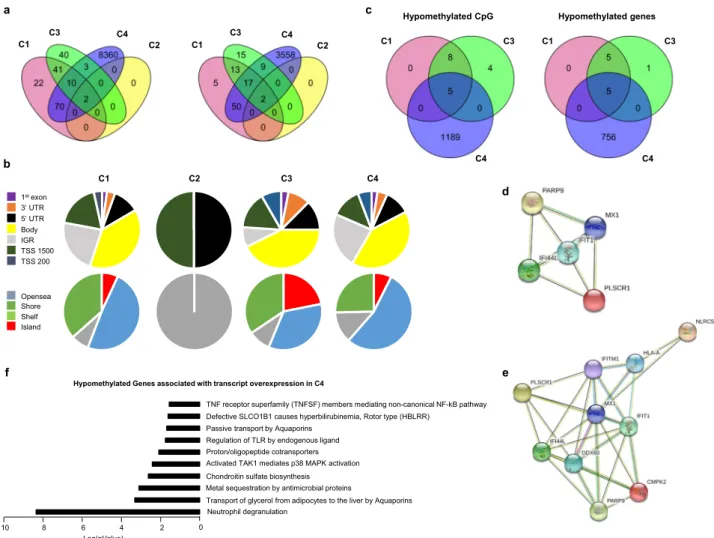
0.075. Only two differentially methylated positions (DMPs) cor- responding to two genes were found in C2. Those DMPs were common with the 3 other clusters (Fig. 5a) and were located in the TSS1500 shore of the NLRC5 gene and in the 5’UTR of the gene encoding MX1, two genes involved in the IFN signature.
NLRC5 plays a role in cytokine response and antiviral immunity through inhibition of NF-kappa-B activation and negative reg- ulation of Type I IFN signaling pathways
18. MX1 encodes an IFN induced dynamic-like GTPase with antiviral activity which was proposed as a clinically applicable biomarker for identifying systemic Type I IFN in pSS
19.
145 DMPs corresponding to 87 genes and 96 DMPs corresponding to 56 genes were found in C1 and C3 respectively, whereas an aberrant methylation status with 8,445 DMPs corresponding to 3,636 genes characterized C4 (Fig. 5a). In order to test whether the methylation defect in C4 was associated with steroids treatment, we compared the 9 untreated to the 17 treated patients. No CpG with a Benjamini-Hochberg FDR adjusted p- value < 0.1 was found to be differentially methylated in treated versus untreated patients. A global hypomethylation of CpG was observed for all clusters (89.6% in C1, 100% in C2, 67.7% in C3
IFN modules Inflammation modules Cytokine/Chemokine modules Neutrophil modules Monocyte modules
B cell modules T cell modules Erythrocyte modules Protein synthesis modules
C4 C1 C3 C2 C4 C1 C2 C3 C4 C1 C2 C3 C4 C1 C2 C3 C4 C1 C2 C3
C3 C1 C2 C4 C2 C3 C1 C4 C4 C1 C2 C3
C1 C2 C3 C4
% Response 100 50
-100 -50 0
M8.3 M15.127 M10.1 M13.17 M15.86 M15.64
M13.12 M12.10
M15.37 M14.50
M14.24 M16.49 M14.19 M14.26 M15.109 M15.113
M13.1 M14.48 M15.105 M14.66
M16.44 M16.79
M14.2 M13.4
M14.75 M14.80 M16.51 M16.11 M14.27 M14.47
M16.56 M10.2 M16.68 M14.58 M16.2 M14.68 M14.79 M14.44 M13.10 M15.51
M13.28 M11.1 M12.7 M15.53
M15.100
M13.30
M9.2 M16.96 M12.11
M15.74
M11.3
M16.88 M14.53 M15.9
M15.33
M14.42 M15.34 M16.3
M15.98
M15.38
M12.6 M16.24 M16.57
M16.78
M13.27 M16.12 M13.18
M15.4
M12.8 M16.95
M15.84 M13.16 M16.80 M14.82 M16.47 M15.40 M16.65
M13.22
M14.28
M10.4
M15.26
M15.35
M14.65 M15.58 M16.40 M15.7 M12.2 M16.6 M15.61
Fig. 2 Patterns of abundance of the different modules distinguish the four pSS clusters.Each heatmap, achieved with BloodGen3Module R package9, represents one of the most significant patterns differentiating the four clusters of 304 pSS patients (C1: 101, C2: 77, C3: 88, and C4: 38) compared to 330 healthy volunteers (HV). These patterns correspond to modules associated with IFN, neutrophils, inflammation, cytokines/chemokines, protein synthesis, erythrocytes, monocytes, B cells and T cells. Columns on this heatmap corresponds to clusters. Each row corresponds to one of the modules associated with the pattern. For each module, the percentage of increased genes (from 0 to 100) and decreased genes (from 0 to 100) were calculated. A red spot on the heatmap indicates an increase in abundance of transcripts comprising a given module for a given cluster. A blue spot indicates a decrease in abundance of transcripts. The absence of color indicates no changes.
a
M1.2b
M3.4c
M5.12IFNα module IFNγ module
d e
C1 C2 C3 C4 HV C1 C2 C3 C4 HV C1 C2 C3 C4 HV
C1 C2 C3 C4 HV C1 C2 C3 C4 HV
z-scorez-score
0 5 10 15
0 5 10 15
0 4 8 12
0 5 10 15
0 5 10
Fig. 3 The 4 pSS clusters show typical IFN signature according to modular IFN z-scores.IFN score analyses were performed for 304 pSS patients and 330 healthy volunteers (HV). Repartition of samples from the 4 pSS clusters are shown according to the most characterized IFN module z-scores. The genes (IFI44,IFI44L,IFIT1andMX1) of the M1.2 module (a) are induced by IFNα, while genes from both M1.2 and M3.4 (b) (ZBP1,IFIH1,EIF2AK2,PARP9 andGBP4) are up-regulated by IFNβ.cThe genes (PSMB9,NCOA7,TAP1,ISG20andSP140) from the M5.12 module are poorly induced by IFNαand IFNβ alone while they are up-regulated by IFNγ. Moreover, transcripts belonging to M3.4 and M5.12 were only fully induced by a combination of Type I and Type II IFNs10. Other modules identified genes preferentially induced by IFNα(IFIT1,IFI44andEIF2AK2) (d) or IFNγ(IRF1,GBP1andSERPING1) (e)12. Two-tailed pairwise Wilcoxon-rank sum test results are shown. Plots show median with error bars indicating ± interquartile range.
rs1611133 rs3132584rs3094122 rs6911628rs3094112 rs2517576rs3095151 rs3094220rs887468 rs3130467rs3130473 rs2394895rs2247056 rs2507997rs2523544 rs3094228rs2734583 rs3115663rs1144708 rs3130347rs204991 rs3132935rs7751896 rs9268220rs7195 rs1041885rs3129890 rs9269043rs7749057 rs642093rs9271588 rs9272219rs9273363 rs9275596kgp8226585 kgp8226585
rs9275596 rs9273363 rs9272219 rs9271588 rs642093 rs7749057 rs9269043 rs3129890 rs1041885 rs7195 rs9268220 rs7751896 rs3132935 rs204991 rs3130347 rs1144708 rs3115663 rs2734583 rs3094228 rs2523544 rs2507997 rs2247056 rs2394895 rs3130473 rs3130467 rs887468 rs3094220 rs3095151 rs2517576 rs3094112 rs6911628 rs3094122 rs3132584 rs1611133
HLA-DRA|HLA-DQA1
NOTCH4|C6orf10
HCG27|HLA-C
IER3|DDR1 HLA-DQA1
b
-log10 (p-value)
-log10 (p-value) -log10 (p-value)
-log10 (p-value)
Chromosomes Chromosomes
a
C1 C2
C3 C4
1 0.8 0.6
0 0.2 0.4 R2
Fig. 4 Cluster genome-wide association analyses (GWAS).GWAS analysis was performed using Plink, an open-source whole genome association analysis toolset, using a logistical regression for 304 pSS (C1: 101, C2: 77, C3: 88 and C4: 38) patients and 330 healthy volunteers (HV) and each cluster was compared to HV.aManhattan plots for each cluster are shown.bLinkage disequilibrium analysis in the loci of the 35 SNPs detected in C1 and located on chromosome 6 from base 29809362 to base 32681631. TheR2correlation coefficient and linkage disequilibrium heatmap were obtained with Plink, and oncofunco R package, respectively. Strongest associations between SNPs are annotated.
and 80.4% in C4). Because functionally important DNA methylation occurs in promoter regions and in CpG islands
20, DMP distribution across the different genomic regions was investigated (Fig. 5b). A higher representation of DMPs in the promoter region was found in C3 (36.4%) and C1 (33.1%) when compared to C4 (29.1%). The consequence was a lower representation of DMPs in intergenic regions for C3 (8.8%) compared to C1 (22.8%) and C4 (23.1%). To gain insight on this pattern, we divided the probes according to CpG islands; shores (regions up to 2 kb from CpG island), shelves (regions from 2 to 4 kb from CpG island) and open sea (the rest of the genome).
Interestingly, 21.8% of the DMPs for C3 were located in CpG islands versus 6.9 and 7.4% for C1 and C4, respectively.
To identify the most robust and significant signature of hypo- and hyper-methylated genes, we fixed the ΔBeta cut-off at 0.15.
Regarding hypomethylated CpGs, 13 DMPs were found in C1, 17 in C3 and 1,194 in C4, corresponding to 10, 11 and 761 hypomethylated genes, respectively. Five genes with hypomethy- lated DMPs were common to these 3 clusters (IFI44L, IFIT1, MX1, PARP9 and PLSCR1) (Fig. 5c), corresponding to genes
reported to present strong interactions (Fig. 5d). Interestingly, these genes were also significantly hypomethylated in C2 when compared to HV (Supplementary Fig. 6). Of note, 5 additional genes (HLA-A, DDX60, CMPK2, IFITM1 and NLRC5) were common to C1 and C3 and were also strongly associated with the previous ones, reinforcing the IFN signature in these two clusters (Fig. 5e). These common 10 hypomethylated genes are implicated in defense responses to virus and are induced by IFN
21.
The remaining 756 hypomethylated genes in C4 were mainly associated with the neutrophil degranulation pathway. Regarding hypermethylated CpGs, 41 DMPs corresponding to 25 genes were only found in C4. Those genes are mainly implicated in translocation of ZAP-70 to the immunological synapse, phos- phorylation of CD3 chains including zeta, platelet activation, signaling and aggregation, homeostasis and PD-1 signaling.
Combining transcriptomic (FC ≥ 1.5) and methylomic (abso- lute ΔBeta > 0.15) analyses, the transcripts of 8, 8 and 126 genes were found to be increased in association with a decreased methylation status in C1, C3 and C4, respectively. Interestingly, the previously isolated 5 common hypomethylated genes
Body 5’ UTR 3’ UTR 1stexon
IGR TSS 1500 TSS 200
Island Shelf Shore Opensea
C1 C2 C3
d
e f
Hypomethylated Genes associated with transcript overexpression in C4
TNF receptor superfamily (TNFSF) members mediating non-canonical NF-kB pathway
Transport of glycerol from adipocytes to the liver by Aquaporins
10 8 6 4 2 0
Defective SLCO1B1 causes hyperbilirubinemia, Rotor type (HBLRR) Passive transport by Aquaporins
Regulation of TLR by endogenous ligand Proton/oligopeptide cotransporters Activated TAK1 mediates p38 MAPK activation Chondroitin sulfate biosynthesis Metal sequestration by antimicrobial proteins
Neutrophil degranulation
Log(pValue)
b
C4
C4 C3 C1
Hypomethylated genes
c
C4
C1 C3
Hypomethylated CpG
C1
C3 C4
C2
a
C1
C3 C4
C2
Fig. 5 Methylation analysis confirms the strong IFN signature in C1 and C3 and reveals an aberrant methylation status in C4.Whole blood methylation analysis was performed for 226 pSS patients (C1: 81, C2: 57, C3: 62, and C4: 26) and 175 healthy volunteers (HV) doing pairwise comparisons between each cluster and HV.aVenn diagram showing the overlap of differentially methylated CpG sites and genes between the 4 clusters with absoluteΔBeta >
0.075.bDMP distribution across the different genomic regions (gene body, 3’UTR, intergenic (IGR), 5’UTR, Exon 1, TSS 1500 and TSS 200; and according to the CpG density to CpG island, shelf, shore, and open sea.cVenn diagram showing the overlap of hypomethylated CpG and genes with absoluteΔBeta
> 0.15 between the three IFN clusters.dInteraction network of these 5 genes common to the three clusters by STRING analysis with a confidence cut-off of 0.4 reveals a common IFN signature.eInteraction network of the 10 genes hypomethylated common to C1 and C3 by STRING analysis with a confidence cut-off of 0.4.fReactome analysis22of the functional pathways enriched for the 126 genes hypomethylated and over expressed in C4 (absoluteΔBeta >
0.15, FC≥1.5).
implicated in IFN signaling were also overexpressed at the transcriptional levels in the 3 clusters. Transcript overexpression was strongly associated with hypomethylation in C1 (8/10) and C3 (8/11) and to a less extend in C4 (126/761). Among the 126 genes from C4, 21 were implicated in neutrophil degranulation which constitutes the most relevant pathways according to Reactome Pathway Database
22(Fig. 5f). Only 6/25 transcripts were repressed in association with an increased methylation status of their genes in this cluster (CD247, CD3G, CDC25B, CXCR6, TBC1D4, UBASH3A).
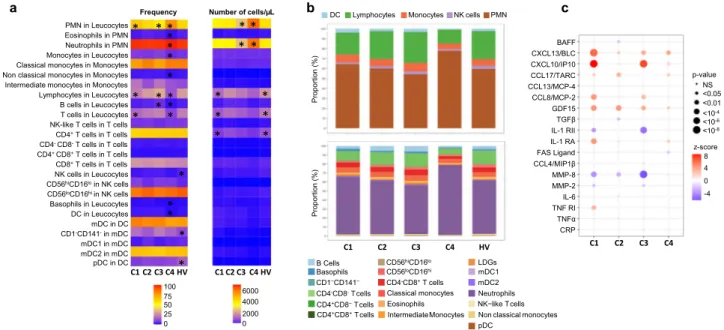
Flow cytometry analysis. As significant alterations in patterns of peripheral blood leukocytes have been previously described
23,24, we then investigated the composition of leukocyte subsets in the various clusters. (Fig. 6a, b, Supplementary Fig. 7). In C2, the frequency and absolute numbers were similar to HV in all the different subsets analyzed. An increase in the frequency of monocytes and lymphocytes characterized C3, in association with a marked increase in the frequency of B cells. At the same time, a lymphopenia affecting mainly T cells was found in C1. Finally, the most distinguishable cluster in terms of distribution and absolute number of cells is C4. Specifically, C4 was characterized by higher percentages and absolute numbers of PMN (especially neutrophils) in peripheral blood in comparison with those in other clusters and HV. Conversely, the percentages of lympho- cytes (B and T cells) and monocytes were markedly decreased in C4 compared to either the controls or the other clusters. Finally, lower frequencies and absolute numbers of basophils and DCs were also found in this cluster.
An in-depth analysis of the different cell subpopulations was then conducted. First, monocytes represent a heterogeneous cell population in terms of both phenotype and function. Based on
the expression of CD14 and CD16, 3 monocyte subsets can be defined, including classical (CD14
++CD16
–), intermediate (CD14
++CD16
+) and non-classical (CD14
+CD16
++). Classical monocytes are critical for the initial inflammatory response, can differentiate into macrophages in tissue and contribute to chronic disease. Intermediate monocytes are highly phagocytic cells that produce high levels of ROS and inflammatory mediators. Non classical monocytes have been widely viewed as anti-inflammatory, as they maintain vascular homeostasis and constitute a first line of defense in recognition and clearance of pathogens
25. Interestingly, the frequency and absolute number of intermediate monocytes were increased in C1 and C3 whereas the frequency of classical monocytes was decreased when compared to the 2 others and the nonclassical subset was markedly decreased in C4, in line with the inflammatory response observed in these different clusters.
Second, NK cells are defined by the expression of CD56 and the lack of CD3-TCR complex. Moreover, based on CD16 and CD56 expression levels, they are classified in two subsets:
CD56
hiCD16
loand CD56
loCD16
hi. The latter NK cell subset mediates natural and antibody-dependent cellular cytotoxicity, exhibiting high levels of perforin and enhanced killing. In contrast, CD56
hiCD16
loNK cells are characterized by low levels of perforin, and are primarily specialized for cytokine production including IFN
26,27. Accordingly, the frequency of CD56
hiCD16
loNK cells subset over CD56
loCD16
hiwas increased in C4, C1, C3 and to a lower extent in C2. This may partly explain the up- regulation of cytokines and interferon pathways in disease clusters. Although plasmacytoid dendritic cells (pDCs) are thought to represent the main IFNα producing cells, no differences were observed between clusters and their reduction was confirmed in peripheral blood of pSS patients when compared to HV
28.
b DC Lymphocytes Monocytes NK cells PMN c
C1 C2 C3 C4
Proportion (%)
BAFF
CCL4/MIP1β CXCL13/BLC CXCL10/IP10 CCL17/TARC CCL13/MCP-4 CCL8/MCP-2 GDF15 TGFβ IL-1 RII IL-1 RA FAS Ligand MMP-8 MMP-2 IL-6 TNF RI TNFα CRP PMN in Leucocytes
Eosinophils in PMN Neutrophils in PMN Monocytes in Leucocytes Classical monocytes in Monocytes Non classical monocytes in Monocytes Intermediate monocytes in Monocytes Lymphocytes in Leucocytes B cells in Leucocytes T cells in Leucocytes NK-like T cells in T cells CD4+T cells in T cells CD4-CD8-T cells in T cells CD4+ CD8+T cells in T cells CD8+T cells in T cells NK cells in Leucocytes CD56hiCD16loin NK cells CD56loCD16hi in NK cells Basophils in Leucocytes DC in Leucocytes mDC in DC CD1-CD141-in mDC mDC1 in mDC mDC2 in mDC pDC in DC
Frequency Number of cells/μL
C1 C2 C3 C4 HV C1 C2 C3 C4 HV
*
* *
*
*
*
*
* a
*
*
C1 C2 C3 C4 HV
Proportion (%)
NS
<0.05
<0.01
<10-4
<10-6
<10-8
8 4
-4 0 p-value
z-score
B Cells
CD4+CD8−T cells
Classical monocytes
pDC CD4-CD8-T cells
CD1−CD141− Basophils
CD4-CD8+T cells CD56loCD16hi CD56hiCD16lo
CD4+CD8+T cells
mDC1 LDGs
IntermediateMonocytes Eosinophils
mDC2 Neutrophils NK−like T cells Non classical monocytes 100
75 50 25
0 0
2000 4000 6000
* * **
*
* *
*
*
*
*
*
*
*
***
*
*
Fig. 6 Cell subset distribution in blood and cytokines, chemokines and inflammatory mediators in serum in the 4 clusters and healthy volunteers (HV).
aFlow cytometry analysis was performed for 283 patients (C1: 96, C2: 71, C3: 80, and C4: 36) and 309 HV. The 2 heatmaps show the mean distribution of blood cell subsets in frequency (0–100%) and in absolute numbers (perµL of blood) across the 4 clusters and HV assessed byflow cytometry. Columns represent clusters and HV and rows the different cell subsets. The asterisk means that the cluster (or HV) is statistically different from all the others.
bFlow cytometry data represented by bar charts cell types proportion per cluster.cSerum mediators were analyzed for 192 pSS patients (C1: 67, C2:48, C3: 61, C4:16) and 171 HV. Patient and HV distribution according to each analyzed variable is described in Methods. CXCL13/BLC, FAS Ligand, GDF-15, CXCL10/IP-10, CCL8/MCP-2, CCL13/MCP-4, CCL4/MIP-1β, MMP-8, CCL17/TARC, IL-1 RII, TNF-RI, and IL1-RA were measured using the Luminex system and expressed as pg/ml. Soluble MMP-2, CRP, TNFα, IL-6, BAFF, and TGFβwere measured by the quantitative sandwich enzyme immunoassay technique and expressed as pg/ml. Cytokine or chemokine concentration levels for each cluster were compared to HV. Statistical significance is determined using a one-way ANOVA followed by post-hoc Tukey’s test. The significance between the cluster and HV is represented as bullet ranging from small (non- significant) to big (significant). The direction of the association is shown as the z-score where red bullet is up-regulated, and blue bullet is down-regulated.
Cytokine analysis. We subsequently assessed whether pSS clus- ters also showed differences in systemic parameters of inflam- mation, such as cytokines, chemokines and other soluble factors (Fig. 6c and Supplementary Fig. 8). The IFNγ-induced protein (CXCL10/IP-10) as well as CCL8/MCP-2 and TNFα were increased in C1 and C3, i.e. the two main clusters associated with a strong IFN signature. At the same time, IL-1 RII, the decoy receptor for cytokine belonging to the IL-1 family, was down regulated in C1 and C3. Overall, C1 was largely enriched in CXCL13/BLC, IL-6, and IL-1RA. Levels of MMP-8, a protease mainly expressed by neutrophils, were not different from HV in C4 but lower in the other clusters. Of note, many cytokines such as CXCL10/IP-10, CXCL13/BLC, BAFF, and GDF15 were increased in all clusters including C2 when compared to HV.
However, no differences between clusters were found for CRP, Fas Ligand, CCL13/MCP-4, CCL4/MIP-1β, CCL17/TARC and TGFβ.
To confirm that patients with an active IFN signature have elevated circulating Type I IFN, we measured levels of IFNα in plasma using Simoa Single Molecule Array Technology in pSS patients and HV. Median levels of IFNα in plasma were 807 (177–1744) fg/ml and 530 (106–1033) fg/ml in C1 and C3, respectively, while circulating levels in the other clusters and HV were close to the lower limit of quantification (Supplementary Fig. 9a). Interestingly, IFNα in serum was positively correlated with the two IFN transcriptomic modules (M1.2 and IFNα module) described in Fig. 3, especially in C1 and to a lesser extent in C3, confirming the Type I IFN signature observed in these patients (Supplementary Fig. 9b). Of note, half of the patients in C2 received antimalarials and previous studies have also shown that hydroxychloroquine use can reduce the levels of circulating Type I
29,30and Type II
31,32; IFN z-scores. IFNα in serum was not associated with ESSDAI (Supplementary Fig. 9b) but higher levels of serum IFNα were associated with hematological and biological domains of ESSDAI (Supplementary Data 4).
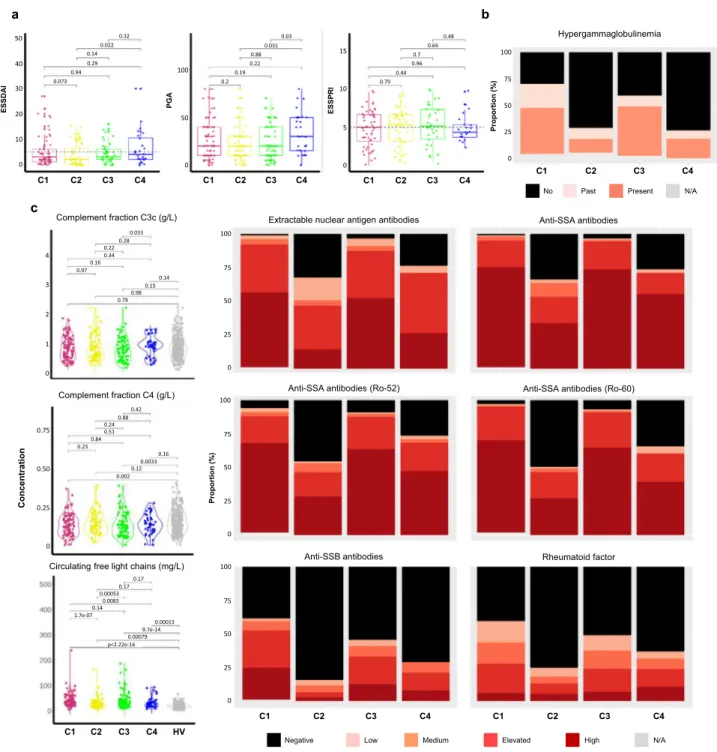
Clinical symptoms and serological characteristics. Patient medical history and disease characteristics including clinical and serological parameters were collected for the 304 pSS patients.
Details are displayed in Table 2 and Supplementary Data 5.
Patients from C2 had a lower disease duration when compared to patients from other clusters.
Although the Physician Global Assessment (PGA) was collected for the whole population, ESSDAI and ESSPRI were only assessed in expert centers (Barcelona, Brest, Cordoba, Geneva, Hannover, Leuven, Milano, Porto and Szeged) in a subset of 193 and 150 respectively of the 304 pSS studied patients (70/
101 and 56/101 from C1, 52/77 and 43/77 from C2, 44/88 and 30/
88 from C3 and 27/38 and 21/38 from C4, Supplementary Data 5).
The lowest mean ESSDAI score was observed in C2 and the highest ESSDAI and PGA mean scores in C4 (Table 2, Fig. 7a) but there were no statistically significant differences between the 4 clusters. No clear difference in the ESSDAI components nor in the objective measures of ocular and salivary dryness was observed between the 4 clusters. Moreover, there was no significant difference for the global ESSPRI score and its 3 components (i.e. dryness, pain and fatigue) except between SSA- positive C2 patients who reported lower ESSPRI scores (p-value <
0.001) compared to the SSA-negative patients (Supplementary Data 6).
Statistically significant differences in the distribution of reported arthritis (p-value = 0.016), rate of cancer history (p- value = 0.028), coronary artery disease (p-value = 0.002) and chronic obstructive pulmonary disease (p-value = 0.016) were
observed between the four clusters. (Supplementary Data 7).
Interestingly, patients from C4 reported more severe clinical symptoms compared to the 3 other clusters.
Some serological characteristics were significantly different across the 4 clusters, hypergammaglobulinemia (p-value < 0.001) (Table 2), extractable nuclear antigen (ENA) antibodies (p-value
<0.001), the presence of serum anti-SSA52/anti-SSA60 autoanti- bodies (p-value < 0.001) and higher circulating kappa and lambda free light chains (cFLC) (p-value < 0.001) (Fig. 7b, and Supplementary Data 8). C1 and C3 were associated with higher levels of these parameters when compared to C2 and C4.
Moreover, C2 and C4 were enriched in patients with glandular manifestations of the disease assessed by a positive focus score in the absence of anti-SSA antibodies (Table 2).
In addition, the levels of rheumatoid factor (p-value < 0.001) and complement C4 fraction levels (p-value = 0.003) were statistically different between the four clusters. C1 was character- ized by a higher rheumatoid factor and by a reduced complement C4 fraction levels compared to the other clusters. While some patients presented anti-dsDNA antibodies in C1 and C3 and anti- CCP antibodies in C4, almost none of these autoantibodies were present in the other clusters (Supplementary Data 8).
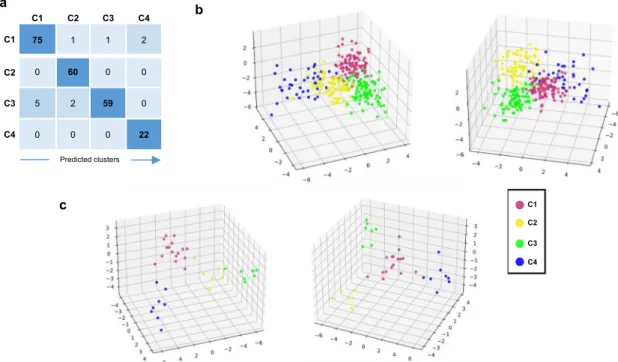
Prediction of patient membership to each of the four clusters.
We then developed through machine learning approaches a composite model able to predict, according to a small number of variables, to which of the 4 clusters each patient belongs (see Methods). The proposed composite model was built with a 2-step approach to allocate patient to the right cluster (Supplementary Fig. 10). The final sets of selected features were composed of 10 genes for the C4 prediction model (first step) and 31 genes for the C1, C2, and C3 classification model (second step). The distribu- tion among clusters of the variance stabilizing transformation (vst) normalized expression for all these transcripts is shown in Supplementary Fig. 11. The validation set (Fig. 1 and Table 1) was used for training, due to the heterogeneity of C4 pSS patients in this set, and the composite model was then run on the discovery set. The accuracy of the model was 95.15%, with 99.12% and 95.57%, for the first and the second steps respectively. The con- fusion matrix, the corresponding discriminant function analysis, and the probabilities to belong to one of the 4 clusters are shown in Fig. 8a, b, and Supplementary Data 9, respectively.
To generalize the composite model, we used an independent inception cohort of 37 pSS patients. After prediction, C1 contained 16 patients (43.2%), C2 6 patients (16.2%), C3 7 patients (18.9%) and C4 8 patients (21.6%). The corresponding discriminant function analysis and the probabilities for a patient to belong to one of the 4 clusters are shown in Fig. 8c and Supplementary Data 10, respectively. We then used the minimal list of 257 discriminative genes signature previously selected in Fig. 1a to generate a heat map with the prediction established by the composite model (Supplementary Fig. 12a). The clusters observed had the same profile than those identified in the discovery set and observed again in the validation set (Fig. 1a), confirming once more the clustering model. Furthermore, the predicted patients showed a distribution of the IFN signatures (Supplementary Fig. 12b) consistent with the one characterizing the identified clusters (Fig. 3). Altogether, these observations strengthen the validation of our composite model.
Finally, in order to allow our model to process other cohorts of
patients, we implement an interpolation function based on 6
genes presenting a constant expression across all 4 clusters and
HV (Supplementary Fig. 13). The composite model is integrated
into an analysis tool available on the laboratory’s github
repository
33.
Discussion
Over the last decade, numerous targeted immunomodulatory therapies for pSS have failed to show a benefit in clinical trials, hence no disease-modifying therapy has yet been approved for this disease
34–39. The heterogeneous nature of pSS and its non- linear development, with flares of activity and subsequent remission associated to a very heterogeneous clinical presentation
may explain clinical trial failures
40. In this context, there is growing interest in the identification of well-characterized sub- groups of patients, a prerequisite to the identification of mole- cular biomarkers predictive of treatment response
41.
We report herein on a large molecular profiling study carried out in pSS patients, a comprehensive molecular profiling of these patients irrespective of their clinical phenotypes. Previous studies
a b
Proportion (%)
Hypergammaglobulinemia
ESSPRI
PGA
ESSDAI
Extractable nuclear antigen antibodies Anti-SSA antibodies Complement fraction C3c (g/L)
C1 C2 C3 C4
No Past Present N/A
c
C1 C2 C3 C4 C1 C2 C3 C4 C1 C2 C3 C4
Negative Low Medium Elevated High N/A
Anti-SSA antibodies (Ro-52) Anti-SSA antibodies (Ro-60)
Anti-SSB antibodies Rheumatoid factor
C1 C2 C3 C4 C1 C2 C3 C4
Proportion (%)
Complement fraction C4 (g/L)
Concentration
Circulating free light chains (mg/L)
C1 C2 C3 C4 HV
100
75
50
25
0
100
75
50
25 0
100
75
50
25
0
100 75 50 25 0
4 3 2 1 0
0.75
0.50
0.25
0 40 30 20 10 0 50
100
50
0
15
10
5
0 0.32
0.022 0.14 0.29 0.94 0.073
0.03 0.031 0.88 0.22 0.19 0.2
0.48 0.65 0.7 0.96 0.44 0.79
0.033 0.220.28 0.160.34
0.97 0.14
0.980.15 0.79
0.42 0.240.88 0.51 0.230.84
0.16 0.0033 0.12 0.002
0.17 0.000530.17
0.0083 0.14 1.7e-07
0.00013 9.7e-14 p<2.22e-160.00079
Fig. 7 Disease activity and serological distributions in the 4 clusters. aESSDAI collected for 193 pSS patients (C1: 70, C2: 52, C3: 44, C4: 27), PGA collected for 286 pSS patients (C1: 94, C2: 71, C3: 85, C4: 36,) and ESSPRI collected for 150 pSS patients (C1: 56, C2: 43, C3: 30, C4: 21) distributions are shown in the 4 clusters. Two-tailed pairwise Wilcoxon-rank sum test results are shown.bThe barplot shows the proportion of past (light orange) or present (orange) hypergammaglobulinemia (C1: 97, C2: 73, C3: 86, C4: 38) in each cluster.cExtractable nuclear antigen antibodies, anti-SSA antibodies, anti-SSA antibodies (Ro-52), anti-SSA antibodies (Ro-60), anti-SSB antibodies, rheumatoid factor were performed for 304 pSS patients (C1: 101, C2:77, C3:88, C4:38) and 330 HV and measured in serum, at the same center, using an automated chemiluminescent immunoanalyzer (IDS-iSYS). Barplots show the proportion of concentration level in each cluster (black: negative, light pink: low, orange: medium, red: elevated and dark red: high). Turbidimetry was used for rheumatoid factor (RF), complement fractions C3c and C4 determination and circulating free light chains. Statistical significance is determined by two-tailed pairwise Wilcoxon-rank sum test. Plots show median with error bars indicating ± interquartile range. Patient and HV distribution according to PGA and biological parameters analyzed variable is described in Methods.