Gustatory perception alterations in obesity:
An fMRI study
Csaba Szalay1, a, , , ,
Mihály Aradib, d,
Attila Schwarczb, d, g,
Gergely Orsib, c, d, g,
Gábor Perlakib, c, d, g,
Lívia Németha,
Sophia Hannaa,
Gábor Takácsa,
István Szabóa,
László Bajnoke,
András Vereczkeif,
Tamás Dóczib, g,
József Janszkyc, g,
Sámuel Komolyc,
Péter Örs Horváthf,
László Lénárda,
Zoltán Karadia
a Institute of Physiology and Neurophysiology Research Group of the Hungarian Academy of Sciences, Pécs University, Medical School, Hungary
b Neurosurgery Clinic, University of Pécs, Hungary
c Neurology Clinic, University of Pécs, Hungary
d Pécs Diagnostic Center Ltd., Hungary
e Endocrinology Division, 1st Internal Medicine Clinic, University of Pécs, Hungary
f Surgery Clinic, University of Pécs, Hungary
g MTA-PTE Clinical Neuroscience MR Research Group, Hungary
http://dx.doi.org/10.1016/j.brainres.2012.07.051, How to Cite or Link Using DOI
Permissions & Reprints
Abstract
The background of feeding associated and metabolic diseases is not sufficiently understood yet. Since gustatory alterations may be of particular significance in the above illnesses, in the present experiments, cerebral activation was detected by fMRI in twelve obese patients and twelve, age and gender matched healthy subjects.
The gustatory stimulus solutions were delivered via intraorally positioned polyvinyl tubes.
Each session consisted of three runs. Sucrose was used as a pleasant; quinine HCl as an aversive; and a high-calorie, vanilla flavored nourishment solution as a complex taste of high palatability. In each run, only one taste was used as a stimulus. During all runs, distilled water served as a neutral stimulus. Group analysis was made by using the FSL software package.
The taste stimuli elicited characteristic and distinct activity changes of the two groups. In contrast to the controls, in the obese patients, stronger activation was detected in various cortical (anterior cingulate cortex, insular and opercular cortices, orbitofrontal cortex) and subcortical (amygdala, nucleus accumbens, putamen and pallidum) structures in case of all three stimuli.
The present examinations elucidated differential activation of various brain structures to pleasant and unpleasant gustatory stimuli in obese patients compared to control subjects.
These taste alterations are supposed to be of particular significance in obesity, and our findings may contribute to develop better strategies for prevention and effective therapies in the future.
Graphical abstract
Figure options
Highlights
► Taste perception of obese patients and healthy subjects was examined by fMRI. ► Three tastants with distinct hedonic qualities and palatability were used. ► Higher activity of
several brain areas was found in the obese group for all tastes. ► These results help to explain the background of overeating in obesity.
Keywords
Obesity;
Taste perception;
Limbic forebrain;
fMRI
1. Introduction
Elucidating the underlying neural mechanisms of the central control of feeding and metabolism is fundamental in the neurophysiological research because related diseases (obesity, type 2 diabetes mellitus, etc.) put enormous and increasing costs on the health care systems of the modern societies. The pathophysiological mechanisms of these illnesses and the central regulation of relevant functions even in healthy condition are not sufficiently understood yet. Based on previous findings of animal experiments (Kennedy, 1950) and human observations (Salbe et al., 2004), gustatory alterations are supposed to play distinguished role in the above processes.
The functional magnetic resonance imaging (fMRI) has become a widely used tool to study the central nervous system. Although the technique is broadly utilized to examine various cognitive functions, to date it was rarely employed in the investigation of brain mechanisms associated with taste perception deficits in eating and metabolic disorders.
Previous electrophysiological studies in the non-human primate elucidated the neocortical regions playing important role in taste perception. It was found that the insula and the adjoining frontal operculum are the primary cortical representations of taste whereas the caudolateral orbitofrontal cortex (OFC) serves as the secondary taste cortex (Rolls et al., 1990, Scott et al., 1986 and Yaxley et al., 1990). The neurons in these regions are responsive to gustatory stimuli, and the responsiveness in the primary cortical representation area is independent of the animal's physiological state, e.g. from hunger or satiety (Rolls et al., 1988 and Yaxley et al., 1988). By contrast, gustatory responsiveness of neurons in the OFC is greatly influenced by the hunger state of the animal (Rolls et al., 1989). In humans,
neuroimaging studies revealed the role of the insula/frontal operculum and the OFC in taste information processing (Francis et al., 1999). The OFC was found to get activated by not only pleasant but also by unpleasant gustatory stimuli (O'Doherty et al., 2001). The anterior insula represents the identity and intensity of a taste, whereas the reward value is represented in the OFC and the anterior cingulate cortex where the activation correlates with the subjective pleasantness of the taste (Grabenhorst and Rolls, 2008). It is of interest that the human amygdala, previously thought to play role only in negative emotions and processing hedonically negative stimuli, (Zald et al., 1998) responded to a hedonically positive taste, glucose as well, (Francis et al., 1999) and it was seen to get activated as much to the
affectively pleasant taste of glucose as to the affectively unpleasant taste of sodium chloride (O'Doherty et al., 2001). The viscosity of a food in the mouth is represented in the anterior insula and the mid-insular region, known to be involved in cortical representation of oral somatosensory stimuli (De Araujo and Rolls, 2004). Oral viscosity also activates the OFC and pregenual cingulate cortices, the latter is especially strongly activated by the oral fat texture as
well (De Araujo and Rolls, 2004 and Rolls et al., 1999). Furthermore, these activations highly correlated with the subjective pleasantness ratings of oral fat texture (Rolls, 2010).
PET and fMRI examinations elucidated changes of feeding related reactions of obese patients.
When comparing the consequences of presentation of the picture of a non-food item (e.g. a landscape) to the picture of a food item, the regional cerebral blood flow (rCBF) was found higher in the right parietal and temporal cortices in obese individuals than in the control subjects (Karhunen et al., 1997). In addition, in the obese women the activation of the right parietal cortex was associated with an enhanced feeling of hunger when looking at food (Karhunen et al., 1997 and Kinomura et al., 1994). When a high-calorie visual stimulus was used, the dorsal striatum activated more in obese women compared to controls, and the activation in the dorsal striatum, anterior insula, claustrum, posterior cingulate-, postcentral-, and lateral orbitofrontal cortices could be predicted by the BMI (Rothemund et al., 2007).
Previous imaging studies on obesity also investigated neural reponses to hunger and satiety (Del Parigi et al., 2002, Gautier et al., 1999 and Karhunen et al., 1997). In these examinations, the subjects were food-deprived and after the fasting they received a liquid meal, or saw neutral pictures, or pictures of food cues (Karhunen et al., 1997). The regions activated in the obese group but not in controls were the OFC, parietal, temporal, cingulate and prefrontal cortices, the insula, the hypothalamus, nucleus accumbens (NAcc), amygdala (AMY), and the midbrain (Del Parigi et al., 2002, Gautier et al., 1999, Karhunen et al., 1997 and Matsuda et al., 1999). It was also discovered in obese women that a widespread reward system activation occurs in response to high-calorie food pictures, (Stoeckel et al., 2008) and the effective connectivity of the amygdala, nucleus accumbens and OFC is pathological in these patients compared to controls (Stoeckel et al., 2009).
Despite a relative abundance of these feeding associated investigations, only a few similar studies focused on changes of taste information processing in obese patients. In the present series of experiments, therefore, our purpose was to compare gustatory stimulation elicited brain activity changes of obese and control subjects in a condition when the intrinsic physiological state of hunger and satiety were kept on a constant level.
2. Results
2.1. Visual analog scale
Significant differences were found between the two groups in the pleasantness ratings given for sucrose (62.5±11.38 in obese vs. 27±4.4 in controls; p<0.001), for quinine (−92±7.9 in obese vs. −67.5±14.36 in controls; p<0.001), and for vanilla (94.5±5.4 in obese vs.
48.75°11.89 in controls; p<0.001), respectively.
2.2. Taste stimulation induced brain activation
In general, taste vs. distilled water (DW) stimulation induced brain activation was found to be significantly bigger in the obese patients compared to the control subjects.
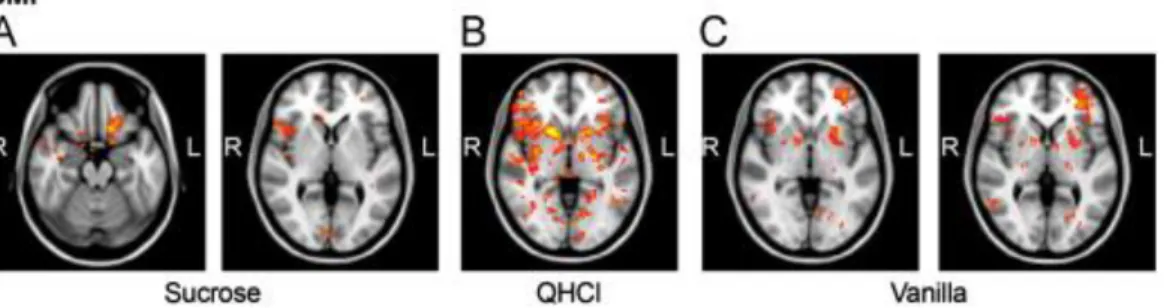
In the sucrose vs. water condition, a significantly higher activation was found in the obese group compared to controls in the right central_operculum; right frontal operculum; left, right insula; right middle frontal gyrus; left OBF; left parietal operculum; right amygdala and in the
left NAcc (see Table 1 and Fig. 1A). In the quinine vs. water condition, there was
significantly higher activation in the obese group in the left, right anterior cingulate cortices;
left, right frontal, central and parietal opercular cortices; left, right insular cortices; left, right middle frontal gyri; left, right OFC; left, right amygdala; left, right NAcc; left, right pallidum;
left, right putamen; left, right caudate nuclei and left and right thalamic nuclei (see Table 2 and Fig. 1B). In the high-calorie vs. water condition, the obese group showed significantly higher activation compared to controls in the left central opercular cortex; left, right frontal opercular cortices; and left parietal opercular cortices; left, right insular cortices; the left, right middle frontal gyri; left, right OFC left amygdala; left NAcc; left pallidum, left putamen and in the left caudate nucleus (see Table 3 and Fig. 1C).
Table 1. Brain regions of significantly increased activation in the obese group relative to the controls in response to 0.1 M sucrose.
Area #voxels Max.z-score MNI coordinates (mm)
x y z
central_operculum_right 11 3.125 42 8 10 frontal_operculum_right 82 3.806 42 12 8
insula_left 12 3.057 −30 −24 20
insula_right 12 2.655 38 14 −2
middle_frontal_gyrus_right 271 3.296 36 14 34
OBF_left 264 3.601 −16 8 −20
parietal_operculum_left 52 3.185 −40 −36 22
AMY_right 15 3.27 20 2 −18
NAcc_left 10 3.345 −10 18 −10
Table options
Fig. 1. Brain regions of significantly increased activity in the obese group relative to the controls in response to 0.1 M sucrose (A), 0.03 mM quinine HCl (B), and to the vanilla flavored high-calorie (C) stimulus. The slices are in the axial, coronal and sagittal planes (for more details see Results Section 2.2).
Figure options
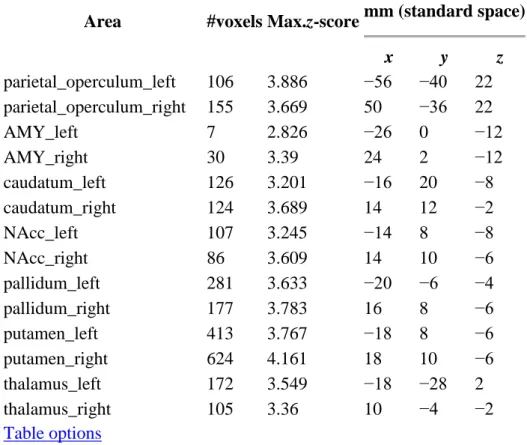
Table 2. Brain regions of significantly increased activation in the obese group relative to the controls in response to 0.03 mM quinine HCl.
Area #voxels Max.z-score mm (standard space)
x y z
anterior_cingulum_left 274 3.969 −12 6 38 anterior_cingulum_right 445 3.36 12 42 12 central_operculum_left 132 3.716 −44 −12 22 central_operculum_right 162 3.292 44 0 18 frontal_operculum_left 90 3.318 −48 20 −2 frontal_operculum_right 255 3.858 36 22 4
insula_left 157 3.304 −32 −16 6
insula_right 499 4.033 34 20 0
middle_frontal_gyrus_left 496 3.55 −28 36 22 middle_frontal_gyrus_right 1213 3.99 44 30 36
OBF_left 341 3.672 −22 36 −14
OBF_right 203 3.673 24 8 −10
Area #voxels Max.z-score mm (standard space)
x y z
parietal_operculum_left 106 3.886 −56 −40 22 parietal_operculum_right 155 3.669 50 −36 22
AMY_left 7 2.826 −26 0 −12
AMY_right 30 3.39 24 2 −12
caudatum_left 126 3.201 −16 20 −8
caudatum_right 124 3.689 14 12 −2
NAcc_left 107 3.245 −14 8 −8
NAcc_right 86 3.609 14 10 −6
pallidum_left 281 3.633 −20 −6 −4
pallidum_right 177 3.783 16 8 −6
putamen_left 413 3.767 −18 8 −6
putamen_right 624 4.161 18 10 −6
thalamus_left 172 3.549 −18 −28 2
thalamus_right 105 3.36 10 −4 −2
Table options
Table 3. Brain regions of significantly increased activation in the obese group relative to the controls in response to the vanilla flavored high-calorie nourishment.
Area #voxels Max.z-score MNI coordinates (mm)
x y z
central_operculum_left 23 3.053 −44 −22 26 frontal_operculum_left 122 3.701 −32 24 12 frontal_operculum_right 63 3.362 36 16 18
insula_left 80 4.356 −28 18 −6
insula_right 34 3.461 38 20 −6
middle_frontal_gyrus_left 493 3.858 −48 32 32 middle_frontal_gyrus_right 273 3.928 48 20 30
OBF_left 154 3.252 −22 8 −10
OBF_right 43 3.45 40 22 −6
parietal_operculum_left 149 3.45 −40 −36 28 parietal_operculum_right 25 3.146 64 −26 18
AMY_left 30 3.189 −22 0 −14
caudatum_left 17 2.937 −12 16 −6
NAcc_left 58 3.122 −12 10 −6
pallidum_left 30 3.223 −16 4 −6
putamen_left 137 3.728 −22 8 −8
Table options
Responses of the control group were not found significantly greater than those of the obese group for any of the taste stimuli compared to DW. Furthermore, there was no significant difference in the deactivation patterns between the two groups in response to any taste stimulus.
When the BMI was added in a single regression model as a covariate, positive correlation was found in the sucrose vs. water condition in the; left, right central opercular cortices; right frontal opercular cortex; left parietal opercular cortex; left, right insular cortices; right middle frontal gyrus; left; right OFC; right amygdala; left, right caudate nuclei and in the left, right NAcc (Fig. 2 and Fig. 4). In the quinine vs. water condition, the activation also positively correlated with BMI in the left, right anterior cingulate cortices; left, right frontal-; central-;
parietal opercular cortices; left, right insula; left, right middle frontal gyri, left, right OFC;
left, right amygdala; left, right NAcc; left, right pallidum; left, right putamen; left, right caudate nuclei and in the left and right thalamic nuclei (Figs. 2B and 4B). In the vanilla vs.
water condition, the left, right frontal-; left central-;left parietal opercular cortices; left, right insula; left, right middle frontal gyri, left, right OFC; left, right amygdala; left, right NAcc;
left, right pallidum; left, right putamen; left, right caudate nuclei and in the left and right thalamic nuclei showed activation positively correlating with BMI (Figs. 2C and 4C).
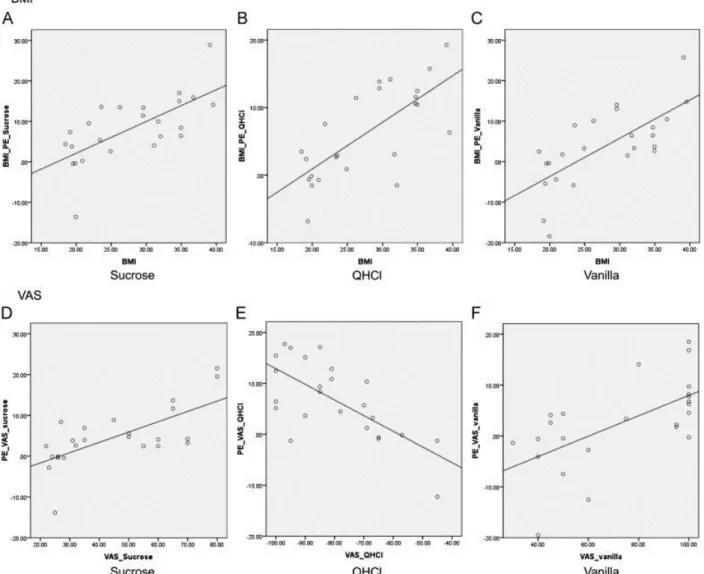
Fig. 2. Brain regions positively correlating with BMI for the sucrose (A), quinine-HCl (B), and for the vanilla condition (C) (for more details see Results Section 2.2).
Figure options
Fig. 3. Brain regions showing positive correlation with hedonic ratings for sucrose (A), negative correlation with hedonic ratings for the quinine-HCl (B), and brain regions positively correlating with hedonic scores for the vanilla condition (C) (for more details see Results Section 2.2).
Figure options
Fig. 4. Upper row: correlation between BMI and parameter estimates (PE) (A) in the sucrose condition (Pearson correlation: 0.681; p<0.001), (B) in the quinine condition (Pearson correlation: 0.717; p<0.001), (C) in the high calorie condition (Pearson correlation: 0.705; p<0.001); Bottom row: correlation between hedonic ratings (VAS) and parameter estimates (PE) (D) in the sucrose condition (Pearson correlation: 0.690;
p<0.001), (E) in the quinine condition (Pearson correlation: −0.691; p<0.001), (F) in the high calorie condition (Pearson correlation: 0.624; p<0.001) respectively.
Figure options
When the subjective VAS hedonic scores were entered into the regression model, in the sucrose vs. water condition the left anterior cingulate cortex; the left frontal and parietal opercular cortices; left insular cortex; left, right OFC, the left and right middle frontal gyri, and the left NAcc showed activation positively correlating with the VAS scores (Figs. 3A and 4D). In the quinine vs. water condition, the activation in the left, right anterior cingulate cortices; left, right frontal, central and parietal opercular cortices; left, right insular cortices;
left, right middle frontal gyri; left, right OFC; left, right amygdala; right NAcc; left, right pallidum; left, right putamen; right caudate nuclei and left and right thalamic nuclei showed activation negatively correlating with the hedonic scores (Figs. 3B and 4E). Finally, in the high-calorie vs. water condition, activation in the left central oprecular cortex; left, right
frontal opercular cortices, left parietal opercular cortex; the left, right OFC and left and right middle frontal gyri showed positive correlation with the subjective ratings (Figs. 3C and 4F).
3. Discussion
In the present study, gustatory stimulation induced differential fMRI brain activation patterns were revealed in obese patients compared to healthy control subjects. To our knowledge, so far this is the first study which investigated brain activity alterations in obese individuals in response to intraorally delivered hedonically different taste stimuli.
As neutral stimulus distilled water was applied. Although in numerous studies artificial saliva served as a neutral stimulus (De Araujo and Rolls, 2004, Grabenhorst et al., 2010,
Kringelbach et al., 2004 and Stice et al., 2008), it is not exceptional to use DW as a baseline stimulus (Cerf-Ducastel et al., 2001, Haase et al., 2007, Haase et al., 2009, Jacobson et al., 2010, Kobayashi et al., 2004, Ogawa et al., 2005, Schoenfeld et al., 2004, Smeets et al., 2005, Smeets et al., 2006 and Wagner et al., 2008). On the other hand, DW itself was shown to cause cortical activation (Zald and Pardo, 2000), nevertheless, we wanted to use the vehiculum in which the substances served as taste stimuli were dissolved.
In general, to date, relatively few imaging studies aimed to identify brain areas involved in gustatory perception in relation to the ingestion of various taste solutions. Early PET studies demonstrated the crucial role of the insular and opercular cortices, and that of the OFC in taste information processing (Petrides et al., 1996, Small et al., 1997, Small et al., 1999 and Zald et al., 1998). Further fMRI and MEG experiments compared the brain activation effects of various pleasant and aversive taste stimuli in healthy volunteers (O'Doherty et al.,
2001 and Kobayakawa et al., 1999). In addition to demonstrating the activation of the insula and the opercular cortex in both studies, the fMRI investigations revealed that the OFC and the AMY get activated not only by a pleasant taste stimulus but by an aversive one as well.
Imaging studies in obesity so far mainly focused on recognizing differential responsiveness of patients to various food cues. In PET examinations, the rCBF was found higher in the right parietal and temporal cortices in the obese patients compared to control subjects during the presentation of food items vs. non-food items. In addition, in the obese women, the activation of the right parietal cortex was associated with an enhanced feeling of hunger when looking at food (Karhunen et al., 1997). Similar results were assessed among obese children by using fMRI (Davids et al., 2010). It was found that the obese group showed increased dorsolateral prefrontal cortex (dlPFC) activity for visual food stimuli, and furthermore, their heart rate deceleration showed a positive correlation with the activation in the ventrolateral PFC (Davids et al., 2010). In a recent study, Bruce et al. observed increased PFC activity in obese children to food pictures in a starving state, and no activity reduction during satiation in the PFC/OFC as well as in other reward processing regions such as the nucleus accumbens (Bruce et al., 2010).
Our results are in agreement with these above findings. Compared to controls, in the obese patients, significantly higher activation was observed to the hedonically positive stimulus sucrose in the secondary gustatory cortex (OFC) and the cingulate cortex, both responsible for coding the reward value of a given taste (Kringelbach et al., 2004). Observations of Faurion et al. (1999) showed that there can be a lateralized activation in the gustatory cortex (mainly in the inferior insula) for taste stimuli, which could be related to handedness. Our findings are in full harmony with these results. All of the participants were right-handed in the present study.
Although we did not find lateralized activity in the primary gustatory cortex, but the
secondary taste cortices showed lateralization. Brain areas with significantly higher activation to the sweet stimulus in the obese group were identified on the left OFC, and in case of the quinine, and the high calorie condition, the activation of the OFC was more prominent on the left side.
The within-group analysis of the quinine vs. water condition provided evidence for significantly increased activation of the primary (insular, opercular) and secondary (OFC) taste cortices, putamen, caudate and different limbic areas (AMY, NAcc, pallidum) in the obese compared to control subjects. This result, interpreted as the obese patients showed a pronounced finickiness to quinine, is in concordance with the classic data of Kennedy who demonstrated that hyperphagic rats in the static phase of obesity developed finickiness (Kennedy, 1950).
In case of stimulating by the vanilla flavored nourishment as a high-calorie multimodal stimulus, significantly higher activation was found in the obese group in the OFC, limbic areas, the pallidum, putamen and caudate nucleus, structures involved in sensing fat content and the palatability of food (Rolls, 2010). Enhanced activation was also detected in the parietal operculum where the oral somatosensory cortex is localized. This result is in agreement with findings of another study demonstrating increased resting activity of the somatosensory cortex in obese patients (Wang et al., 2002). The high activation of the OFC in the obese group in the vanilla condition is well substantiated by previous reports on the preference of sugar/fat mixtures by obese subjects (Drewnowski et al., 1991). The OFC also has been shown to exert liquid food stimulus related activity depending on the subjective pleasantness of the given food (Kringelbach et al., 2003). In our present study, for the vanilla flavored high-calorie liquid food stimulus, the VAS hedonic scores also positively correlated with the activation in the OFC, opercular cortices, and in the middle frontal gyri as well.
Our results support an explanation for the motivational background of overeating in obesity.
The patients, compared to controls, had an increased activity for sucrose in the OFC. This can be due to an enhanced motivation to eat more of the pleasant foods, because this region are responsible for “scoring” the reward value of a food or any other stimulus (Kringelbach et al., 2004). The higher the given intrinsic score the more palatable the given food or taste is, therefore, more and more will be consumed of it to feel more pleasure. This theory is supported by the findings of Schäfer et al. (2010). They have shown that the structural
abnormality of the OFC could have a crucial role in binge eating disorder and bulimia nervosa by affecting the reward processing and self-regulatory mechanisms as well.
Results of previous neurophysiological experiments in the rat and rhesus monkey raise the possibility that malfunctioning of the so called glucose-monitoring (GM) neurons could be in the background of the taste perception alterations of obese patients. These hierarchically organized special chemosensory cells are found in several brain regions (such as the
hypothalamus, (Karadi et al., 1992 and Oomura et al., 1969), amygdala, (Karadi et al., 1998) globus pallidus, (Karadi et al., 1995 and Lenard et al., 1995) nucleus accumbens, (Papp et al., 2007) orbitofrontal and mediodorsal prefrontal cortices (Karadi et al., 2004)), and are known to respond to various endogenous (e.g. neuromodulators, changes of the blood glucose level, insulin) and exogenous signals, among others, gustatory stimuli as well (Karadi et al., 1992, Karadi et al., 1995, Karadi et al., 2004, Lenard et al., 1995, Oomura et al., 1969 and Oomura and Kita, 1981). The selective destruction of these neurons reportedly elicit characteristic, type 2 diabetes mellitus like homeostatic disturbances and taste perception deficits (Karadi et
al., 2004 and Karadi et al., 2005). In the present study, the obese patients displayed
significantly enhanced activation to intraorally delivered stimuli of differential hedonic value and palatability, predominantly just in those limbic forebrain regions (OFC, AMY, NAcc, pallidum) where the above mentioned GM neurons have been localized. In obesity
dysfunctions of the chemosensory cells in the AMY and NAcc, key structures of the reward circuitry, may have a distinguished role in overeating due to their altered responsiveness to tastes.
With rsepect to central nervous system associated differences in obese women and men, Horstmann et al. elucidated a connection between gender and brain morphology and behavior in obesity (Horstmann et al., 2011). In another study, Orsi et al. showed a correlation between BMI and the volume of the right amygdala in the subpopulation of overweight men but not in women (Orsi et al., 2011). Although this issue would be worth analyzing, in our study, due to the limited number of subjects, statistical analysis related to gender differences could not be performed.
It is hoped that our new findings serve the better understanding of the pathophysiological background of obesity. These data may trigger the designing of further preclinical–clinical experiments that can contribute to develop better strategies for prevention and effective therapies in the future.
4. Experimental procedure
4.1. Subjects
Twelve obese (BMI: 34.05±3.35, 9 women, 3 men) and twelve healthy, age (38.3±4.2 vs.
37.1±3.8) and gender matched subjects (BMI: 21.42±2.53) participated in this study. The exclusion criteria were the following: 1) smoking, 2) medications influencing taste perception, 3) any psychiatric disorder in the history, 4) any kind of endocrinological disease in the
history, 5) chronic alcohol consumption (more than 2 alcoholic beverages/day). All subjects tested were right-handed and none of them were on diet. Examinations were initiated after informed consent of the participants have been signed. The protocol was in full agreement with international, national and university regulations.
4.2. Taste stimulation
The fMRI session was scheduled 3–4 h after the subject consumed a standardized meal (465 kcal/100 g, rice with chicken) to avoid the confounding effect of hunger or satiety. By using a ten points arbitrary scale, the hunger ratings were recorded prior to scanning, and there was no significant difference between the two groups (5.1±0.4 vs. 4.8±0.3,
respectively). Before the scanning session, the taste sensitivity of the subjects was roughly estimated by presenting them a low concentration solution of the five basic taste qualities. No sensitivity deficit was detected by this method in the subjects. Two polyvinyl (PVC) tubes with inner diameter of 1 mm were placed into the mouth of the volunteer. Two unimodal and one multimodal taste solution in three separate fMRI runs were used as stimuli, whereas distilled water (DW) served as rinse and a neutral stimulus in all runs. 0.1 M sucrose (sweet, unimodal) as pleasant, 0.03 mM quinine hydrochloride (bitter, unimodal) as unpleasant, and, a high-calorie (150 kcal/100 ml), vanilla flavored nourishment solution (Nutridrink©) as a complex multimodal stimulus were delivered via the tubing. In each run only one taste
solution was used, so there were a sucrose vs. DW, QHCl vs. DW, and Nutridrink vs. DW run. To minimize order effects the runs followed each other in a random order. Between each run, the subjects were allowed to have a rest for 3–5 min.
After the functional measurements, the subjects had to put a single pencil mark on a 200 mm visual analog scale (VAS) where the left side (−100 mm) meant that the taste was hedonically negative, whereas the right side (+100 mm) meant that the taste was hedonically positive. The middle point of the scale, the 0 meant that the solution was neutral for the participant.
4.3. MR imaging
Subjects were laid into a Siemens Magnetom TIM Trio (Siemens AG., Erlangen, Germany) 3T clinical MR scanner in supine position with eyes closed. During all functional MR imaging runs, 360 volumes of T2⁎-weighted EPI image series with 23 axial slices were acquired (TR/TE: 2500/36 ms, FoV: 192 mm, matrix: 96×96, in-plane resolution: 2×2 mm2, slice thickness: 4 mm, no gap, interleaved slice order to avoid crosstalk). The slices were positioned parallel to the AC-PC line. Following the functional scans, a high-resolution anatomical T1-weighted axial 3D-MPRAGE image (TR/TE/TI: 1900/3.41/900 ms; FA: 9°;
FOV: 210×240 mm2; 224×256 matrix; slice thickness: 0.94 mm; 160 slices; voxel size:
0.94×0.94×0.94 mm3; 180 Hz/pixel receiver bandwidth) was acquired for later usage during the registration to a standard image in the MNI-space.
4.4. Design
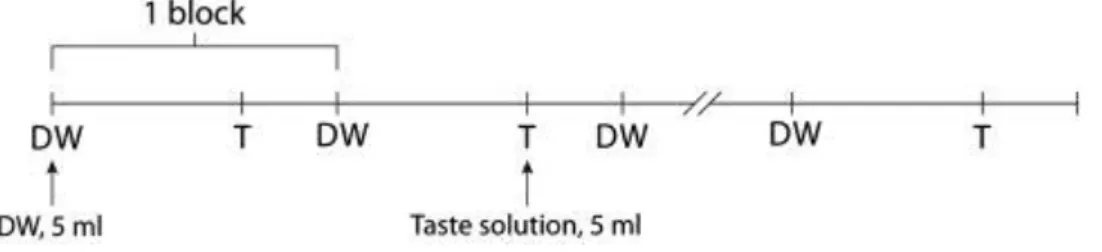
A block design was used, in which, one block contained 12 active and 24 baseline (passive) scans, and the blocks were repeated ten times. Altogether 360 scans were acquired during one functional measurement. The solutions and the DW in 5 ml volume were delivered in 2–3 s at the start of every active and passive phases, respectively, by using a pneumatic syringe pump.
The total amount of the solutions was 100 ml (50 ml DW, 50 ml taste) in each run. The subjects had to swirl around the solution in their mouth during all phases, and then, when instructed, had to swallow it. The duration of each fMRI run was 15 min. The design is demonstrated in Fig. 5.
Fig. 5. Experimental paradigm for stimulus delivery. Abbreviations: DW: distilled water, T: taste solution (for more details see Experimental Procedure Section 4.4).
Figure options 4.5. fMRI data analysis
Pre-processing and statistical analysis were performed using FEAT (FMRI Expert Analysis Tool) Version 5.98, part of FSL (FMRIB's Software Library, http://www.fmrib.ox.ac.uk/fsl).
Pre-processing included brain extraction, (Smith, 2002) MCFLIRT motion correction,
(Jenkinson et al., 2002) spatial smoothing with 5 mm full width at half maximum, and a high- pass temporal filter of 100 s. The temporal filtering applied to the data was used for the model as well. Whole brain general linear model (GLM) time-series statistical analysis of individual data sets was carried out using FILM (FMRIB's Improved Linear Model) with local
autocorrelation correction (Woolrich et al., 2001). The temporal derivative was included in our design-matrix to correct for slight overall temporal shifts between the model and the data:
adding to an original signal a small amount of the temporal derivative of that signal is equivalent to shifting the original signal slightly in time. The single-session data sets were registered into standard space using FLIRT in a two-step process (Jenkinson et al., 2002).
First, (brain-extracted) low-resolution fMRI data from each subject were registered to that subject's (brain-extracted) high-resolution structural MRI using a 7 degrees-of-freedom (DOF) linear fit. Then the high-resolution image was registered to the MNI152 standard brain image using a 12 DOF linear fit. Next, for each subject, the two transforms were combined mathematically to give a single transform taking the fMRI data into standard space; this was applied to the first-level statistic maps (activation parameter estimates and variance estimates) to take them into standard space. Second-level mixed-effects analysis (FLAME (FMRIB's Local Analysis of Mixed Effects) stage 1 and stage 2) was then carried out using the first- level statistic maps to test for mean group activations and differences between the two groups.
Cluster-based thresholding corrected for multiple comparisons was applied using Gaussian random field theory (RFT). Initially an uncorrected cluster forming threshold of Z>2.3 was used to define contiguous clusters, then the remaining clusters were thresholded (based on their size) by a corrected cluster significance threshold of P<0.05 (Worsley, 2001). This method of thresholding is an alternative to voxel-based correction and is often more sensitive to activation (Forman et al., 1995). An independent samples t-test was applied on the data sets to find any statistically significant differences between the two subject groups. The final results presented in MNI152 space allowed the giving of reasonable coordinates for the centers of activation.
Furthermore, individual contrasts were entered into a simple linear regression model with either the BMI or the VAS as the covariate of interest.
Acknowledgments
The authors thank Tibor Auer M.D. Ph.D. for his constructive comments regarding the manuscript and Ms. Ildikó Fuchs for her technical assistance. The project was supported by EFA Norwegian Financing Mechanism0114/NA/2008-3/ÖP-9 VSZ, the Hungarian Academy of Sciences, by the National Research Fund (OTKA K69174 and OTKA K68431), SROP- 4.2.2/B-10/1–2010-0029 and SROP-4.2.1/B-10/2/KONV-2010-0002. S.A. and J.J. were supported by Bolyai fellowship of the Hungarian Academy of Sciences.