ULTRASOUND IMAGE MODELLING AND RESOLUTION ENHANCEMENT
Akos Makra ´
Theses of the Ph.D. Dissertation
Supervisor: Dr. Mikl´ os Gy¨ ongy
P´ azm´ any P´ eter Catholic University Faculty of Information Technology and Bionics
Tam´ as Roska Doctoral School of Sciences and Technology
Budapest, 2020
Introduction
Diagnostic ultrasound has been in use for 60 years now and it has become one of the most popular medical imag- ing methods nowadays. Diagnostic ultrasound imaging commonly utilizes frequencies in the range of 3–20 MHz.
The use of higher frequencies limits the depth of penetra- tion, however it also increases resolution.
As of late, ultrasound (US) has been actively used not only for medical diagnostic purposes [1–3], but also for high-intensity focal beam surgery to produce precise and selective damage to tissues [4–6], biometric recognition [7], non-destructive testing [8–18], and has many applications in the food industry [19–22] among others. Its wide range of applications stems from its numerous advantages such as cost-effectiveness, portability, and using non-ionizing radiation compared to many other procedures such as X- ray, CT or PET, all of which are using potentially harmful radiation. On the other hand, the interpretation of US images is still quite a subjective task despite the numerous quantitative US studies [23–32].
The connection between the fine microscopic structure of tissues and the resulting ultrasound image is at present not fully understood, which further motivates the devel- opment and the importance of validating image formation models.
Challenges in ultrasound im- age resolution enhancement
Imaging modalities of any kind have a theoretical limit on their feasible resolution. The objective of the super- resolution (SR) algorithms is to break this boundary, thereby obtaining an image of higher quality with the same physical setup.
There has always been a great demand for producing images with better and better resolution, either by creat- ing a better physical setup, or using post-processing tech- niques, whether it is about security cameras [33–35], satel- lites [36–41], professional photography [33, 42–44] or even the HUBBLE space telescope [45–48]. The same rules ap- ply for medical purposes: the higher the resolution of an image, the more precise the diagnosis.
Concerning software-based methods for enhancing im- age resolution, the algorithm can be used either on sub- pixel-shifted frames by stacking them, or as a post- processing step where even one frame can be satisfactory.
The use of SR techniques provides the possibility of re- ceiving a more detailed image at a lower cost compared to the expensive and time-consuming process of building a new hardware capable of delivering the same quality.
Nevertheless, along with other imaging modalities (such as MR, CT or light microscopy) its resolution is heavily dependent on the wavelength (higher frequency,
thus shorter wavelength leads to better resolution), which in the case of sound is a lot poorer than that of light or X- ray. The transducer and its frequency also determine the penetration depth (the higher the frequency, the smaller the mentioned depth is) [49, p. 116]. To be able to exam- ine deeper layers of the medium, lower frequencies should be used, which, however, decreases the resolution.
Taking into account the benefits of US imaging it would be worthwhile if the image resolution and signal-to- noise quality could be improved by post-processing meth- ods. The current doctoral work aims to introduce further scientific knowledge by an experimental method to assess the accuracy of a shift-invariant convolution-based ultra- sound image formation model, as well as improving the resolution of ultrasound images.
New scientific results
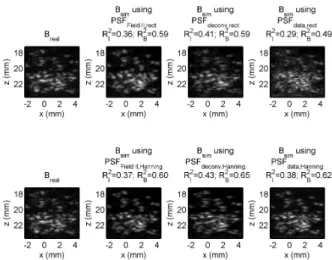
Thesis I: I have created an experimental method to assess the accuracy of a shift-invariant convolution-based ultrasound image formation model. The method relies on a planar arrangement of micrometer-scale scatterers in the imaging plane of a linear array. Using the coefficient of determinationR2 to estimate image similarity, the agree- ment between simulated and real images was R2 = 0.43 for the RF image andR2= 0.65for the envelope-detected B-mode image.
Corresponding publication: [Th1]
Models of ultrasound image formation describe the for- ward process of how an ultrasound image is formed from an acoustic medium. Such models can be used to gener- ate simulated ultrasound images or to obtain quantitative descriptors of the medium from real ultrasound images. A relatively simple and widely used model of image forma- tion treats the ultrasound image (before envelope detec- tion and compression) as the shift-invariant convolution of the imaging system point spread function (PSF) with the scattering function (SF) of the medium [50, 51].
Therefore, I created an experimental method to assess the accuracy of the convolution model. Simulated and real US images were compared to each other. The coefficient of determination was calculated both for the RF ultrasound images and the envelope-detected (B-mode) images.
Various estimates of SF, PSF were tested to see which
Figure 1: Comparison between the real ultrasound image (first col- umn) and simulated ultrasound images computed using six different estimates of the PSF. It can be observed that using Hanning win- dowing on the PSF suppresses the high-frequency components and noise at the edges, resulting in better simulation results.R2I stands for the coefficient of determination between the real and simulated RF images, whileR2B describes the same for the B-mode images.
yielded the best simulation result. The source of simu- lation error was also explored, which possibly originates from scattering of the polystyrene particles from multiple reflections, or from microbubbles. From the observations, it is expected that by increasing the concentration of im- aged scatterers or by more careful experimental design, higher overall values of the coefficient of determination can be obtained.
The results underline that, at least for the experimen- tal setup used in the current work, the shift-invariant
convolution model describes most of the variation in a B-mode image; however, care should be taken to reduce other sources of scattering such as multiple reflections or microbubbles.
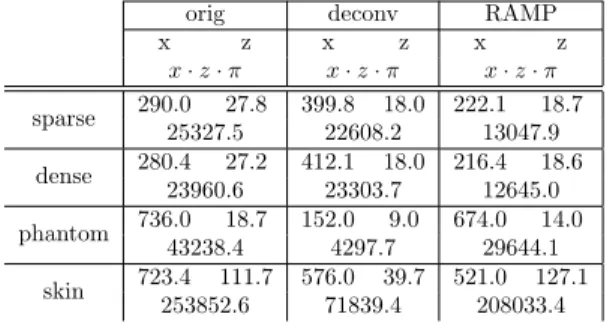
Thesis II: I have presented a novel resolution en- hancement technique based on frequency-weighted axial fil- tering for ultrasound images that can function even when the point-spread function is shift-variant. Estimating res- olution using the full-width at half maximum of the au- tocorrelation, the axial-lateral resolution cell was always improved, with area decreases in the range of 22–94%.
Corresponding publication: [Th2]
Enhancement of image resolution of ultrasound images is key to help clinicians in finding early indicators of patho- logical lesions among others. However, the degree of im- provement greatly depends on accurately estimating the PSF of the system, which in most cases is spatially vari- ant, thus complicating its approximation and subsequent use in deconvolution.
Therefore, I investigated the possibility of using a method for US images, which is unaffected by depth- dependent effects, and it is also capable of improving the resolution both in the lateral and axial directions. Two simulated and two experimental data sets were used.
The nominal central frequencies of the single-element transducers were 20 and 35 MHz. Two different decon- volution methods were used: the classical Wiener filter
Table 1: FWHM values of the AC functions inμm (lateral x and axial z), and area of the resolution cell (x·z·π) inμm2. It can be seen that the axial-lateral resolution cell (estimated as the area of an ellipse) always improved using the RAMP method.
orig deconv RAMP
x z x z x z
x·z·π x·z·π x·z·π sparse 290.0 27.8 399.8 18.0 222.1 18.7
25327.5 22608.2 13047.9 dense 280.4 27.2 412.1 18.0 216.4 18.6
23960.6 23303.7 12645.0 phantom 736.0 18.7 152.0 9.0 674.0 14.0
43238.4 4297.7 29644.1
skin 723.4 111.7 576.0 39.7 521.0 127.1 253852.6 71839.4 208033.4
approach and a custom Fourier domain method (RAMP), where the signal energy was boosted with a gradually increasing function at those (higher) frequencies, where the ultrasound transducer has a weaker response. Both of the methods were used along every A-line separately.
The observed resolution was quantified as the FWHM of the mean AC curves. The results confirm that frequency- weighted axial filtering can balance the need for axial and lateral resolution improvement based on their relative values with properly set parameters.
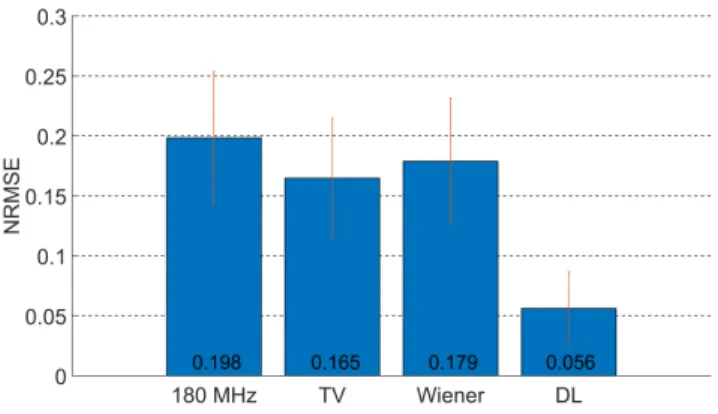
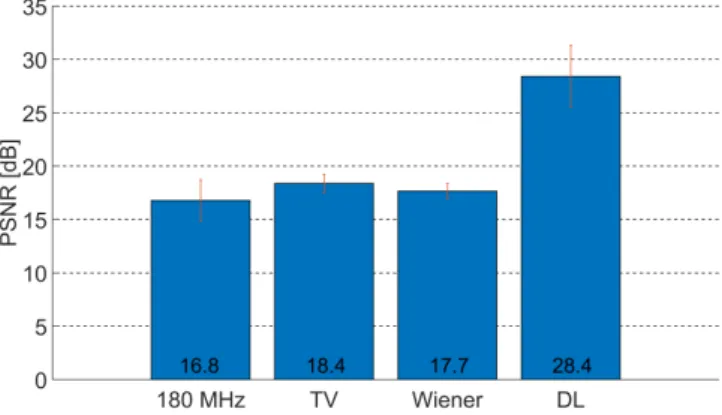
Thesis III: I have shown the successful use of deep learning to enhance scanning acoustic microscope image lateral resolution, even with a very limited data set con- sisting of rat and mouse brain samples (four images in the training set, each smaller than 1 mm× 1 mm). The es- timated images can closely approximate the ground truth
data, having an average NRMSE of 0.056, and PSNR of 28.4 dB.
Corresponding publication: [Th3]
Deep learning is more and more popular nowadays, yet there is limited research about its use on US images, and even those are mostly used for segmentation and classifi- cation.
Therefore, I investigated 30-μm-thick rat and mouse brain samples with a high-frequency SAM setup (180 and 316 MHz). The initial training set included 4 full size image pairs, which were co-registered. To create a prop- erly sized training set the full-sized C-scan SAM images were split into tiles of 300 μm × 300 μm with a shift of 20μm in-between them. Data augmentation was used to increase the variability and number of samples. A U-Net inspired neural network was used to estimate the high- resolution image based on the low-resolution image, and the 316-MHz data was used as ground truth for quantita- tive evaluation. Despite the training set being very lim- ited, the results confirm the feasibility of using DL as a single-image SR method to enhance the lateral resolution of SAM images, which greatly outperformed two classical deconvolution methods (Total Variation [TV] and Wiener deconvolution).
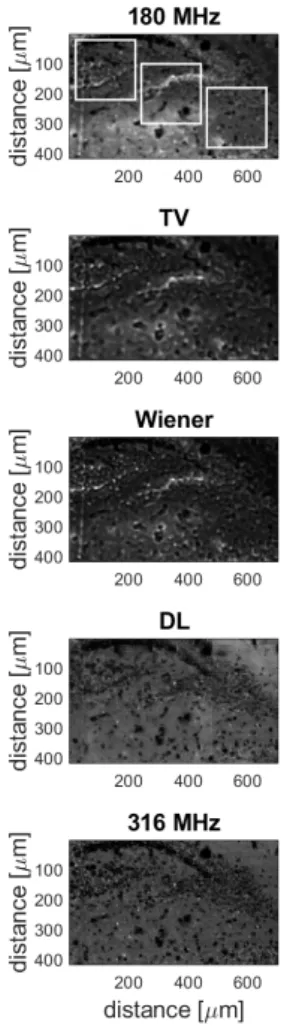
Figure 2: Results of the different resolution enhancement methods on the test image. The images show a rat brain coronal section (Bregma -3.12, the dentate gyrus). From top to bottom: the orig- inal 180-MHz image, slice-by-slice TV and Wiener deconvolution methods, DL and the ground truth (316 MHz) image. The top left area indicated by white borders is shown in greater detail in Fig. 3.
The DL image was reconstructed from the tiles, therefore, stitching artefacts are present.
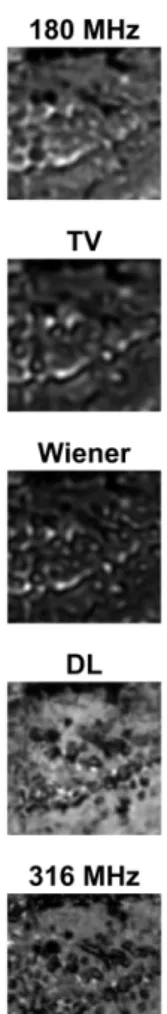
Figure 3: Representative sample from Fig. 2 (top left marked area), showing the hilus. The DL method is seen to qualitatively outper- form the classical deconvolution methods in approximating the high- resolution (316 MHz) reference image.
Figure 4: NRMSE values of the different image resolution enhance- ment methods (the red vertical lines showing ±1 standard devia- tion). The images from the resolution enhancement methods were compared to the ground truth data (316 MHz). The values indi- cate an average considering all of the tiles. The DL method out- performed both the original 180-MHz image and the deconvolution methods. The TV and Wiener deconvolution methods show simi- lar performance to each other, with a slight improvement over the original 180-MHz image.
Figure 5: PSNR values of the different image resolution enhance- ment methods (the red vertical lines showing ±1 standard devia- tion). The images from the resolution enhancement methods were compared to the ground truth data (316 MHz). The values indi- cate an average considering all of the tiles. The DL method out- performed both the original 180-MHz image and the deconvolution methods. The TV and Wiener deconvolution methods show simi- lar performance to each other, with a slight improvement over the original 180-MHz image.
Publications related to the thesis
[Th1] M. Gy¨ongy and ´A. Makra, “Experimental vali- dation of a convolution-based ultrasound image formation model using a planar arrangement of micrometer-scale scatterers,” IEEE Transactions on Ultrasonics, Ferroelectrics, and Frequency Con- trol, vol. 62, no. 6, pp. 1211–1219, 2015.
[Th2] ´A. Makra, G. Cs´any, K. Szalai, and M. Gy¨ongy,
“Simultaneous enhancement of B-mode axial and lateral resolution using axial deconvolution,” Pro- ceedings of Meetings on Acoustics, vol. 32, no. 1, 2018.
[Th3] ´A. Makra, W. Bost, I. Kall´o, A. Horv´ath, M. Four- nelle, and M. Gy¨ongy, “Enhancement of acoustic microscopy lateral resolution: A comparison be- tween deep learning and two deconvolution meth- ods,” IEEE Transactions on Ultrasonics, Ferro- electrics, and Frequency Control, vol. 67, no. 1, pp.
136–145, 2020.
Other publications of the au- thor
[Au1] ´A. Makra, “Experimental validation of an ultra- sound image formation model,” Bachelor’s Thesis, P´azm´any P´eter Catholic University, Faculty of In- formation Technology and Bionics, 2013.
[Au2] ´A. Makra, “An overview of sparsity-based super- resolution algorithms for medical images,” in PhD Proceedings Annual Issues of the Doctoral School Faculty of Information Technology and Bionics 11, G. Pr´osz´eky and P. Szolgay, Eds. Budapest, Hun- gary: P´azm´any University ePress, 2016, pp. 161 – 164.
[Au3] ´A. Makra, “Design of a rapid scanning acous- tic microscope platform for super-resolution re- search,” in PhD Proceedings Annual Issues of the Doctoral School Faculty of Information Technology and Bionics 11, G. Pr´osz´eky and P. Szolgay, Eds.
Budapest, Hungary: P´azm´any University ePress, 2017, pp. 49 – 49.
[Au4] ´A. Makra, “Scanning acoustic microscope system for examining biological tissue,” Master’s Thesis, P´azm´any P´eter Catholic University, Faculty of In- formation Technology and Bionics, 2015.
[Au5] ´A. Makra, J. Hatvani, and M. Gy¨ongy., “Calcu- lation of equivalent ultrasound scatterers using a
time-domain method,”Jedlik Laboratories Reports, vol. 3, no. JLR/3-2015, pp. 7 – 12, 2015.
[Au6] K. F¨uzesi, ´A. Makra, and M. Gy¨ongy, “A stip- pling algorithm to generate equivalent point scat- terer distributions from ultrasound images,” inPro- ceedings of Meetings on Acoustics 6ICU, vol. 32, no. 1. ASA, 2017, p. 020008.
References
[1] N. S. Berko, J. N. Le, B. A. Thornhill, D. Wang, A. Negassa, E. S. Amis, and M. Koenigsberg, “Design and validation of a peer-teacher-based musculoskeletal ultrasound curriculum,”Academic Radiology, vol. 26, no. 5, pp. 701–706, 2019.
[2] J. A. Hides, D. H. Cooper, and M. J. Stokes, “Diagnos- tic ultrasound imaging for measurement of the lumbar multifidus muscle in normal young adults,” Physio- therapy Theory and Practice, vol. 8, no. 1, pp. 19–26, 1992.
[3] R. Coelho, H. Ribeiro, and G. Maconi, “Bowel thicken- ing in crohn’s disease,”Inflammatory Bowel Diseases, vol. 23, no. 1, pp. 23–34, 2017.
[4] G. T. Haar, “Ultrasound focal beam surgery,”Ultra- sound in Medicine & Biology, vol. 21, no. 9, pp. 1089 – 1100, 1995.
[5] F. Sammartino, D. W. Beam, J. Snell, and V. Kr- ishna, “Kranion, an open-source environment for plan- ning transcranial focused ultrasound surgery: techni- cal note,”Journal of Neurosurgery, pp. 1–7, 2019.
[6] W. She, T. Cheung, C. R. Jenkins, and M. G. Irwin,
“Clinical applications of high-intensity focused ultra- sound,” Hong Kong Medical Journal, vol. 22, no. 4, pp. 382 – 392, 2016.
[7] A. Iula, “Ultrasound systems for biometric recogni- tion,”Sensors, vol. 19, no. 10, p. 2317, 2019.
[8] M. Kersemans, E. Verboven, J. Segers, S. Hedaya- trasa, and W. V. Paepegem, “Non-destructive test- ing of composites by ultrasound, local defect resonance and thermography,” in Multidisciplinary Digital Pub- lishing Institute Proceedings, vol. 2, no. 8, 2018, p. 554.
[9] Z. Remili, Y. Ousten, B. Levrier, E. Suhir, and L. Be- chou, “Scanning acoustic microscopy and shear wave imaging mode performances,” IEEE 65th Electronic Components and Technology Conference (ECTC), pp.
2090–2101, 26-29 May 2015.
[10] A. Phommahaxay, I. D. Wolf, T. Duric, P. Hof- frogge, S. Brand, P. Czurratis, H. Philipsen, G. Beyer, H. Struyf, and E. Beyne, “Defect detection in through silicon vias by GHz scanning acoustic microscopy:
key ultrasonic characteristics,” IEEE 64th Electronic Components and Technology Conference (ECTC),, pp.
850–855, 27-30 May 2014.
[11] M. Fan, L. Su, L. Li, W. Wei, Z. He, C. Wong, and X. Lu, “A fuzzy SVM for intelligent diagnosis of solder bumps using scanning acoustic microscopy,”Semicon- ductor Technology International Conference (CSTIC), 13-14 March 2016.
[12] F. Naumann and S. Brand, “Numerical prototyp- ing and defect evaluation of scanning acoustic mi- croscopy for advanced failure diagnostics,” 17th In- ternational Conference on Thermal, Mechanical and
Multi-Physics Simulation and Experiments in Micro- electronics and Microsystems, pp. 1–7, 18-20 April 2016.
[13] S. Brand, F. Naumann, S. Tismer, B. Boettge, J. Rudzki, F. Osterwald, and M. Petzold, “Non- destructive assessment of reliability and quality related properties of power electronic devices for the in-line application of scanning acoustic microscopy,” 9th In- ternational Conference on Integrated Power Electron- ics Systems (CIPS), 8-10 March 2016.
[14] S. Brand, E. C. Weiss, R. M. Lemor, and M. C. Ko- lios, “High frequency ultrasound tissue characteriza- tion and acoustic microscopy of intracellular changes,”
Ultrasound in Medicine and Biology, vol. 34, pp. 1396–
1407, 2008.
[15] E. Gr¨unwald, R. Hammer, R. J¨ordis, B. Sartory, and R. Brunner, “Accretion detection via scanning acoustic microscopy in microelectronic components- considering symmetry breaking effects,” Microscopy and Microanalysis 23, vol. 23, pp. 1466–1467, 2017.
[16] M. Kim, N. Choi, Y. I. Kim, and Y. H. Lee, “Char- acterization of RF sputtered zinc oxide thin films on silicon using scanning acoustic microscopy,” Journal of Electroceramics, pp. 1–9, 2017.
[17] D. Wang, X. He, Z. Xu, W. Jiao, F. Yang, L. Jiang, L. Li, W. Liu, and R. Wang, “Study on damage evalu-
ation and machinability of UD-CFRP for the orthog- onal cutting operation using scanning acoustic mi- croscopy and the finite element method,” Materials, vol. 10, p. 204, 2017.
[18] J. Dong, X. Wu, A. Locquet, and D. S. Citrin,
“Terahertz superresolution stratigraphic characteriza- tion of multilayered structures using sparse deconvo- lution,” IEEE TRANSACTIONS ON TERAHERTZ SCIENCE AND TECHNOLOGY, vol. 7, pp. 260–267, 2017.
[19] M. S. Firouz, A. Farahmandi, and S. Hosseinpour,
“Recent advances in ultrasound application as a novel technique in analysis, processing and quality control of fruits, juices and dairy products industries: A review,”
Ultrasonics Sonochemistry, vol. 57, pp. 73–88, 2019.
[20] N. Segura, M. Amarillo, N. Martinez, M. Grompone et al., “Improvement in the extraction of hass avo- cado virgin oil by ultrasound application,”J. Food Res, vol. 7, pp. 106–113, 2018.
[21] J. M. del Fresno, I. Loira, A. Morata, C. Gonz´alez, J. A. Su´arez-Lepe, and R. Cuerda, “Application of ultrasound to improve lees ageing processes in red wines,”Food Chemistry, vol. 261, pp. 157–163, 2018.
[22] V. Akdeniz and A. S. Akalın, “New approach for yo- ghurt and ice cream production: High-intensity ultra-
sound,”Trends in Food Science & Technology, vol. 86, pp. 392 – 398, 2019.
[23] D. Rohrbach, B. Wodlinger, J. Wen, J. Mamou, and E. Feleppa, “High-frequency quantitative ultra- sound for imaging prostate cancer using a novel micro- ultrasound scanner,” Ultrasound in Medicine & Biol- ogy, vol. 44, no. 7, pp. 1341–1354, 2018.
[24] T. Mizoguchi, K. Tamura, J. Mamou, J. A. Ketter- ling, K. Yoshida, and T. Yamaguchi, “Comprehensive backscattering characteristics analysis for quantitative ultrasound with an annular array: a basic study on ho- mogeneous scattering phantom,”Japanese Journal of Applied Physics, vol. 58, no. SG, p. SGGE08, 2019.
[25] M. L. Oelze and J. Mamou, “Review of quantita- tive ultrasound: Envelope statistics and backscatter coefficient imaging and contributions to diagnostic ul- trasound,”IEEE Transactions on Ultrasonics, Ferro- electrics, and Frequency Control, vol. 63, no. 2, pp. 336 – 351, 2016.
[26] E. J. Feleppa, J. Mamou, and D. Rohrbach, “Typing and imaging of biological and non-biological materi- als using quantitative ultrasound,” 2019, uS Patent 10,338,033.
[27] J. Mamou, P. Goundan, D. Rohrbach, H. Pa- tel, E. Feleppa, and S. Lee, “In-vivo-quantitative- ultrasound assessment of thyroid nodules,”The Jour-
nal of the Acoustical Society of America, vol. 146, no. 4, pp. 2811 – 2812, 2019.
[28] S. C. Lin, E. Heba, T. Wolfson, B. Ang, A. Gamst, A. Han, J. W. Erdman, W. D. O’Brien, M. P. Andre, C. B. Sirlin, and R. Loomba, “Noninvasive diagno- sis of nonalcoholic fatty liver disease and quantifica- tion of liver fat using a new quantitative ultrasound technique,”Clinical Gastroenterology and Hepatology, vol. 13, no. 7, pp. 1337–1345.e6, 2015.
[29] L. C. Slane, J. Martin, R. DeWall, D. Thelen, and K. Lee, “Quantitative ultrasound mapping of regional variations in shear wave speeds of the aging achilles tendon,” European Radiology, vol. 27, no. 2, pp. 474–
482, 2016.
[30] N. G. Simon, J. W. Ralph, C. Lomen-Hoerth, A. N.
Poncelet, S. Vucic, M. C. Kiernan, and M. Kliot,
“Quantitative ultrasound of denervated hand mus- cles,” Muscle & Nerve, vol. 52, no. 2, pp. 221–230, 2015.
[31] J. S. Paige, G. S. Bernstein, E. Heba, E. A. Costa, M. Fereirra, T. Wolfson, A. C. Gamst, M. A. Valasek, G. Y. Lin, A. Hanet al., “A pilot comparative study of quantitative ultrasound, conventional ultrasound, and mri for predicting histology-determined steatosis grade in adult nonalcoholic fatty liver disease,” American Journal of Roentgenology, vol. 208, no. 5, pp. W168–
W177, 2017.
[32] J. Mamou, D. Rohrbach, E. Saegusa-Beecroft, E. Yanagihara, J. Machi, and E. J. Feleppa,
“Ultrasound-scattering models based on quantitative acoustic microscopy of fresh samples and unstained fixed sections from cancerous human lymph nodes,”
in 2015 IEEE International Ultrasonics Symposium (IUS). IEEE, 2015.
[33] P. Howell, “Resolution-enhancement method for dig- ital imaging,” 2003, uS Patent 6,570,613.
[34] A. Kumar, S. G. Eraniose, and A. K. Lakshmikumar,
“Multi-resolution ip camera,” 2013, uS Patent App.
13/447,202.
[35] V. A. Trofimov and V. V. Trofimov, “IR camera tem- perature resolution enhancing using computer process- ing of IR image,” in Thermosense: Thermal Infrared Applications XXXVIII, J. N. Zalameda and P. Bison, Eds. SPIE, 2016.
[36] H. Demirel and G. Anbarjafari, “Satellite image res- olution enhancement using complex wavelet trans- form,”IEEE Geoscience and Remote Sensing Letters, vol. 7, no. 1, pp. 123–126, 2010.
[37] O. Harikrishna and A. Maheshwari, “Satellite image resolution enhancement using dwt technique,” Inter- national Journal of Soft Computing and Engineering (IJSCE), vol. 2, no. 5, pp. 274 – 278, 2012.
[38] H. Demirel and G. Anbarjafari, “Discrete wavelet transform-based satellite image resolution enhance- ment,”IEEE Transactions on Geoscience and Remote Sensing, vol. 49, no. 6, pp. 1997–2004, 2011.
[39] M. Z. Iqbal, A. Ghafoor, and A. M. Siddiqui,
“Satellite image resolution enhancement using dual- tree complex wavelet transform and nonlocal means,”
IEEE Geoscience and Remote Sensing Letters, vol. 10, no. 3, pp. 451–455, 2013.
[40] P. Rasti, I. Lusi, H. Demirel, R. Kiefer, and G. An- barjafari, “Wavelet transform based new interpolation technique for satellite image resolution enhancement,”
in 2014 IEEE International Conference on Aerospace Electronics and Remote Sensing Technology. IEEE.
[41] M. Farrar and E. Smith, “Spatial resolution enhance- ment of terrestrial features using deconvolved SSM/i microwave brightness temperatures,” IEEE Transac- tions on Geoscience and Remote Sensing, vol. 30, no. 2, pp. 349–355, 1992.
[42] G. Daniell and S. Gull, “Maximum entropy algorithm applied to image enhancement,” IEE Proceedings E- Computers and Digital Techniques, vol. 127, no. 5, pp.
170–172, 1980.
[43] E. Eisemann and F. Durand, “Flash photography en- hancement via intrinsic relighting,” inACM transac-
tions on graphics (TOG), vol. 23, no. 3. ACM, 2004, pp. 673–678.
[44] T. Mertens, J. Kautz, and F. V. Reeth, “Exposure fusion: A simple and practical alternative to high dy- namic range photography,” Computer Graphics Fo- rum, vol. 28, no. 1, pp. 161–171, 2009.
[45] T. Schulz, B. Stribling, and J. Miller, “Multiframe blind deconvolution with real data: imagery of the hubble space telescope,”Optics Express, vol. 1, no. 11, p. 355, 1997.
[46] A. S. Carasso, “APEX blind deconvolution of color hubble space telescope imagery and other astronomical data,”Optical Engineering, vol. 45, no. 10, p. 107004, 2006.
[47] J. L. Hershey, “A deconvolution technique for hubble space telescope fgs fringe analysis,”Publications of the Astronomical Society of the Pacific, vol. 104, no. 677, pp. 592 – 596, 1992.
[48] R. L. White, “Image restoration using the damped lucy–richardson method,” in Instrumentation in As- tronomy VIII, D. L. Crawford and E. R. Craine, Eds.
SPIE, 1994.
[49] T. L. Szabo,Diagnostic Ultrasound Imaging: Inside Out. Academic Press, 2004.
[50] J. C. Bamber and R. Dickinson, “Ultrasonic B- scanning: A computer simulation,”Phys. Med. Biol., vol. 25, no. 3, pp. 463–479, 1980.
[51] C. R. Hill, J. C. Bamber, and G. R. ter Haar,Physical Principles of Medical Ultrasonics, 2nd ed. Chichester, UK:John Wiley and Sons, 2004.