SEMMELWEIS EGYETEM DOKTORI ISKOLA
Ph.D. értekezések 2024.
CELENG CSILLA
Szív-és érrendszeri betegségek élettana és klinikuma című program
Programvezető: Dr. Merkely Béla, egyetemi tanár Témavezető: Dr. Maurovich-Horvat Pál, egyetemi adjunktus
Imaging of the Coronary Arteries and Aortic Root with Computed Tomography Angiography
Doctoral Thesis
Csilla Celeng
Doctoral School of Basic Medicine Semmelweis University
Supervisor: Pál Maurovich-Horvat, MD, Ph.D.
Official reviewers: Albert Varga, MD, D.Sc.
Lívia Jánoskuti, MD, Ph.D.
Head of the Final Examination Committee:
Viktor Bérczi, MD, D.Sc.
Members of the Final Examination Committee:
Attila Doros, MD, Ph.D.
László Sallai, MD, Ph.D.
Budapest, 2017
Table of Contents
Abbreviations ... 4
1. INTRODUCTION ... 6
1.1 CTA for the assessment of the coronary arteries ... 8
1.2 Prospectively ECG-triggered image acquisition ... 12
1.3 Diastolic and systolic acquisition with absolute and relative delay ... 13
1.4 Premedication before coronary CTA ... 14
1.5 Anatomy of the aortic root ... 15
1.6 CTA for the assessment of the aortic root ... 17
1.7 Determinants of the aortic root geometry: genetics versus environment ... 19
2. OBJECTIVES 2.1 Defining the optimal systolic phase targets by using absolute delay ... 20
2.2 Defining the efficacy and safety of esmolol vs. metoprolol ... 20
2.3 Defining the heritability of the aortic root by CTA and TTE ... 20
3. METHODS 3.1. Study design and study population for optimal systolic phase ... 21
3.1.1 Coronary CTA data acquisition and image analysis ... 21
3.1.2 Coronary artery velocity mapping ... 24
3.2. Study design and population for esmolol vs. metoprolol ... 26
3.2.1 Drug administration protocol and heart rate monitoring ... 27
3.2.2 Coronary CTA scan protocol ... 28
3.3. Study design and population for heritability of the aortic root ... 29
3.3.1 CTA scan and drug administration protocol ... 30
3.3.2 CTA analysis of the aortic root ... 31
3.3.3 TTE imaging of the aortic root ... 33
3.4 Statistical analyses ... 34
3.4.1 Sample size calculation for the esmolol vs. metoprolol study ... 34
3.4.2 Statistical analysis for heritability estimates ... 35
4. RESULTS 4.1 Optimal systolic phase targets by using absolute delay ... 37
5. DISCUSSION
5.1 Systolic image reconstruction by using absolute delay ... 52
5.2 The use of esmolol before coronary CTA ... 56
5.3 Impact of the imaging method on heritability of the aortic root ... 59
5.4 Limitations... 61
5.5 Future Perspectives... 63
6. CONCLUSIONS ... 66
7. SUMMARY ... 67
8. ÖSSZEFOGLALÁS ... 68
9. BIBLIOGRAPHY ... 69
10. BIBLIOGRAPHY OF THE CANDIDATE'S PUBLICATIONS ... 84
10.1 Publications closely related to the present thesis ... 84
10.2 Publication not related to the present thesis ... 84
ACKNOWLEDGEMENTS ... 87
Abbreviations
2D 2-dimensional 3D 3-dimensional
A area
A additive genetic effects AHA American Heart Association AIC Akaike Information Criterion ALARA As Low As Reasonably Achievable AM1 acute marginal branch
Ao ascending aorta
BIC Bayesian Information Criterion BMI body mass index
bpm beat per minute
C circumference
C common environmental effects CAD coronary artery disease
CAVI transcatheter caval valve implantation CI confidence interval
cMPR curved multiplanar reformation CTA computed tomography angiography
D mean diameter
D dominant genetic effects D1 diagonal 1 branch D2 diagonal 2 branch DL long diameter DS short diameter DZ dizygotic twins
E unique environmental effects ECG electrocardiography
GWAS genome-wide association studies HR heart rate
ICT isovolumic contraction time IRB institutional review board
IV intravenous
kV kilovolt
LA left atrium
LAD left anterior descending artery LCX circumflex artery
LM left main coronary artery LV left ventricle
LVET left ventricular ejection time LVOT left ventricular outflow tract mAs milliampere-second
mg milligram
MIP maximum intensity projections mL/s milliliter/second
mm Hg millimeter of mercury mm/s millimeter second
MPR multiplanar reformation
ms millisecond
MZ monozygotic twins OM1 obtuse marginal 1
P phenotype
PDA posterior descending artery PEP pre-ejection period
RA-IVC right-atrium inferior vena cava RCA right coronary artery
RFCA radiofrequency catheter-ablation
SCCT Society of Cardiovascular Computed Tomography TAVI transcatheter aortic valve implantation
TGFBR transforming growth factor-beta receptor TTE transthoracic echocardiography
VRT volume rendering technique reconstructions
1. INTRODUCTION
In the past years computed tomography angiography (CTA) has become a widely adopted non-invasive imaging technique for the direct visualization of coronary artery disease (CAD). High spatial resolution of current CT scanners allows for detailed anatomical and morphological evaluation of atherosclerotic plaques, while high temporal resolution enables to acquire the fast-moving coronary arteries. In addition the 3-dimensional (3D) nature of CTA provides precise visualization of complex cardiac structures thus aiding in the planning of structural heart interventions such as transcatheter aortic valve implantation (TAVI) as one of the most successful examples.
Cardiac CTA however is a technically demanding procedure and motion artifacts caused by the constant movement of the heart present the chief challenge. Therefore optimized timing of the acquisition window with the least motion is utmost importance to achieve diagnostic image quality.
One option to assess motion-free images is the synchronization of the acquisition window to the phase of the cardiac cycle with minimal coronary arterial motion.
Current guidelines report the use of prospectively ECG-triggered image acquisition [1]
preferably in the most tranquil period of the cardiac cycle, which at low and stable heart rates (HR) is during mid-diastole (during diastasis) [2, 3] and in patients with high HR is during end-systole [4, 5].
Another method to achieve favorable image quality is the reduction of HR. In patients undergoing coronary CTA HR should be <65 beats per minute (bpm) and optimally <60 bpm to achieve excellent image quality and low effective radiation dose [6]. Metoprolol is the first-line β-blocker for HR lowering [7-9]. However, potential contraindications and side-effects (e.g. reactive airway disease, bradycardia, hypotension) might hamper its use in a subset of patients. During coronary CTA, short and effective HR control is desirable; short-lasting intravenous (IV) esmolol therefore might be a good alternative for metoprolol. Currently, esmolol is routinely administered in the intensive care unit for the treatment of acute supraventricular arrhythmias; however, administration before coronary CTA for HR reduction is an “off-label” indication.
Motion-free images are the pre-requisite to assess accurate and reproducible
Commercially available semi- and fully automated software algorithms aim to standardize image analysis thus providing reliable measurements, which are critical for clinical and research applications. Computer aided analysis might provide more reproducible measurements, thus reduce the frequency of reader disagreements.
Furthermore, automatic post-processing of image data, will likely increase efficacy in clinical practice.
1.1 CTA for the assessment of the coronary arteries
The excellent image quality provided by high-resolution CT scanners enables direct and reliable evaluation of the coronary arteries. Prior to CTA a preliminary interpretation of prospectively ECG-triggered calcium score scan is performed. This allows for the detection of calcified lesions across the coronary arteries. Based on the area-density of the lesions the software generates the Agatston-score, which is calculated by multiplying the lesion area (mm2) by a density factor (between 1 and 4 based on the voxel with the highest density) [10].
The non-contrast examination is followed by IV administration of iodinated contrast agent, which enables to reach uniform enhancement among coronary arteries and permits direct visualization of the coronary lumen and atherosclerotic plaques. Based on the presence and quantity of calcified plaque components atherosclerotic lesions are classified into three categories: calcified, partially calcified and non-calcified plaques [11]. The Society of Cardiovascular Computed Tomography (SCCT) released a standardized diagram that is recommended for the reporting of coronary artery lesions.
The diagram is based on the American Heart Association (AHA) coronary segmentation, with an addition of the ramus intermedius (segment 17) and left posterolateral branch (segment 18) (Figure 1) [12].
The anatomical complexity of the coronary arteries requires cardiac specific platforms, which are capable to display the 3D dataset in all conventional reconstruction formats.
These include transaxial 2-dimensional (2D) image stacks, multiplanar reformations (MPR), maximum intensity projections (MIP), curved multiplanar reformations (cMPR), and volume rendering technique (VRT) reconstructions (Figure 2).
Artifact-free images are the most important prerequisite for the diagnostic evaluation of the coronary arteries. Continuous motion of the heart, calcifications, image noise and poor contrast enhancement might substantially degrade the quality of the exam. The desired temporal resolution for complete motion-free image is 19 millisecond (ms) [13].
Since the temporal resolution of modern CT scanners is 75-175 ms [14] motion artifacts are often present, especially in the midsegment of the RCA [15]. “Stairstep artifacts” or according to a newer terminology “misalignment artifacts” [11] occur between
Figure 1. Coronary artery segmentation diagram by the Society of Cardiovascular Computed Tomography (SCCT) [12]
LM: left main; LAD: left anterior descending artery; D1: diagonal 1; D2: diagonal 2;
LCX: circumflex artery; OM1: obtuse marginal 1; OM2: obtuse marginal 2; RCA: right coronary artery; PDA: posterior descending artery; R-PDA: PDA from RCA; L-PDA:
PDA from LCX; PLB: posterolateral branch; R-PLB: PLB from RCA; L-PLB: PLB from LCX. Dashed lines represent division between RCA, LAD, and LCx and the end of the LM.
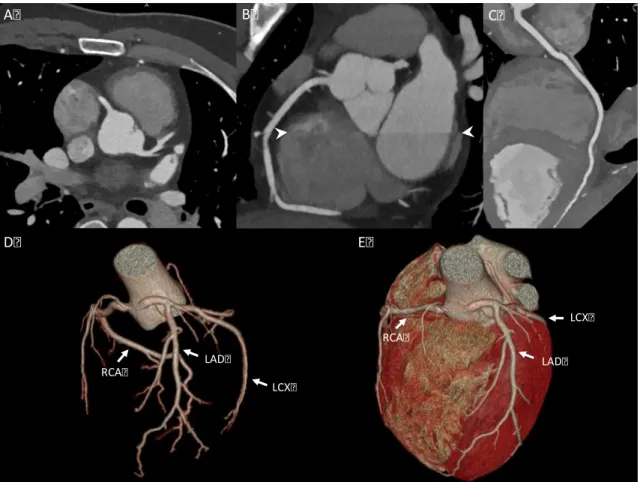
Figure 2. CTA images and volume-rendered images of the coronary arteries and the heart (own material)
A: axial image of the LAD and RCA; B: coronal, multiplanar, maximal intensity projection image of the RCA and misalignment artifact (white arrowheads); C: curved multiplanar image of the RCA; D: volume-rendered 3D image of the coronary tree; E:
volume-rendered 3D image of the heart. LAD: left anterior descending artery; LCX: left circumflex artery; RCA: right coronary artery
LCX LAD
RCA
LCX
LAD RCA
A B C
D E
One option to eliminate vessel misalignment artifacts is reconstruction of the dataset in different phases of the cardiac cycle. In general coronary arteries are optimally imaged when the heart moves the least, which occurs in mid-diastole (during diastasis).
However with increasing HR this period shortens, and end-systolic reconstruction (period of the isovolumic relaxation) might render fewer motion artifacts.
Retrospective ECG gating provides continuous data acquisition during the cardiac cycle with the potential of diastolic as well as systolic image reconstruction. However concerns have been raised regarding the ALARA principle, which states that the radiation dose to a patient should be As Low As Reasonably Achievable. Currently, when performing cardiac CTA prospectively ECG-triggered scan protocol is preferred, which applies radiation only at pre-defined points of the cardiac cycle and is able to reduce the radiation exposure by 70 % [16]. Using this method however image reconstruction is limited to a pre-determined temporal-window.
Image quality can be also substantially improved by appropriate pre-medication of patients with higher heart. Previous studies demonstrated that a HR of <65 bpm yielded the least motion artifacts [17-19]. The administration of β-blockers is commonly performed prior to cardiac CTA. In addition sublingual nitroglycerin is often used for the dilation of the coronary artery lumen thus increase the number of evaluable segments. The main objective of the image quality improvement is to increase the diagnostic accuracy of CTA for the detection of CAD.
1.2 Prospectively ECG-triggered image acquisition
Radiation exposure is a major concern in coronary CTA. A multicenter (50 sites), observational study sought to estimate radiation dose in 1,965 patients undergoing coronary CTA. The median effective dose was 12 mSv [20]. Comparatively, invasive coronary angiography effective dose values ranges from approximately 5 to 7 mSv [21, 22]. When interpreting coronary CTA, data is acquired with either helical (also known as spiral) or axial scan mode. In helical image acquisition the gantry is continuously rotating while the patient table smoothly moves through. In contrary during axial scan mode the x-ray tube and detector system must complete a full (360-degree) or partial (180-degree) rotation around the patient while the patient table is stationary. The table moves incrementally along the z-axis (also known as pitch) to collect data [23].
Synchronization of axial scanning with the cardiac cycle is achieved by using the ECG signal. During prospectively-ECG triggered or also known as “step and shoot” scan image acquisition is initiated after the detection of the R-peak and data is obtained within a predefined-phase of the R-R interval. While the table moves to the next z-axis position radiation exposure is suspended. This “step” then repeats until the entire heart is covered. Images acquired with this method can be reconstructed within a pre- specified period of the cardiac cycle. Prospectively-ECG triggered scans permit data acquisition at doses of 1-6 mSv [24-26]. Newer developments on CT systems allow prospectively-ECG triggered helical scanning with high pitch values, thus providing ultra-low-dose image acquisition (<1 mSv) [27].
In the multivendor PROTECTION III study image quality of patients with prospectively-ECG triggered axial scan protocol was not inferior to helical scan protocols (subjective image score 3.36±0.59 vs. 3.37±0.59, p=0.866), and the use of axial scan protocols resulted in a 70% radiation dose reduction (3.5±2.1 mSv vs.
11.2±5.9 mSv, p<0.001) [16]. However, images obtained with this method are more prone to cardiac motion artifacts, therefore patients undergoing this scan technique have to be carefully selected. A prerequisite to achieve diagnostic image quality is the stable or low HR with a suggested cut-off of <65 bpm and optimally <60 bpm [6, 16, 28, 29].
Hence coronary CTA is customarily performed in selected patients with favorable HR and rhythms, and premedication is often required to induce bradycardia, usually via
1.3 Diastolic and systolic acquisition with absolute and relative delay
CTA image acquisitions are typically performed in the most quiescent period of the cardiac cycle during mid-diastole [3, 30]. While the duration of this period is relatively lengthy and predictable in patients with low and stable HR, at higher HRs the length of diastasis significantly shortens and eventually disappears [31]. Alternatively, the end- systolic phase is the second relatively quiet phase where data acquisition is suitable [32]. This period is also less sensitive to R-R variability and arrhythmia as compared to diastole [30, 33]. For example, the length of systole shortens by 5.6 % as HRs increase from 80 to 90 bpm, while at the same time the length of diastole decreases by 16.4 % [34]. Thorough investigations have established that image reconstruction using diastolic data is favorable at HRs under 65 bpm [3, 4, 35], while at increased HRs, the end- systolic and early-diastolic reconstructions are more favorable [4, 36, 37]. Furthermore, the length of systole is a relatively fixed phenomenon, and end-systole can be targeted by using absolute delay times, as opposed to defining the timing of systole as a fraction of the cardiac cycle.
In cardiac CTA, several image reconstruction algorithms related to ECG signal can be utilized to obtain diagnostic image quality [38]. Typically images are reconstructed during the least motion or between T and P waves. The most frequently used approach is the relative delay method, in which the reconstruction starts after a certain delay from the prior wave which is ascribed as a certain percentage of the R-R interval. Another method is the absolute delay method in which reconstruction starts at a fixed time delay before or after the R wave and is ascribed as a specific time delay in milliseconds [39].
Of note, comparisons of the two image reconstruction techniques have been infrequently investigated.
1.4 Premedication before coronary CTA
Metoprolol is the IV β-blocker of choice for HR lowering in patients undergoing coronary CTA [7-9]. β-blockers are safe and efficacious in most patients, but contraindications such as reactive airway disease and hypotension are occasionally a serious challenge [7]. However, a previous survey revealed that 50% of centers allow an HR of more than 70 bpm for coronary CTA, mainly because of concerns regarding potential side effects of β-blocker administration [40]. The half-life of IV metoprolol is approximately 3 to 7 hours; therefore, if adverse effect occurs as a result of the HR- lowering, it may debilitate the patient for hours. These data indicate the need for a safe, short-lasting HR control. Esmolol is a cardioselective IV β-blocker with a rapid onset (within 2-3 minutes) and ultrashort duration of action (mean half-life [t1/2] = 9 minutes) [41]. The rapid onset and offset of effects of esmolol provide an element of safety not previously available with longer-acting β-blockers [42]. However, no direct comparison between esmolol vs. metoprolol for HR control during coronary CTA is available.
Nitroglycerine is frequently used alongside β-blockers for rapid dilation of the coronary arteries. Nitroglycerin is routinely administered to alleviate the discomfort of angina and has a half-life of about 5 minutes [43, 44]. The administration of sublingual nitroglycerin during coronary CTA improves the evaluation of coronary segments, in particular, in smaller coronary branches as well as provides better image quality and improved diagnostic accuracy. A comprehensive systematic review on the use of sublingual nitroglycerine in coronary CTA suggests that the optimal starting time for image acquisition is probably between 3 and 4 minutes after sublingual administration of nitroglycerin [45]. Sublingual spray is superior to the sublingual tablet as it is more efficacious and is associated with fewer side effects [46, 47]. The most common side effects are headache and dizziness, which are typically the consequence of nitrate- induced hypotension [47, 48]. A compensatory mechanism for nitrate-induced hypotension is the increase of HR, which might hamper the image acquisition.
Available data is controversial regarding HR changes after the administration of sublingual nitroglycerine. Some of the previous studies found no significant HR/blood
1.5 Anatomy of the aortic root
The aortic root originates from the basal attachments of the aortic valve leaflets within the left ventricular outflow tract (LVOT) and extends cranially to the sinotubular junction. It surrounds and supports the aortic valve and functions as a transition zone where the ventricular structure changes into fibroelastic tissue of the aortic trunk. The aortic root is a geometrically complex structure, which includes the annulus, the semilunar aortic leaflets, the interleaflet triangles, the sinus of Valsalva, and the sinotubular junction [54, 55]. There are three dilations (sinuses) in the wall of the aortic root just superior to the semilunar leaflets. Two of the three sinuses give rise to the coronary arteries (Figure 3).
Figure 3. Aortic root with aortic valve on the inside [56]
The three valve leaflets are connected to the inner wall of the aorta creating the interleaflet triangles. Two of the three sinuses give rise to the origin of the left main (LM) and right coronary artery (RCA).
Sinus of Valsalva
Sinotubular junc2on
Interleaflet
triangle Semilunar leaflet
Ascending aorta
RCA
LM
The annulus is not a true anatomical entity but is a virtual ring defined by the lowest insertion points (i.e. hinge points) of the three aortic leaflets (Figure 4).
Figure 4. Aortic root with the virtual ring of the annulus [57]
Annulus defined as a virtual ring formed by the 3 lowest insertion points (i.e. hinge points).
When obtaining aortic root measurements with transthoracic echocardiography (TTE) the following dimensions are recorded: the annulus, diameter of the sinus of Valsalva, diameter of the sinotubular junction and diameter of the proximal ascending aorta (Figure 5).
Figure 5. Aortic root measurements by TTE [58]
1. annulus; 2. sinus of Valsalva; 3. sinotubular junction; 4. ascending aorta; LV: left ventricle; LA: left atrium; Ao: aorta. Dashed lines depicting the longitudinal axes of the LV and of the aortic root.
LV
1
2 3 4
LA Ao
1.6 CTA for the assessment of the aortic root
The aortic root is a complex anatomical structure therefore its 3D imaging is of paramount importance. CTA provides isotropic data, which can be reconstructed in any 3D imaging plane.
The annulus is the tightest part of the aortic root and is defined as a virtual ring formed by the 3 lowest points (i.e. hinge points) of the aortic leaflets as they connect to the wall of the LVOT [55]. A post-mortem study revealed that the shape of the annulus is not circular but rather oval [59]. 2D measurements (e.g. 2D TTE) of the annulus are therefore limited as they are based on a single plane, assuming a circular plane of the annulus. However, CTA-based findings are in line with autopsy findings, and suggest, that the annulus has an oval configuration in approximately 50% of patients evaluated for TAVI procedure, with a mean difference of 2.9±1.8 mm between coronal and sagittal views [60]. Another CTA study reported an oval shape of the annulus in 91% of patients [61]. These differences might be attributable to the methodology used for image analysis. Previously, during CTA measurement of the aortic root, short (DS) and long (DL) diameters of the annulus were measured on the coronal and sagittal views, which roughly correspond to long-axis or 3-chamber view on TTE. The disadvantage of this method was, that it did not provide a clearly defined plane, which is required to identify the true short and long diameters of the annulus. Precise diameters can be measured by manipulating other planes to create a double-oblique plane, which contains the 3 insertions points. When the plane has been obtained measurement of the short and long diameters is necessary to calculate the mean diameter (D) of the aortic annulus: [D = (DL + DS)/2] [1]. The second important parameter, when measuring aortic annulus is the area (A) and calculation of the diameter that corresponds to this area under the assumption of full circularity: [D = 2√(A/π)]. The third measurement is the circumference (C) of the aortic annulus and calculation of the circumference-derived diameter: (D = C/π) [1] (Figure 6). Besides the annulus, diameter of LVOT, sinus of Valsalva, sinotubular junction and ascending aorta can be precisely extracted from the CTA dataset (Figure 7).
Figure 6. Assessment of the annulus dimensions by CTA (own material)
A: the 3 lowest insertion points of the aortic leaflets (white arrows); B: long and short diameter (left-right white arrows) and calculated mean diameter; C: area and area- derived diameter; D: circumference and derived diameter
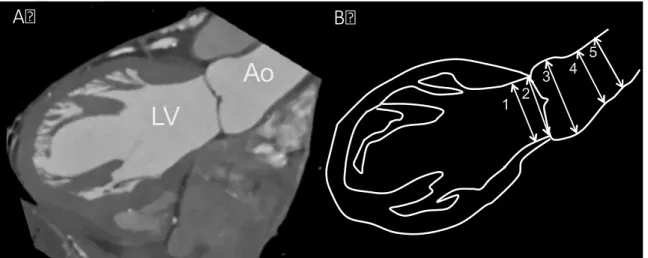
Figure 7. Relevant aortic root measurements by CTA (own material)
A: CTA image of the left ventricle (LV) and aorta (Ao); B: Outline of the LV and Ao with other relevant aortic root measurements: 1. left ventricular outflow tract; 2.
annulus; 3. sinus of Valsalva; 4. sinotubular juntion; 5. ascending aorta
Short axis: 20.6 mm Long axis: 26.5 mm Mean diameter: 23.6 mm
Area: 4.34 cm2
Derived diameter: 23.5 mm
Circumference: 7.68 cm Derived diameter: 24.4 mm
A B C D
1 2 3 4 5
1. LVOT 2. Annulus
3. Valsalva Sinus
4. Sinotubuláris junkció 5. Aorta ascendens LV
Ao
Az aortagyök ábrázolása CT-vel
A B
1.7 Determinants of the aortic root geometry: genetics versus environment
The configuration of the aortic root is determined by genetic and environmental factors [62-66], however their respective contributions are still unclear. Assessment of genetic influence might help to identify subjects predisposed to future aortic root dilation.
Previous studies examining the heritability of the aortic root diameter using TTE observed moderate genetic effect [63, 67], which indicates that a major proportion of phenotypic variance is due to environmental factors [63].
However, technical limitations of TTE can affect the accuracy of heritability estimates.
Higher inter-reader variability of TTE versus CTA in the assessment of the annulus was previously demonstrated [68]. Furthermore, a retrospective comparison of aortic root dimensions by CTA and TTE demonstrated that TTE systematically underestimates the aortic root dimensions in patients with dilated aortic root [69]. Importantly, measurement errors artificially inflate the magnitude of environmental effects in heritability studies. Therefore, heritability estimates of the aortic root might be influenced by the measurement method. Precise measurements can provide more realistic estimates of genetic dependency.
Heritability estimates are frequently investigated among family studies which allow for the estimation of the risk for the disorder in relatives. However, their drawback is that the estimate of risk may include both genetic and environmental influences. As twins share environmental factors to a unique degree [70], environmental confounders are minimized and the role of genetic influence can be well investigated.
Environmental factors are also crucial in defining phenotypes. Results of the Framingham Heart Study concluded that age, height, weight and sex are the principal determinants of aortic root diameters [71]. Several investigations examined the effect of hypertension over the aortic root [65, 66, 71], however its association with the enlargement of aortic metrics is still unclear [66, 72]. A recent meta-analysis found no direct association between BP values and aortic root size [66]. Therefore equipoise remains on the impact of hypertension on aortic root dimensions.
2. OBJECTIVES
2.1 Defining the optimal systolic phase targets by using absolute delay
Coronary artery motion and deformation during cardiac cycle lead to significant motion artifacts when velocity of the coronaries exceeds the temporal resolution of the CT scanner. Furthermore, diastolic image acquisition might not be sufficient in patients with higher and/or variable HR. Therefore we aimed to determine the optimal systolic phase targets based on the velocity of the coronary arteries in patients at various HRs by using an absolute reconstruction delay time within the R-R interval.
2.2 Defining the efficacy and safety of esmolol vs. metoprolol
Artifact-free images are of importance for the diagnostic assessment of coronary arteries. Therefore adequate premedication of patients with higher HR prior to coronary CTA is recommended. The most common approach is the administration of IV metoprolol, however potential side-effects might hamper its application. Our aim was to investigate whether ultrashort half-life esmolol is at least as efficacious as the standard of care IV metoprolol for HR reduction during coronary CTA. We also sought to estimate the incidence of bradycardia (defined as HR <50 bpm) or hypotension (defined as systolic BP <100 mm Hg) as an effect of β-blockers in the esmolol and metoprolol groups.
2.3 Defining the heritability of the aortic root by CTA and TTE
2D and 3D imaging of the aortic root often show measurement discrepancies.
Therefore, heritability estimates of aortic root dimensions can also vary upon the measurement method. We sought to assess the extent of heritability of the aortic root dimensions with the use of CTA in monozygotic (MZ) and dizygotic (DZ) twins.
Furthermore, we aimed to derive TTE-based heritability estimates and compare these with the CTA based results.
3. METHODS
3.1 Study design and study population for optimal systolic phase
This retrospective cohort study consisted of 21 selected patients (14 men, 7 women;
mean age 53.6 years ± 13.1; age range, 29-78 years) who were referred for clinically indicated coronary CTA between November 2012 and May 2013 at the Department of Radiology, Massachusetts General Hospital. Patient selection was based on a clinical decision to target a systolic image reconstruction time interval (from at least 200-420 ms). None of the selected patients had coronary anomalies, nor had undergone coronary artery bypass grafting or prior electrophysiological interventions (such as ablation procedures, pacemaker implantation, or defibrillator implantation). Patients were divided into three groups based on mean HR (<65; 65-80; or >80 bpm). The mean HR was 71 bpm (range 52-96 bpm). The study was approved by the human research committee of the institutional review board (IRB), and compliance with the Health Insurance. A waiver of consent was obtained from our local IRB for this retrospective study.
3.1.1 Coronary CTA data acquisition and image analysis
All examinations were performed on a second-generation dual-source 128-slice CT scanner (SOMATOM Definition Flash, Siemens Medical Systems, Forchheim, Germany) with the following acquisition parameters: 128 slices at 0.6 mm thickness (using a z-axis flying focal spot) and gantry rotation time of 280 ms (and resultant temporal resolution of 75 ms). Tube potential (kilovolt-kV) and tube current (milliampere-second-mAs) were calculated by an automatic tube potential selection algorithm based on antero-posterior scout image characteristics (CAREDose 4D and CAREkV, Siemens) [73]. Prospectively ECG-triggered axial-sequential acquisition (Sequential Scanning; Siemens) with an advanced arrhythmia rejection algorithm mode (Adaptive Cardio Sequence, “Adaptive Cardio Sequential Flex mode”, Siemens) was used in 18 scans, which enabled to reject and reacquire data at table positions scanned during heartbeats falling outside of a pre-specified cardiac cycle length. Systolic acquisition was performed using an absolute delay of 200-460 ms after the R-wave with peak (100 % of prescribed reference) tube current from 300 to 400 ms and a baseline plateau (20 % of the reference tube current) in the other prescribed phases [74].
Three patients underwent retrospectively ECG-gated CTA with peak targets in the same phases of systole and with aggressive (“MinDose”, Siemens) tube modulation outside of the 200-460 ms window. Raw datasets were reconstructed in 20 ms increments between 200 to 460 ms after the R peak using 1 mm thick slices and archived at the picture archival and communication system (PACS). Images were retrieved and displayed on a 3D workstation (Osirix v. 3.7.1 32-bit, Pixmeo, Geneva, Switzerland). Image review included axial source images, orthogonal and oblique MPR images, and thin slab MIP images, while advancing manually through the various acquired phases in 4- dimensional (cine) mode (Figure 8).
Figure 8. Raw dataset reconstructions in 20 ms increments after the R peak [75]
Multiple axial reconstructions of the right heart during systole (absolute delays after the R-wave from 180 ms through 460 ms, in 20 ms increments) demonstrate the optimal phase time of 340 ms at the level of the acute marginal branch (white arrow). RA: right atrium; LA: left atrium, AV: aortic valve; RVOT: right ventricular outflow tract
In patients without contraindications, 0.6 mg of sublingual nitroglycerine was administered approximately 5 min prior to scanning. Importantly, none of the patients received β-blockers during the examination, which was a decision at the discretion of the supervising CT physician as per standard site practice. However, 9 (43%) patients’
home baseline regimen included oral β-blockers.
Arterial phase contrast was timed using the test bolus method using 20 ml iodinated contrast media (Iopamidol 370 g/cm3, Bracco Diagnostics Princeton, NJ USA) injected at a rate of 4-7 mL/s (based on body-mass index and IV access as per clinical routine) via an antecubital vein using a power injector. All injections were followed by a 40 ml of normal saline flush at a matching flow rate.
All scans were supervised by cardiovascular imaging specialists (at least one board- certified or eligible radiologist or cardiologist with advanced training in cardiac CT).
3.1.2 Coronary artery velocity mapping
Based on the SCCT coronary segmentation guidelines [12], six coronary artery landmarks, including the right coronary artery (RCA), first acute marginal branch (AM1), posterior descending artery (PDA), left main coronary artery (LM), first obtuse marginal branch (OM1), and second diagonal branch (D2) were identified in each patient, in 20 ms increments, by two experienced physicians.
The end systolic phase and the end of isovolumic relaxation phases were identified with the aortic valve closure and initiation of mitral valve opening on the three-chamber cine view as demonstrated in Figure 9.
Figure 9. Defining the end systolic phase and the end of isovolumic relaxation on three- chamber cine view [75]
Images were reconstructed throughout the acquired systolic intervals and they demonstrating the aortic (AV) and mitral (MV) valve. Aortic valve closure (black asterisk at 300 ms reconstruction) and the initiation of mitral valve opening (white asterisk at 340 ms reconstruction) can be identified, which denote the end of the systolic reduced ejection phase, and the end of the isovolumic relaxation, respectively.
!
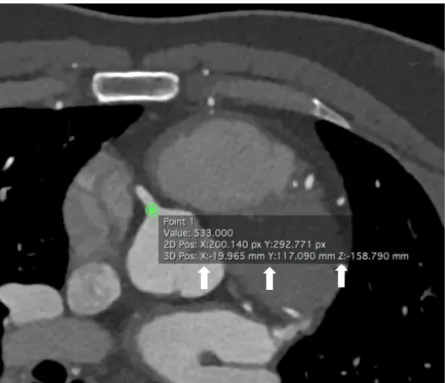
Coronary artery landmark position was traced manually by placing the cursor in the exact center of each landmark in every phase. The x, y and z-coordinates of the selected landmark were then recorded (Figure 10) and were used for the calculation of the 3D route of coronary artery motion by using a previously established method [15]. The velocity of the given landmark was defined as the quotient of the route and the length of the time interval, which was 20 ms.
Figure 10. Axial CTA image of the heart with the origin of the RCA (own material) X, Y and Z (white arrows) indicate the coordinates of the RCA origin and are used for the calculation of the coronary artery velocity
To determine the optimal velocities in each coronary artery segment, the mean values of the minimum velocities were calculated separately for each HR group (i.e. <65; 65-80;
and >80 bpm). The ideal reconstruction times in each HR group were defined as the R- R interval with the lowest minimum mean velocity in a given segment.
A preliminary analysis of 10 patients revealed that the mean lowest coronary artery velocities in each segment occurred in the middle (280-340 ms) of the selected time interval (200-460 ms). Therefore we divided this interval into three sections from: 200 to 260 ms (early), 280-340 ms (mid) and 360-420 ms (late), to observe if any significant difference existed between the three sections.
3.2 Study design and population for esmolol vs. metoprolol
Our study was a randomized single-center non-inferiority phase III clinical trial that compared two IV β-adrenergic receptor blockers to reduce HR in patients who underwent coronary CTA because of suspected CAD between April 2013 and September 2013 at Heart and Vascular Center, Semmelweis University. Subjects who had HR >65 bpm despite oral metoprolol pretreatment were enrolled in the study.
Patients with history of a coronary intervention and an implanted stent with a diameter
≥3 mm or previous coronary artery bypass surgery were eligible to participate in the study [76]. Individuals with a HR other than sinus rhythm, any contraindication against β-blocker (asthma bronchiale, chronic obstructive pulmonary disease, any type of documented atrioventricular block, severe aortic valve stenosis, severe left ventricular dysfunction characterized by ejection fraction below 30%), or a systolic BP <100 mm Hg before the coronary CTA scan were excluded from the study. In total, 650 consecutive patients referred to coronary CTA were screened, and of these, 574 patients were eligible to participate in the study. In 162 patients no IV drug was administered because the HR before scan was ≤65 bpm. In total, 412 patients (with HR >65 bpm before the scan) were enrolled and randomized into either esmolol or metoprolol group;
204 patients received IV esmolol and 208 patients received IV metoprolol (Figure 11).
Figure 11. Flow chart of the study [77]
Bpm: Beat per minute; CCTA: coronary CT angiography; IV: intravenous; HR: heart
Patients were excluded 4 Declined to participate
42 Non-sinus rhythm, significant arrhythmia 2 Atrioventricular block
16 Asthma bronchiale
8 Chronic obstructive pulmonary disease 1 Severe aortic stenosis
3 Severe left ventricular dysfunction 76
162 Patients with HR ≤65 bpm before CCTA received no IV drug
204 Patients received IV esmolol 208 Patients received IV metoprolol 650 Consecutive patients referred for CCTA
574 Patients were eligable for the study and received oral metoprolol
412 Patients with HR >65 bpm before CCTA were randomized for IV drug administration
3.2.1 Drug administration protocol and heart rate monitoring
Patients received 50-mg oral metoprolol at arrival if the HR was >65 bpm. If the HR was ≥80 bpm, 100-mg oral metoprolol was administered. The HR was re-evaluated 60 minutes after the oral β-blockade, immediately before the coronary CTA examination. Patients presenting with HR >65 bpm on the CT table were randomized to IV esmolol or IV metoprolol administration. In both, the investigational (esmolol) and the active control (metoprolol) groups, the IV drug was administered by the physician performing the coronary CTA scan. To achieve randomization, we administered esmolol on even weeks and metoprolol on odd weeks in an alternating fashion. The IV metoprolol (Betaloc; 1 mg/mL; AstraZeneca, Luton, United Kingdom; 5-mg ampoule) was titrated in 5-mg doses in every 3 minutes until the target HR (≤65 bpm) or the maximum dose of metoprolol (20 mg) was achieved [78].
The esmolol (Esmocard; 2500 mg/10 mL; AOP Orphan Pharmaceuticals AG, Vienna, Austria) was diluted to 500 mg/10 mL and titrated in ascending 100-, 200-, 200-mg doses in every 3 minutes until the target HR (≤65 bpm) or the maximum dose of esmolol (500 mg) was achieved. BP was monitored before every administered drug bolus. If hypotension (defined as systolic BP <100 mm Hg) or bradycardia (defined as HR <50 bpm) was measured, the administration of the β-blocker agent was suspended.
Two puffs of sublingual nitroglycerine were given to each patient 3 to 5 minutes before the CT scan to ensure the proper visualization of the coronaries. The HR was recorded at arrival (T1), immediately before coronary CTA (T2), during breath-hold, contrast injection, and scan (TS), immediately after scan (T3), and 30 minutes after coronary CTA scan (T4). BP was measured at T1, T2, T3, and T4 time points.
We have performed an interim analysis after 45 days to ensure adequate enrollment rate and to assess toxicity as well as adverse events. An adverse event was defined as a change in health condition resulting from the administration of β-blockers, which is not resolving with observation and requires medical intervention.
3.2.2 Coronary CTA scan protocol
CTA examinations were performed using a 256-slice multidetector-row CT (Brilliance iCT, Philips HealthTech, Best, The Netherlands) with the following acquisition parameters: 128 mm×0.625 mm collimation, 270 ms rotation time, 80-120 kV tube voltage, 150-300 mAs tube current depending on the patients’ body mass index (BMI).
Contrast-enhanced images were acquired using prospective ECG triggering at 75% to 81% phase (3% padding). The iodinated contrast agent (Iomeron 400; Bracco Ltd, Milan, Italy) was injected into an antecubital vein via an 18-ga cannula using a dual- syringe technique, at a flow rate of 3.5 to 5.5 mL/s depending on patients’ BMI and the tube voltage. Bolus tracking was performed using a region of interest in the left atrium.
Images were reconstructed with a slice thickness of 0.8 mm and 0.4 mm increment. CT datasets were analysed offline on workstations equipped with dedicated cardiac post- processing software (Intellispace Portal, Philips HealthTech).
3.3 Study design and population for heritability of the aortic root
Our study population consisted of 202 twins (61 monozygotic (MZ), 40 dizygotic (DZ) same-sex pairs), who were enrolled in the BUDAPEST-GLOBAL (Burden of atherosclerotic plaques study in twins - Genetic Loci and the Burden of Atherosclerotic Lesions) clinical study between April 2013 and July 2014, at Heart and Vascular Center, Semmelweis University. Detailed description of the study protocol has been published previously [79]. Briefly, the BUDAPEST-GLOBAL study is a prospective, single-center, classical twin study that sought to evaluate the influence of genetic and environmental factors on the burden of CAD. Participants with self-reported Caucasian ethnic background were enrolled from the Hungarian Twin Registry on a voluntary basis [80]. Two twin pairs were excluded from the CTA analysis due to insufficient image quality (one pair) and withdrawal of study consent (the other pair), while eight twin pairs were excluded from TTE analysis due to the poor quality of the acquired images. No subjects were excluded for the presence of severe valve disease. In total, 198 twin subjects were analysed by CTA and 186 by TTE. Complete physical examination and anthropometric measurements were performed in all participants, which included the recording of waist circumference, height and weight as well as the calculation of the BMI. Brachial blood pressure values were recorded prior to CTA.
Traditional cardiovascular risk factors such as hypertension, diabetes mellitus, dyslipidaemia and smoking habits were collected from patients’ medical history. All participants provided informed consent. The investigation was approved by the National Research Ethics Committee (IRB number 58401/2012/EKU [828/PI/12]; amendment:
12292/2013/EKU) and was conducted according to the principles stated in the Declaration of Helsinki.
3.3.1 CTA scan and drug administration protocol
All CTA examinations were performed using a 256-slice multidetector-row CT (Brilliance iCT, Philips HealthTech, Best, The Netherlands) with the following acquisition parameters: 128 mm×0.625 mm collimation, 270 ms rotation time, 100-120 kV tube voltage, 200-300 mAs tube current depending on the patients’ BMI. Contrast- enhanced images were acquired using prospective ECG triggering at 78% phase (3%
padding). If the initial heart rate of the participants was >65 bpm, oral (maximum dose of 100 mg) or intravenous (maximum dose of 20 mg) metoprolol was administered.
Subjects received 0.8 mg of sublingual nitroglycerin, no more than 2 minutes before image acquisition. Triphasic contrast injection protocol was performed using 80 mL of iodinated contrast agent (Iomeprol 400 g/cm3, Iomeron, Bracco Imaging S.p.A., Milano, Italy), mixture of contrast agent and saline (10 mL contrast agent and 30 mL saline) and a chaser of 40 mL saline, all injected with a flow rate of 4.5-5.5 ml/s into an antecubital vein. Bolus tracking was performed using a region of interest in the left atrium. Images were reconstructed with a slice thickness of 0.8 mm and 0.4 mm increment. CT datasets were analysed offline on workstations equipped with dedicated cardiac post-processing software (Intellispace Portal, Philips HealthTech).
3.3.2 CTA analysis of the aortic root
The following diameters were measured by a single reader (CC, with three years of experience): left ventricular outflow tract (LVOT), annulus, sinus of Valsalva, sinotubular junction and ascending aorta (Figure 12).
Figure 12. CTA-based aortic root measurements [81]
A: coronal CTA image of the left ventricle (LV), right ventricle (RV) and aortic root; B:
3D volume rendered image of the aortic root and the left ventricular cavity. White lines correspond to measured aortic root diameters: 1. left ventricular outflow tract; 2.
annulus; 3. sinus of Valsalva; 4. sinotubular junction; 5. ascending aorta; LM: left main coronary artery; RCA: right coronary artery
By using a semi-automated software tool (Intellispace Portal, Philips HealthTech) modified orientation views similar to those used for TAVI procedures were acquired for the initial evaluation of the aortic root [1]. The axial plane was automatically aligned with the lowest insertion points of the 3 coronary cusps (Figure 13). In case of misalignment manual correction of the insertion points was performed. Based on the annulus-plane diameters of the LVOT, annulus, sinus of Valsalva, sinotubular junction and ascending aorta were obtained by the software. The diameter of a given structure was defined as the mean of the short and long axis [1]. To assess intra-reader reproducibility the same reader performed the previously described measurements in 20 twin pairs.For inter-reader reproducibility, another experienced reader (MK, with five years of experience) also measured the diameters of the aortic root. All measurements were performed blinded to the zygosity of twins.
Figure 13. Axial plane of the annulus on CTA (own material)
Annulus defined by the three lowest insertion points (right coronary cusp, left coronary cusp and non-coronary cusp). An: annulus; LA: left atrium; RA: right atrium; RV: right ventricle; RCA: right coronary artery
Le coronary cusp
Non-coronary cusp
Right coronary cusp
LA RA
RV
An
RCA
3.3.3 TTE imaging of the aortic root
Two-dimensional TTE was performed using iE33 system, S5-1 transducer (Philips Healthcare, Best, The Netherlands). Aortic root measurements were obtained by one experienced operator (AK, with three-years of experience), who was blinded to the zygosity of the twins and the CTA exams. Standard two-dimensional protocol was used according to current guidelines [58]. Parasternal long-axis views were acquired to measure the LVOT and aortic root at the level of the annulus, sinus of Valsalva, sinotubular junction and ascending aorta using the inner edge to inner edge method (Figure 14) [58]. The LVOT and the annulus were measured in zoom mode. Diameters of the LVOT and annulus were assessed on a mid-systolic frame, all other parameters on end-diastolic frame [58]. All recordings included 3 cardiac cycles and were exported to a workstation for off-line analysis (Image-Com, TomTec Imaging Systems, Unterschleissheim, Germany). To assess intra-reader reproducibility the same reader performed the previously described measurements in 20 twin pairs. For inter-reader reproducibility, another experienced reader (AAM, with eight years of experience) also measured the diameters of the aortic root. Inter-modality agreement between CTA and TTE was also calculated.
Figure 14. TTE-based aortic root measurements [81]
A: zoomed parasternal long-axis view at mid-systolic frame of the aortic root; B:
optimized parasternal long-axis view at end-diastolic frame of the aortic root; Inner edge to inner edge method was applied. White lines correspond to measured aortic root diameters: 1. left ventricular outflow tract; 2. annulus; 3. sinus of Valsalva; 4.
sinotubular junction; 5. ascending aorta
3.4 Statistical analyses
Continuous variables were reported as mean ± standard deviation (SD) or median (interquartile range) for non-normally distributed data. Categorical variables are given as frequency (%). Normal distribution was tested using the Shapiro-Wilk tests. Non- parametric data was analyzed using robust t tests using 20%-trimmed means with bootstrapping or when data was very skewed applying a Mann–Whitney-U test.
Differences of categorical variables between treatment groups were analyzed by chi- square tests. Correlations were calculated with Pearson’s correlation test or Spearmans rho test as appropriate. To compare multiple variables one-way ANOVA, followed by Bonferroni post hoc test, or Kruskal–Wallis ANOVA followed by Mann–Whitney-U test was used depending on normality. Within subjects, measurements were compared using repeated measures ANOVA. A P-value of <0.05 was considered significant.
Statistical analyses were performed with R, version 3.0.2 (R Foundation for Statistical Computing, Vienna, Austria).
3.4.1 Sample size calculation for the esmolol vs. metoprolol study
The sample size calculation to determine the efficacy and safety of esmolol was based on prior research, which showed that 83% of patients who received metoprolol premedication achieved a HR of ≤65 bpm [82]. The non-inferiority margin was set to 10% because we have assumed that this is a clinically acceptable maximum difference between the responder proportions of the two treatment groups. Thus, our primary aim to achieve at least 73% responder proportion seemed to be realistic. A total of 595 patients, 297/298 patients on each treatment arm, were needed to find a difference between proportions of responders in metoprolol group vs. esmolol group. The sample size calculation was based on an intention to treat analysis using a non-inferiority margin set at 10% with a power of 90%. Dedicated software was used for sample size calculation (East, version 5.4.1; Cytel Inc, Cambridge, Massachusetts).
3.4.2 Statistical analysis for heritability estimates
Based on CTA and TTE measurements we determined co-twin correlations between MZ and DZ twins. In addition to correlation-based similarities a structural equation model, the ACDE model was used to decompose the total variance between twins. In the ACDE model four latent variables: additive genetic (A), common environmental (C), dominant genetic (D) and unique environmental (E) effects drive the variance of phenotype in each twin. Since C and D factors are confounded only models calculating with C or D, next to A and E can be used. Additive genetic effects (A) are perfectly (1.0) correlated across MZ twins and 0.5 correlated across DZ twins. Common environmental effects (C) are perfectly correlated within twin pairs independently of zygosity. Unique environmental effects (E) are uncorrelated within co-twins (Figure 15). Since measurement error in the phenotype is also uncorrelated across measurements, it appears as part of the unique environmental (E) component.
Figure 15. ACE model (own material)
Additive genetic effects (A) are perfectly (1.0) correlated across MZ twins and 0.5 correlated across DZ twins. Common environmental effects (C) are perfectly correlated within twin pairs independently of zygosity. Unique environmental effects (E) are uncorrelated within twins. Additive genetic effects (A) and common environmental effects (C) increase, while unique environmental effects (E) decrease the similarity between twins. P: phenotype
Statistical analyses were done using the R environment (version: 3.2.1) [83]. Two- sample t-test and chi-square test was used to assess differences between the measured parameters of MZ and DZ twins. Paired t-test was used to evaluate the differences between aortic parameters measured by CTA and TTE. Intra-and inter-reader variability was assessed using the intraclass correlation coefficient (ICC) using IRR package (version: 0.84) [84].
Structural equation modelling was used to decompose sources of variation using univariate ACDE models using the OpenMx package (version: 2.2.4) [85, 86]. Total variation between twins is considered to be a product of additive genetic (A), common environmental (C), dominant genetic (D) and unique environmental (E) effects. All factors cannot be simultaneously estimated since C and D are confounded due to statistical power issues, thus ACE and ADE models were calculated separately.
Potential covariates were selected using all subset regression analysis using the leaps package (version: 2.9) [87]. Based on the results age, sex, height and diastolic blood pressure were included as covariates. Akaike Information Criterion (AIC) and Bayesian Information Criterion (BIC) were used to determine the most parsimonious model among calculated full models. Likelihood ratio test was used to assess the fit of the submodels compared to corresponding full models. In case the fit did not decrease significantly, the more parsimonious submodel was selected. Bootstrapped confidence intervals (CI) of all modelled parameters were calculated using 2000 iterations to achieve robust results.
4. RESULTS
4.1 Optimal systolic phase targets by using absolute delay
To define the optimal systolic phase targets at patients with various HR, we analyzed a total of 1488 coronary artery landmarks (24 of the various landmark data points were deemed non-evaluable or missing), in 21 patients at 6 locations throughout the coronary artery tree, at 12 time-points throughout the systolic phase reconstructions.
Overall, no correlation was found between coronary artery velocities and HR (RCA: r=- 0.08, p=0.75; AM1: r=-0.48, p=0.03; PDA: r=-0.31, p=0.17; LM: r=-0.14; p=0.54;
OM1: r=-0.17, p=0.45; D2: r=-0.16, p=0.48). Table 1 lists the minimal velocities in millimeter/second (mm/s) in each segment for each HR group. No differences were found in the minimal coronary artery velocities between the three HR groups, with the exception of the AM1 branch (p=0.005) between <65 vs. >80 bpm (p=0.03), and at HRs of 65-80 vs. >80 bpm (p=0.006).
Table 1. Minimal velocities across the coronary arteries in mm/s in each HR group [75]
RCA: right coronary artery; AM1: first acute marginal branch; PDA: posterior descending artery; LM: left main coronary artery; OM1: first obtuse marginal branch;
D2: second diagonal branch
<65 65-80 >80 All p
RCA 14.2 12.4 12.6 13.1 0.880
AM1 19.5 21.9 9.4 16.9 0.005
PDA 22.1 15.8 15.0 17.7 0.413
LM 12.9 11.9 11.5 12.1 0.940
OM1 14.0 13.8 11.8 13.2 0.774
D2 14.1 12.6 12.7 13.1 0.884
Table 2 shows the optimal systolic phase reconstruction times of the evaluated coronary artery segments in milliseconds (ms). Significant differences in optimal reconstruction time points were detected only in the RCA (p=0.019) between HR of 65-80 bpm vs.
>80 bpm.
Table 2. Optimal systolic phase reconstruction time in ms in each HR group
RCA: right coronary artery; AM1: first acute marginal branch; PDA: posterior descending artery; LM: left main coronary artery; OM1: first obtuse marginal branch;
D2: second diagonal branch
<65 65-80 >80 All p
RCA 326 357 269 317 0.019
AM1 343 311 334 329 0.451
PDA 326 274 277 292 0.177
LM 300 263 257 273 0.249
OM 311 343 289 314 0.294
D2 277 306 303 295 0.542
Tables 1 and 2 indicate that coronary artery minimal velocities and optimal time-points are independent of HR. However, note that in two segments (AM1 and RCA) significant differences were demonstrated.
A preliminary analysis of ten patients revealed that the mean lowest coronary artery velocities in each segment occurred in the mid period (280-340 ms) of the acquired systolic phase (200-420 ms). Therefore we divided this interval into three time-periods from: 200 to 260 ms (early), 280-340 ms (mid) and 360-420 ms (late), to evaluate potential differences. The analysis of all 21 patients’ mean velocities in each of the three time periods confirmed this observation. In the mid period, (280-340 ms) in each coronary segment, the mean velocity values were significantly lower versus the early and/or late phases of the selected time interval (Table 3, Figure 16). In the LM, OM1 and D2, a significant difference was also found between the early and late time periods.
Table 3. Differences between the systolic phase targets
RCA: right coronary artery; AM1: first acute marginal branch; PDA: posterior descending artery; LM: left main coronary artery; OM1: first obtuse marginal branch;
D2: second diagonal branch Coronary artery
segment
Time interval (ms)
Mean velocity
(mm/s) p-value
p between time intervals
RCA early (200 - 260) 48.4
mid (280 - 340) 44.6 mid vs. late
p=0.005 late (360 - 420) 58.9
p=0.005
AM1 early (200 - 260) 75.0 mid vs. early
p=0.004 mid (280 - 340) 54.0
late (360 - 420) 66.4
p=0.005
PDA early (200 - 260) 79.2 mid vs. early
p=0.016 mid (280 - 340) 51.5
late (360 - 420) 95.6 mid vs. late
p<0.001 p<0.001
LM early (200 - 260) 41.4 early vs. late
p=0.003
mid (280 - 340) 41.1 mid vs. late
p<0.002 late (360 - 420) 53.8
p<0.001
OM1 early (200 - 260) 48.4 early vs. late
p=0.002
mid (280 - 340) 42.9 mid vs. late
p<0.001 late (360 - 420) 70.2
p<0.001
D2 early (200 - 260) 42.0 early vs. late
p=0.007
mid (280 - 340) 42.6 mid vs. late
p=0.010 late (360 - 420) 56.0
p=0.003
Figure 16. Mean coronary artery velocities in each of the three time periods [75]
The lowest coronary velocity was detected in the mid period (280-340 ms) of the reconstructed interval (200-420 ms). The mean velocities in this period were significantly lower than in the early and/or late periods.
4.2 Efficacy and safety of esmolol vs. metoprolol
Patient enrollment was terminated as early as the interim analysis indicated that IV esmolol is clearly non-inferior to IV metoprolol, and in fact, esmolol showed superior characteristics compared to IV metoprolol in reducing HR during coronary CTA.
There was no difference between the esmolol and metoprolol group regarding the clinical characteristics of patients (Table 4).
Table 4. Demographic characteristics of the study groups [77]
AMI: acute myocardial infarction; BMI: body mass index; CABG: coronary artery bypass graft; PAD: peripheral arterial disease; PCI: percutaneous coronary intervention;
mean values SD
esmolol
(n=204) metoprolol
(n=208) p
age (years) 56.9 10.8 57.6 12.2 0.390
male/female 100/104 111/97 0.377
BMI (kg/m2) 28.4 4.9 28.2 4.7 0.956
hypertension (%) 67 66 0.889
diabetes (%) 16 14 0.603
dyslipidemia (%) 48 55 0.154
AMI (%) 5 10 0.076
PCI (%) 5 7 0.455
CABG (%) 4 6 0.287
PAD (%) 9 8 0.801
stroke (%) 4 1 0.072
smoking (%) 25 26 0.845
β -blocker (%) 47 48 0.795
In the esmolol group, 53 of 204 patients (26.0%) received 1 bolus (100 mg), 73 of 204 (35.8%) received 2 boluses (300 mg), and 78 of 204 (38.2%) received 3 boluses (500 mg) of esmolol. In the metoprolol group, IV metoprolol was administered in a similar fashion as in the esmolol group but in 5-mg increments. Eighty-three of 208 patients (39.9%) received 1 bolus (5 mg), 45 of 208 patients (21.6%) 2 boluses (10 mg), 53 of 208 (25.5%) 3 boluses (15 mg), and 27 of 208 (13.0%) 4 boluses (20 mg) of metoprolol. Oral metoprolol administration was similar in the esmolol and metoprolol groups (51.2 ± 33.1 vs. 52.4 ± 33.6; p=0.71). On average, 325.6 ± 158.4 mg IV esmolol and 10.7 ± 6.3 mg IV metoprolol were administered. The mean HR of the esmolol and metoprolol groups was similar at the time of arrival (T1: 78 ± 13 vs. 77 ± 12 bpm; p=0.65) and immediately before the coronary CTA examination (T2: 68 ± 7 vs. 69
± 7 bpm; p=0.60). However, HR during the scan was significantly lower among the patients who received IV esmolol vs. patients who received IV metoprolol (TS: 58 ± 6 vs. 61 ± 7 bpm; p<0.0001). On the other hand, HR immediately after the coronary CTA and 30 minutes after the coronary CTA was higher in the esmolol group than in the metoprolol group (T3: 68 ± 7 vs. 66 ± 7 bpm; p<0.01; and T4: 65 ± 8 vs. 63 ± 8 bpm; p<0.0001, respectively; Table 5, Figure 17). Systolic and diastolic BP showed no difference between the 2 groups measured at any time point (Table 6).
Table 5. Mean HR in the esmolol and metoprolol group
T1: arrival; T2: before scan; TS: during scan; T3: after scan; T4: emission; mean values SD
esmolol
(n=204) metoprolol
(n=208) p
T1 78 13 77 12 0.652
T2 68 7 69 7 0.599
TS 58 6 61 7 <0.0001
T3 68 7 66 7 <0.01
T4 65 8 63 8 <0.0001
![Figure 1. Coronary artery segmentation diagram by the Society of Cardiovascular Computed Tomography (SCCT) [12]](https://thumb-eu.123doks.com/thumbv2/9dokorg/1369214.112073/10.892.153.762.139.543/figure-coronary-segmentation-diagram-society-cardiovascular-computed-tomography.webp)
![Figure 3. Aortic root with aortic valve on the inside [56]](https://thumb-eu.123doks.com/thumbv2/9dokorg/1369214.112073/16.892.137.780.478.836/figure-aortic-root-aortic-valve-inside.webp)
![Figure 4. Aortic root with the virtual ring of the annulus [57]](https://thumb-eu.123doks.com/thumbv2/9dokorg/1369214.112073/17.892.294.588.198.458/figure-aortic-root-virtual-ring-annulus.webp)
![Figure 8. Raw dataset reconstructions in 20 ms increments after the R peak [75]](https://thumb-eu.123doks.com/thumbv2/9dokorg/1369214.112073/23.892.138.750.413.914/figure-raw-dataset-reconstructions-ms-increments-r-peak.webp)
![Figure 9. Defining the end systolic phase and the end of isovolumic relaxation on three- three-chamber cine view [75]](https://thumb-eu.123doks.com/thumbv2/9dokorg/1369214.112073/25.892.134.777.426.810/figure-defining-systolic-phase-isovolumic-relaxation-chamber-cine.webp)
![Figure 11. Flow chart of the study [77]](https://thumb-eu.123doks.com/thumbv2/9dokorg/1369214.112073/27.892.210.695.707.1019/figure-flow-chart-study.webp)
![Figure 12. CTA-based aortic root measurements [81]](https://thumb-eu.123doks.com/thumbv2/9dokorg/1369214.112073/32.892.126.766.267.641/figure-cta-based-aortic-root-measurements.webp)
