SEMMELWEIS EGYETEM DOKTORI ISKOLA
Ph.D. értekezések
2408.
CZIMBALMOS CSILLA
Szív- és érrendszeri betegségek élettana és klinikuma
című program
Programvezető: Dr. Merkely Béla, egyetemi tanár Témavezető: Dr. Merkely Béla, egyetemi tanár és
Dr. Vágó Hajnalka, egyetemi docens
ASSESSMENT OF PHYSIOLOGICAL AND PATHOLOGICAL REMODELLING
IN ATHLETE’S HEART AND CARDIOMYOPATHIES USING CARDIAC MAGNETIC RESONANCE IMAGING
Doctoral Dissertation
Csilla Czimbalmos MD
Doctoral School of Basic and Translational Medicine Semmelweis University
Supervisors: Hajnalka Vágó MD, PhD Béla Merkely MD, DSc Official reviewers:
Gergely Ágoston MD, PhD Gergely Szabó MD, PhD Head of the Final Examination Committee:
Zoltán Benyó MD, DSc
Members of the Final Examination Committee:
András Zsáry MD, PhD Réka Faludi MD, PhD
Budapest
2020
1
Table of contents
Table of contents 1
Abbreviations 5
1. Introduction 8
1.1. Cardiac remodelling 8
1.2. Physiological remodelling in athletes 9
1.3. Pathological remodelling in cardiomyopathies 12
1.3.1. Hypertrophic cardiomyopathy 12
1.3.2. Arrhythmogenic right ventricular cardiomyopathy 15
1.3.3. Dilated cardiomyopathy 19
1.4. Reverse remodelling 21
1.4.1. Reverse remodelling in athletes – cardiac deconditioning 21 1.4.2. Reverse remodelling due to pharmacological and non-
pharmacological therapy
23
1.5. Cardiac magnetic resonance imaging and its role in the assessment of cardiac remodelling
25
1.6. Electroanatomic mapping and its role in the assessment of cardiac remodelling
29
2. Study aims 31
2.1. Differentiation of pathological and physiological remodelling 31 2.2. Electroanatomical and tissue characterization 31
2.3. Reverse remodelling assessment 31
3. Methods 32
3.1. Study design and study populations 32
3.1.1. Study design and study population of the Differentiation of pathological and physiological remodelling project
32
2
3.1.2. Study design and study population of Electroanatomic and tissue characterization project
33
3.1.3. Study design and study population of Reverse remodelling project 33
3.2. Image acquisition and analysis 34
3.2.1. Differentiation of pathological and physiological remodelling project
34
3.2.2. Electroanatomic and tissue characterization project 37
3.2.3. Reverse remodelling project 39
3.3. Statistical analysis 41
3.3.1. Statistical analyses (Differentiation of pathological and physiological remodelling project)
41
3.3.2. Statistical analyses (Electroanatomic and tissue characterization project)
42
3.3.3. Statistical analyses (Reverse remodelling project) 42
4. Results 43
4.1. Results of the Differentiation of pathological and physiological remodelling project
43
4.1.1. HCM and athlete’s heart 43
4.1.1.1. Baseline characteristics 43
4.1.1.2. Comparison of left ventricular CMR parameters in healthy athletes and HCM patients evaluated using threshold-based and conventional quantification method
46
4.1.1.3. Diagnostic accuracy of sport indices to differentiate HCM and athlete’s heart
48
4.1.2. ARVC and athlete’s heart 52
4.1.2.1. Baseline characteristics 52
4.1.2.2. Comparison of CMR parameters between healthy athletes and ARVC patients
53
4.1.2.3. Diagnostic accuracy of CMR parameters and feature tracking 55
3
based deformation imaging to differentiate ARVC and athlete’s heart
4.2. Results of the Electroanatomic and tissue characterization project 58
4.2.1. Baseline characteristics 58
4.2.2. Characteristics and distribution of the late gadolinium enhancement and electroanatomical substrate
60
4.2.3. Agreement between late gadolinium enhancement and electroanatomical maps
60
4.2.4. Electroanatomical map adjustment based on the late gadolinium enhancement
61
4.2.5. Ablation outcomes and predictors for success 61 4.3. Results of the Reverse remodelling project 63
4.3.1. Baseline characteristics 63
4.3.2. Safety and image quality 63
4.3.3. Reverse remodelling (Baseline vs BIV pacing) 65 4.3.4. Switching off the biventricular pacing (BIV vs AOO pacing) 67
5. Discussion 69
5.1. Physiological adaptation mimicking pathological remodelling – the role of CMR in the differential diagnosis
69 5.1.1. Overlapping features and differences between physiological and
pathological remodelling
69
5.1.2. Gender-specific differences 71
5.1.3. Role of novel CMR techniques in the differential diagnosis 73 5.2. Electroanatomic and tissue characterization in patients with
DCM
76 5.2.1. Tissue characterization in patients with DCM using CMR 76 5.2.2. Electroanatomic characterization in patients with DCM 77 5.2.3. The role of CMR imaging in patients with ventricular arrhythmias 78 5.3. The role of CMR in the detailed assessment of reverse
remodelling after CRT implantation
81
4
5.3.1. Assessment of the reverse remodelling using CMR 81 5.3.2. The current role and future perspectives of CMR in CRT therapy 83
5.4. Limitations 84
6. Conclusions 85
7. Summary 87
8. Összefoglaló – Summary in Hungarian 88
9. References 89
10. Acknowledgement 109
5
Abbreviations ACEI
AHA ARB ARVC
angiotensin-converting-enzyme inhibitor American Heart Association
angiotensin receptor blockers
arrhythmogenic right ventricular cardiomyopathy AUC
AOO
area under curve
asynchronous atrial pacing BPM
BSA
beats per minute body surface area bSSFP
CMR CQ CRT CRT-D CRT-P
balanced steady-state free precession cardiac magnetic resonance
conventional quantification method cardiac resynchronization therapy
cardiac resynchronization therapy defibrillator cardiac resynchronization therapy pacemaker DCM
DOO
dilated cardiomyopathy
dual chambered asynchronous pacing EAM
ECG
electroanatomic mapping
electrocardiogram (also electrocardiography, electrocardiographic) EDWT
EF ESC FWHM
maximal end-diastolic wall thickness ejection fraction
European Society of Cardiology full-width half maximum GCS
GLS GRS HCM
global circumferential strain global longitudinal strain global radial strain
hypertrophic cardiomyopathy
HR heart rate
6 ICD
IVS
implantable cardioverter defibrillator intraventricular septum
LV LVA
left ventricle low voltage areas LBBB left bundle branch block LGE
LVEDD LVEDV LVEDVi LVEF LVESV LVESVi LVH LVM LVMi LVNC LVOT
late gadolinium enhancement
left ventricular end-diastolic diameter left ventricular end-diastolic volume
left ventricular end-diastolic volume index (standardized to BSA) left ventricular ejection fraction
left ventricular end-systolic volume
left ventricular end-systolic volume index (standardized to BSA) left ventricular hypertrophy
left ventricular mass
left ventricular mass index (standardized to BSA) left ventricular noncompaction
left ventricular outflow tract LVSV
LVSVi NPV nsVT
left ventricular stroke volume
left ventricular stroke volume index (standardized to BSA) negative predictive value
non-sustained ventricular tachycardia PAV
PPV
paced atrioventricular delay positive predictive value PLAX
PSAX PW ROC RFCA
parasternal long-axis view parasternal short-axis view posterior wall
receiver operating characteristic radiofrequency catheter ablation
7 RV
RVEDV RVEDVi RVEF RVOT RVESV RVESVi RVM RVMi RVSV RVSVi
right ventricular
right ventricular end-diastolic volume
right ventricular end-diastolic volume index (standardized to BSA) right ventricular ejection fraction
right ventricular outflow tract
right ventricular end-systolic volume
right ventricular end-systolic volume index (standardized to BSA) right ventricular mass
right ventricular mass index (standardized to BSA) right ventricular stroke volume
right ventricular stroke volume index (standardized to BSA) SAR
SCD
specific absorbtion rate sudden cardiac death SD standard deviation SGE
TFC TPM TPMi TPM%
TQ TTP TWI VF VPB VT 2D 3D
spoiled gradient echo Task Force Criteria
trabeculae and papillary muscles
trabeculae and papillary muscles index (standardized to BSA) trabeculae and papillary muscles as the
percentage of total LV myocardial mass threshold-based quantification method time to peak
T-wave inversion ventricular fibrillation ventricular premature beats ventricular tachycardia two-dimensional three-dimensional
8 2-CH
3-CH 4-CH
two-chamber view three-chamber view four-chamber view
9
1. Introduction
1.1 Cardiac remodelling
The life saving capacity of appropriate diagnostic imaging in cardiovascular diseases has inspired intensive research into cardiac remodelling. While cardiac remodelling has been well characterized using our traditional diagnostic tools, suprisingly little attention has been given to assessing these conditions with cardiac magnetic resonance (CMR) imaging. Hereby our task is to characterize systematically cardiac remodelling in an effort to create the bedrock to receive our contextualized results.
Cardiac remodelling is a compensatory process caused by mechanical, neurohormonal and genetic factors leading to functional and structural changes of the heart (1, 2). The term cardiac remodelling was first used to describe maladaptive changes after myocardial infarction including scar formation, left ventricular dilation and geometrical changes with increasing spherical geometry (3). Similar changes in left and also right ventricular geometry may be present in cardiomyopathies. Moreover, certain geometrical and structural alterations observed in pathological cardiac remodelling may be also caused by physiological factors such as intensive and regular exercise (4).
In case of pathological remodelling many molecular and cellular mechanisms are contributing to ventricular remodelling including increased oxidative stress, inflammation, vascular changes, myocyte loss and hypertrophy, fibrosis and alterations in ion transport processes leading to electrophysiological changes (Figure 1) (5).
10
Figure 1: Potential pathological stimuli contributing to cardiac remodelling (5).
Although cardiac remodelling represents a compensatory process, if persist, may lead to continuous progressive changes affecting cardiomyocytes, smooth muscle cells, endothelium and interstitial matrix. Left ventricular parameters representing cardiac remodelling (left ventricular end-diastolic, end-systolic volume, ejection fraction) are closely related to cardiovascular outcomes, and are feasible endpoints to evaluate the efficacy of pharmacological and non-pharmacological therapeutic options (6).
1.2 Physiological remodelling in athletes
The term remodelling originally reflected a maladaptation to an underlying pathology.
As pathological volume and pressure overload leads to dilation and hypertrophy of the left ventricle, haemodynamic changes observed in highly trained athletes may lead to similar changes including both enlarged ventricles and increased wall thickness.
Physiological cardiac remodelling as a response to regular and intensive physical training, is a well-known phenomenon. Physiological cardiac remodelling in athletes
11
was described first in the 19th century by a physician using auscultation and percussion (7, 8). Modern imaging technologies enable a more detailed structural and functional characterization of the athlete’s heart (Figure 2).
Physical training can be divided into two main categories based on its metabolic characteristics. According to Morganroth’s work on the differentiation between endurance and power athletes, dynamic or endurance training causes volume overload, while static or strength training leads to pressure overload resulting in chamber dilation and hypertrophy, respectively (9-11). As the majority of sports contain various degree of endurance and power training, more detailed classifications were established based on the static and dynamic components of sports (12). Literature data imply that many other factors may influence the degree and nature of the cardiac adaptation including gender, training intensity and duration, age, ethnicity and currently unknown factors (4, 13-18). Therefore to establish the physiological upper limit of cardiac adaptation in an athlete may often cause difficulties in the clinical routine. The importance of this question arises from the fact that false positive diagnosis of cardiomyopathies may lead to unnecessary interruption of a professional’s sports career. On the other hand, unrecognized pathologies may cause sudden unexpected cardiac death in young competitive athletes. The annual incidence rate of sudden cardiac death (SCD) in athletes is about 0.7-3.0 per 100 000 young athletes under 35 years (19-24). The incidence of sudden cardiac death in athletes is higher than in non-athletes. Competitive sports activity enhances the risk of SCD by 2- to 3-fold, and a clear male predominance was observed with a 2.3-10-fold risk compared to women (19, 20). Beside male gender, older age and Afro‐Caribbean origin are all associated with an increased SCD risk (23- 28). The aetiology of SCD in young athletes varies in different studies depending mainly on geographical and ethnical differences. Based on North American data the leading cause of SCD is hypertrophic cardiomyopathy (HCM) (22, 25), while European data suggests a higher prevalence of arrhythmogenic right ventricular cardiomyopathy (ARVC), especially in the Veneto region of Italy (29). The limited existing data regarding the aetiology of SCD in Hungarian athletes suggest, that although the most common cardiomyopathy in this population is HCM, in athletes with aborted sudden cardiac death the underlying cause is most commonly ARVC highlighting the extremely arrhythmogenic nature of the disease (30).
12
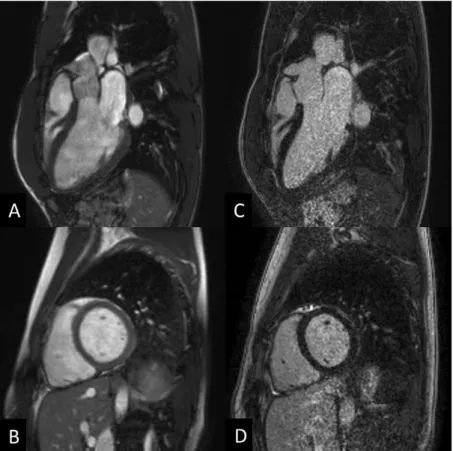
Figure 2: Cardiac magnetic resonance images of an athlete: cine balanced steady-state free precession (bSSFP) images (A,B) and late gadolinium enhancement images (C, D) in long- and short-axis views. Heart and Vascular Center, Semmelweis University.
As cardiomyopathies – mostly HCM and ARVC – represent a significant proportion of SCD cases in young athletes, attention has been focused on differentiation of these conditions from physiological cardiac remodelling. Diagnostic dilemmas may arise mainly in highly trained athletes where cardiac adaptation may reach a level, which can mimic cardiomyopathies (Figure 3). Structural and functional alterations including ventricular dilation, slightly decreased ejection function, and electrical alterations (such as potentially abnormal electrocardiogram (ECG) findings and variety of arrhythmias) can be a part of the healthy, highly trained athlete’s heart spectrum (31).
13
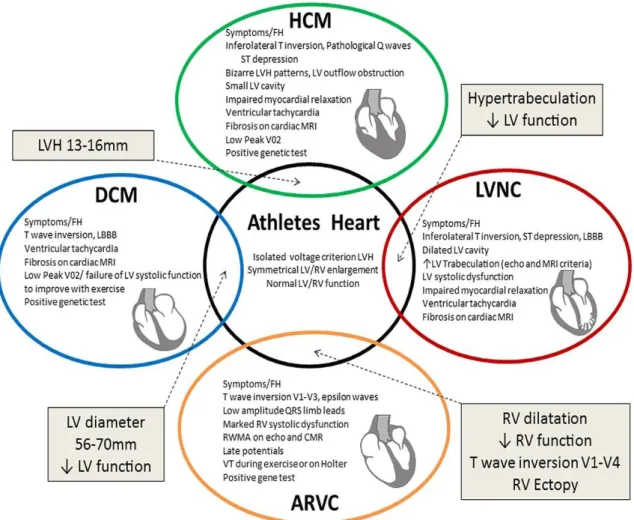
Figure 3: The Grey zone of overlap between physiological and pathological remodelling causing diagnostic dilemmas (32). ARVC, arrhythmogenic right ventricular cardiomyopathy; DCM, dilated cardiomyopathy; HCM, hypertrophic cardiomyopathy;
LBBB, left bundle branch block; LV, left ventricular; LVH, left ventricular hypertrophy; LVNC, left ventricular noncompaction; MRI, magnetic resonance imaging; RV, right ventricular.
1.3 Pathological remodelling in cardiomyopathies 1.3.1 Hypertrophic cardiomyopathy
Hypertrophic cardiomyopathy is a genetic disorder manifesting in left ventricular hypertrophy in the absence of secondary causes with an estimated prevalence of 0.16- 0.29% (33-37). The hypertrophy is frequently asymmetrical. It predominantly involves the basal interventricular septum, but midventricular, apical, inferolateral, right ventricular involvement and concentric forms may occur. HCM is a single gene disorder
14
with an autosomal dominant pattern of inheritance caused by mutations in genes encoding sarcomere-associated proteins. Autosomal recessive and X-linked mutations are extremely rare and should raise the suspicion of HCM phenocopies (38, 39).
Histological features include myocyte hypertrophy, myocyte disarray and interstitial fibrosis. According to the current guideline of the European Society of Cardiology (ESC) the diagnostic criterion of HCM in adults is a maximal end-diastolic wall thickness ≥15 mm in one or more left ventricular myocardial segments that is not explained solely by loading conditions (40). Other conditions such as aortic stenosis, arterial hypertension, athlete’s heart and different phenocopies including amyloidosis, Anderson-Fabry, Pompe disease, Danon disease or endomyocardial fibrosis may mimic HCM and can cause diagnostic difficulties (Figure 4).
Patients may stay asymptomatic for decades despite the presence of severe hypertrophy.
The most frequent symptoms are heart failure with preserved ejection fraction, chest pain, palpitations, presyncope, syncope and sudden cardiac death. The symptoms develop mainly due to diastolic dysfunction, left ventricular outflow tract (LVOT) obstruction, imbalance between myocardial oxygen supply and demand and arrhythmias related to cardiac remodelling with myocardial hypertrophy, myocyte disarray and fibrosis (41).
The estimated annual SCD risk is approximately 0.5-2%. Patients after aborted sudden cardiac arrest caused by ventricular fibrillation (VF) or sustained ventricular tachycardia (VT), implantation of an implantable cardioverter defibrillator (ICD) as secondary prevention is strongly indicated (40, 42). ICD implantation for primary prevention is recommended in patients with at least one risk factor including unexplained syncope, an abnormal blood pressure response to exercise (hypotension), massive (≥30 mm) thickening of the interventricular septum or ventricular wall, a positive family history of HCM and SCD, multiple episodes of documented nonsustained VT using an extended (30-day) period of cardiac rhythm monitoring, and extensive (≥15% of left ventricular mass) late gadolinium enhancement (LGE) determined by CMR imaging. To simplify risk assessment, the European Society of Cardiology established the HCM Risk Calculator (40), baseline and periodic re-evaluation is recommended because of the progressive nature of the disease. Besides SCD prevention, therapeutic options represent symptomatic treatment including pharmacological or interventional therapy; current therapies do not target the underlying genetic defect (41).
15
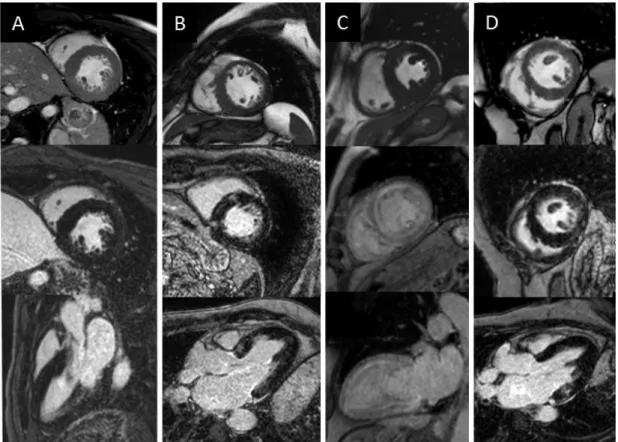
Figure 4: Cine bSSFP and late gadolinium enhancement images of HCM and HCM phenocopies: aortic stenosis (A), HCM (B), amyloidosis (C), Anderson-Fabry disease (D). Heart and Vascular Center, Semmelweis University.
HCM patients participating in competitive sport are representing a high risk population (42, 43). Present guidelines recommend the disqualification of HCM patients from any competitive sports regardless of the presence or absence of major risk factors (44, 45).
Pelliccia and his colleagues recently published a paper about athletes with HCM. In this small, mainly low risk HCM population, although cardiac symptoms and cardiac arrest occurred, the incidence of symptoms and events were not different between patients, who were dismissed and who continued their exercise programs (46). These controversial data suggest that only additional larger scaled studies with massive population of athletes diagnosed with HCM could accurately evaluate the characteristics of this unique population, and clarify the role of regular exercise in disease progression and clinical outcomes.
Diagnosing HCM in athletes is challenging in the everyday clinical routine. The overlap between mild HCM phenotypes and pronounced left ventricular hypertrophy of an athlete offered a challenge in the process of identifying the accurate diagnosis in the
16
grey zone of hypertrophy many years ago. The algorithm aiming to resolve this problem is presented in Figure 5 (47). Although it may be helpful in some cases in athletes with possible HCM, however, some of the patterns (e.g. LV cavity, atrial enlargement) may not be useful. Recent literature implies that the clinical characteristics of athletes with HCM significantly differ from sedentary HCM patients (48), therefore it is crucial to establish new parameters and cut-off values which could help to diagnose athletes with HCM.
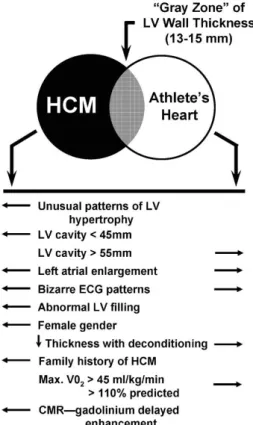
Figure 5: Criteria to distinguish HCM and athlete’s heart in patients in the grey zone of hypertrophy. (47) CMR, cardiac magnetic resonance; ECG, electrocardiogram; HCM, hypertrophic cardiomyopathy; LV, left ventricular.
1.3.2 Arrhythmogenic right ventricular cardiomyopathy
Arrhythmogenic right ventricular cardiomyopathy is a genetic disorder resulting in fibrofatty infiltration of the myocardium (49). Although most commonly it affects the right ventricle, based on literature data the left ventricle is involved in more than 50% of the cases (50-52). The estimated prevalence of the disease (0.02-0.05%) displays relevant geographic differences (49). The diagnosis is based on the current Task Force
17
criteria (TFC) including global or regional right ventricular dysfunction, structural changes, tissue characterization, repolarization and depolarization abnormalities, arrhythmias and family history (Table 1) (53).
Table 1: Revised Task Force Criteria for the diagnosis of ARVC, adapted from Marcus et al. (53) The diagnosis is fulfilled by the presence of 2 major, or 1 major plus 2 minor criteria or 4 minor criteria from different groups. Diagnostic terminology for revised criteria: definite diagnosis: 2 major or 1 major and 2 minor criteria or 4 minor from different categories; borderline: 1 major and 1 minor or 3 minor criteria from different categories; possible: 1 major or 2 minor criteria from different categories. PLAX, parasternal long-axis view; RVOT, right ventricular outflow tract; BSA, body surface area; PSAX, parasternal short-axis view; aVF, augmented voltage unipolar left foot lead; and aVL, augmented voltage unipolar left arm lead, SAECG, signal-averaged electrocardiogram.
Category Major criteria Minor criteria
I. Global or regional dysfunction and structural alterations
By 2D echo:
● Regional RV akinesia, dyskinesia, or aneurysm
● and 1 of the following (end diastole):
— PLAX RVOT ≥32 mm (corrected for body
size [PLAX/BSA] ≥19 mm/m2)
— PSAX RVOT ≥36 mm (corrected for body size [PSAX/BSA] ≥21 mm/m2)
— or fractional area change
≤33%
By MRI:
● Regional RV akinesia or dyskinesia or
dyssynchronous RV contraction
● and 1 of the following:
— Ratio of RV end-diastolic volume to BSA ≥110 mL/m2 (male) or ≥100 mL/m2 (female)
— or RV ejection fraction ≤40%
By RV angiography:
● Regional RV akinesia, dyskinesia, or aneurysm
By 2D echo:
● Regional RV akinesia or dyskinesia
● and 1 of the following (end diastole):
— PLAX RVOT ≥29 to <32 mm (corrected for body size
[PLAX/BSA] ≥16 to <19 mm/m2)
— PSAX RVOT ≥32 to <36 mm (corrected for body size
[PSAX/BSA] ≥18 to <21 mm/m2)
— or fractional area change >33%
to ≤40%
By MRI:
● Regional RV akinesia or dyskinesia or dyssynchronous RV contraction
● and 1 of the following:
— Ratio of RV end-diastolic volume to BSA ≥100 to <110 mL/m2 (male) or ≥90 to <100 mL/m2 (female)
— or RV ejection fraction >40% to
≤45%
18 II. Tissue characterization
of wall
● Residual myocytes <60% by morphometric analysis (or <50%
if estimated), with fibrous replacement of the RV free wall myocardium in ≥1 sample, with or without fatty replacement of tissue on endomyocardial biopsy
● Residual myocytes 60% to 75%
by morphometric analysis (or 50%
to 65% if estimated), with fibrous replacement of the RV free wall myocardium in ≥1 sample, with or without fatty replacement of tissue on endomyocardial biopsy III. Repolarization
abnormalities
● Inverted T waves in right precordial leads (V1, V2, and V3) or beyond in individuals >14 years
of age (in the absence of complete right bundle-branch block QRS ≥120 ms)
● Inverted T waves in leads V1 and V2 in individuals >14 years of age (in the absence of complete right bundle-branch block) or in V4, V5, or V6
● Inverted T waves in leads V1, V2, V3, and V4 in individuals >14 years of age in the presence of complete right bundle-branch block
IV.
Depolarization/conduction abnormalities
● Epsilon wave (reproducible low-amplitude signals between end of QRS complex to onset of the T wave) in the right
precordial leads (V1 to V3)
● Late potentials by SAECG in ≥1 of 3 parameters in the absence of a QRS duration of ≥110 ms on the standard ECG
● Filtered QRS duration (fQRS)
≥114 ms
● Duration of terminal QRS <40 μV (low amplitude signal duration)
≥38 ms
● Root-mean-square voltage of terminal 40 ms ≥20 μV
● Terminal activation duration of QRS ≥55 ms measured from the nadir of the S wave to the end of the QRS, including R’, in V1, V2, or V3, in the absence of complete right bundle-branch block V. Arrhythmias ● Nonsustained or sustained
ventricular tachycardia of left bundle-branch morphology with superior axis (negative or indeterminate QRS in leads II, III, and aVF and positive in lead aVL)
● Nonsustained or sustained ventricular tachycardia of RV outflow configuration, left bundle- branch block morphology with inferior axis (positive QRS in leads II, III, and aVF and negative in lead aVL) or of unknown axis
● >500 ventricular extrasystoles per 24 hours (Holter)
VI. Family history ● ARVC confirmed in a first- degree relative who meets current Task Force criteria
● ARVC confirmed pathologically at autopsy or surgery in a first-degree relative
● Identification of a pathogenic mutation categorized as
associated or probably associated with ARVC in the patient under evaluation
● History of ARVC in a first- degree relative in whom it is not possible or practical to determine whether the family member meets current Task Force criteria
● Premature sudden death (<35 years of age) due to suspected ARVC in a first-degree relative
● ARVC confirmed pathologically or by current Task Force Criteria in second-degree
relative
19
As a progressive disease, ARVC is categorized into different phases: the early concealed phase, overt or electrical phase, and phase of right ventricular (RV) and biventricular failure. As one of the most arrhythmogenic cardiomyopathies, it often manifests as ventricular tachycardia or ventricular fibrillation. Heart failure may occur mainly in the advanced stage of the disease. Morphological and ECG changes may lack in early phase making the diagnosis even more difficult. Moreover, certain pathologies can mimic ARVC such as idiopathic right ventricular outflow tract (RVOT) tachycardia, sarcoidosis, myocarditis or even physiological cardiac remodelling called athlete’s heart.
As approximately 50% of the patients with ICD experience appropriate therapy (54, 55), the extremely arrhythmogenic nature of the disease is not questionable. Numerous risk factors have been proposed for stratifying SCD risk and indication for ICD implantation as risk stratification represents a crucial point in the management of ARVC. The international Task Force consensus statement distinguishes between the following categoriws: high risk patients with aborted SCD due to VF, sustained VT, severe ventricular dysfunction (>10% annual mortality rate), intermediate risk patients with at least one major risk factor including syncope, nonsustained ventricular tachycardia (nsVT), moderate ventricular dysfunction, or at least one minor risk factor including mild ventricular dysfunction, heart, failure, young age, male gender, complex genotype, proband status, inducible VT/VF, extent of electroanatomic scar, or fragmented electrocardiograms on right ventricular (RV) endocardial voltage mapping (1-10%
annual mortality rate) and low risk patients without risk factors (<1% annual mortality rate) (56). Antiarrhythmic drug therapy including sotalol, beta blockers and amiodarone are frequently used in ARVC patients to reduce VT burden, although the efficacy is still debated because of the controversies introduced in medical literature (57-59).
In ARVC patients, intensive training is associated with higher risk of life-threatening arrhythmias and heart failure (60-63). Competitive sport activity was associated with a 5-fold SCD risk in young adults with ARVC (19). Therefore, athletes with definite diagnosis of ARVC should not participate in competitive sports with the exception of low-intensity class 1A sports (45). As recent literature data imply, recreational sport activity shows no association with earlier onset of symptoms or increased risk of life- threatening arrhythmias. Restriction in patients performing only recreational sport activity has not been established as of yet (64, 65).
20
Although researchers initially mainly focused on the left ventricle in the athletic cardiac adaptation, in the last decade healthcare professionals have turned their attention to understand the structural and functional changes in the right ventricle as well (66-69).
La Gerche and his colleagues found a lower rate of desmosomal gene mutations in athletes with RV arrhythmias compared to non-athletes. They hypothesized that regular intensive exercise alone may lead to proarrhythmogenic RV remodelling identifyied as
“exercise-induced ARVC” (70).
Early diagnosis of ARVC is a difficult clinical scenario in highly trained athletes.
Dilated right and left ventricles and decreased ejection fraction may be a consequence of regular high intensity training, and precordial T-wave inversions in both leads v1 and v2 are present in more than half of the athletes (Figure 6) (71). Therefore, further diagnostic criteria are warranted to be discovered to solve this critical clinical dilemma.
Figure 6: CMR images and 12-lead ECG of a highly trained athlete (A, B) and an ARVC patient (C,D) representing the overlapping features such as right ventricular dilation and T-wave inversions in the precordial leads. Heart and Vascular Center, Semmelweis University.
21
1.3.3 Dilated cardiomyopathy
Dilated cardiomyopathy (DCM) is a condition characterized by left ventricular or biventricular dilation and impaired systolic function, where pressure overload or coronary artery disease alone does not explain the myocardial dysfunction (72, 73). The estimated prevalence is 0.04-0.4% showing significant race-related and geographical differences (74, 75). Approximately 30-40% of the cases are genetic, affecting genes encoding cytoskeletal, sarcomere and nuclear envelope proteins. Non-genetic causes include alcohol abuse, toxins, drugs, inflammation, tachyarrhythmias, metabolic or endocrine disturbances. Symptoms most commonly are related to heart failure, arrhythmias and thromboembolic events (76).
The clinical diagnosis of DCM relies on non-invasive imaging. It has been defined by the presence of reduced systolic function (fractional shortening <25% or left ventricular ejection fraction (LVEF) <45%) and left ventricular dilation (LVEDD >117% of the predicted value corrected for age and body surface area) after excluding any known causes of myocardial dysfunction (77). Advanced imaging modalities may play a role in the early detection of the disease by more precise function and volume assessment, the detection of strain abnormalities or the presence of LGE (78).
The management mainly focuses on the change in LV size and function, arrhythmias and congestive symptoms. Main cornerstones of the pharmacological therapy of heart failure with reduced ejection fractions are angiotensin-converting enzyme inhibitors, β- blockers, aldosterone antagonists, angiotensin receptor-neprilysin inhibitor and ivabradine in patient with sinus rhythm above 70/min. Symptomatic patients besides optimal medical therapy with wide QRS and left bundle branch block (LBBB) morphology may benefit from cardiac resynchronization therapy (CRT) (79). ICD for primary prevention is indicated in patients with reduced ejection fraction (EF <35%) despite optimal medical treatment (80). However, literature implies that arrhythmia burden is unrelated to LV dysfunction (81) and a subset of patient may present ventricular arrhythmia in the early phase of the disease. These patients are classified as
“arrhythmogenic DCM” patients. Halliday and his colleagues have proven that the presence of midwall LGE identifies patients with high SCD risk even in the subgroup of DCM patients with LVEF≥40% suggesting that DCM patients with only mildly reduced
22
or preserved LVEF but with midwall LGE may also benefit from ICD implantation (82).
Physiological cardiac remodelling caused by regular intensive training may mimic DCM. Up to 15% of the athletes have increased cardiac dimensions. Moreover LVEF may be reduced in 45% of highly trained elite athletes (15, 83). As competitive sport activity may increase the risk of SCD, symptomatic patients with DCM should not participate in most competitive sports with the exception of low-intensity sports (class 1A sports such as billiards, bowling, cricket, golf) in selected cases (45). The precise evaluation of cardiac dimensions and ventricular function are crucial in these clinical scenarios (Figure 7).
Figure 7: CMR images of a young water-polo player with preserved LVEF (50%). Four chamber cine image shows marked left ventricular dilatation (LVEDVi: 154 ml/m2, RVEDVi: 122 ml/m2), where the presence of mild midmyocardial septal LGE confirmed the suspicion of DCM. Heart and Vascular Center, Semmelweis University.
1.4 Reverse remodelling
1.4.1 Reverse remodelling in athletes – cardiac deconditioning
The physiological cardiac adaptation to vigorous exercise, in normal conditions is a reversible process (Figure 8). In athletes with structural heart disease the ventricular dilation and/or hypertrophy may decrease, but will not completely return to normal.
23
Based on this observation, deconditioning may have an important role in the differential diagnosis between healthy athletes and cardiomyopathies (84-86).
However, extreme forms of cardiac adaptation in athletes raised the suspicion that exercise-related adaptations in healthy athletes are not always completely reversible.
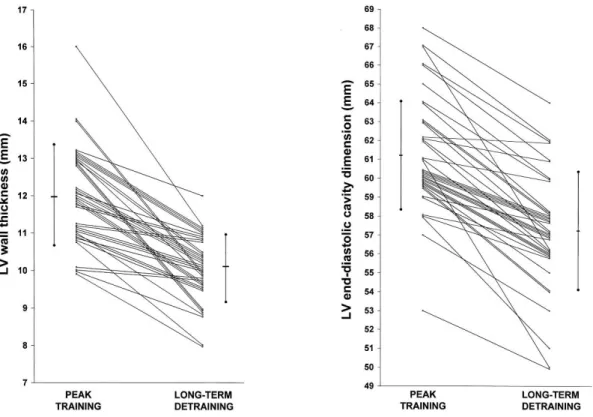
The study by Pelliccia et al. reported incomplete reversal of pronounced LV dilatation after deconditioning and chamber enlargement persisted in 20% of the retired athletes after five years (84).
Figure 8: LV wall thickness and LV end-diastolic cavity dimensions in elite athletes after a long-term detraining. (84) LV, left ventricular.
Biffi et al. reported a significant decrease in the frequency and complexity of ventricular arrhythmias after deconditioning, suggesting that electrical remodelling is part of the athlete’s heart spectrum (Figure 9) (87).
24
Figure 9: Number of premature beats, couplets and nsVTs at peak training and after deconditioning in 70 athletes based on 24-h Holter electrocardiogram. (87) PVDs, Premature ventricular beats; nsVT, nonsustained ventricular tachycardia.
Based on the fact, that reduction of the number of ventricular arrhythmias during detraining may be present in healthy athletes and athletes with cardiomyopathy, forced deconditioning in order to differentiate between pathology and physiological adaptation is not recommended (88).
1.4.2 Reverse remodelling due to pharmacological and non- pharmacological therapy
Patients with reduced ejection fraction (both with ischaemic and non-ischaemic aetiology) may undergo remarkable reverse remodelling after heart failure therapy or even spontaneously (89). In the absence of a universal definition for reverse remodelling, most studies define it as an increase in LVEF ≥10% with a decrease in left ventricular end-diastolic volume (LVEDV) and left ventricular end-systolic volume (LVESV). Many studies have proven that the improvement of LVEF and decrease in LVEDV and LVESV are associated with a better outcome (90-92) as shown in Figure 10.
25
Figure 10: Survival curves of DCM patients show long-term prognostic impact of left ventricular reverse remodelling (93). LVRR, left ventricular reverse remodelling; D, death; HTx, heart transplantation.
Identifying patients who may remodel and who may not would be essential to optimize patient management. Therefore identifying predictors of reverse remodelling has a significant clinical importance. It has been proven that baseline end-diastolic volume, but not baseline LVEF predicts reverse remodelling (93-95). Baseline left atrial volume and right ventricular function might be also a predictor in specific patient populations (96, 97). Kubanek et al. showed that in DCM patients with recent onset of heart failure symptoms, the extent of LGE and higher myocardial oedema ratio is an independent predictor of reverse remodelling (98). Other CMR-based studies failed to prove the predictive nature of LGE suggesting that larger trials with more objective criteria for identification of mid-wall fibrosis are greatly demanded (94, 99).
Beside optimal medical therapy, cardiac resynchronization therapy (CRT) is an effective therapeutic option to achieve reverse remodelling in heart failure patients with reduced ejection fraction and wide QRS with LBBB morphology (79). Figure 11.
represents remarkable reverse remodelling in a patient after CRT implantation.
26
Figure 11: Long- (A,C) and short-axis (B, D) CMR cine images in end-diastolic phase at baseline (A-B) and six months after CRT implantation (C,D) represent apparent reverse remodelling. Sphericity index decreased (3D sphericity index: 0.34 vs 0.17);
relative wall thickness increased (0.38 vs 0.51) and LV volumes also decreased (LVESVi 98 vs 33 ml/m2; LVEDVi 129 vs 74 ml/m2). Generator (yellow arrow) and lead related artifacts (white arrow) do not significantly affect image quality. Heart and Vascular Center, Semmelweis University.
While the rate of non-responders mainly depends on how CRT response is defined, approximately 30-40% of patients with guideline based CRT indication do not show a clear benefit after CRT implantation (100). Therefore, determining factors of outcome has a great importance. A native LBBB, non-ischaemic aetiology, female gender and a
27
wider QRS duration is associated with reverse remodelling and better outcome (101).
Other factors such as mechanical dyssynchrony assessed using echocardiography have been intensively studied. Although several single-centre studies have proven the role of imaging in prediction of CRT response (102-105), in a large multicenter setting, no single echocardiographic parameter was able to predict CRT response (106). Combining advanced imaging techniques such as echocardiography-based strain imaging and CMR-based scar identification may have benefit in predicting CRT response.
Hopefully, an ongoing large multicenter prospective study on multimodality-imaging may elucidate controversial issues in previous research (107).
Reverse remodelling represents a multilevel molecular, cellular and anatomic reversion towards a normal myocardial structure and function, and can manifest in myocardial recovery or remission. Further research may support our fundamental understanding of reverse remodelling’s nature and the underlying mechanisms. (108).
1.5 Cardiac magnetic resonance imaging and its role in the assessment of cardiac remodelling
Cardiac magnetic resonance (CMR) imaging is the gold standard non-invasive method to evaluate left and right ventricular volumes, mass and ejection fraction. Furthermore, it enables identification and precise quantification of myocardial scar tissue.
Functional changes in cardiac remodelling can be characterized using CMR imaging for the assessment of left and right ventricular ejection fraction (LVEF, RVEF), and stroke volume (LVSV, RVSV). Quantification of the left and right ventricular volumes, mass and ejection fraction is based on manual delineation of the endocardium and epicardium on the short-axis cine images in end-systolic and end-diastolic phase. Using conventional quantification techniques the volume in between the endo- and epicardial contour is considered to be myocardial mass, and the volume within the endocardial line is considered to be blood. Novel threshold-based quantification techniques enable the quantification of the trabeculae and papillary muscles. The semi-automatic threshold- based algorithm allows us to estimate the spatially varying signal intensities of blood and muscle within an observer-provided epicardial contour. Voxels with signal
28
intensities above the specified threshold are considered to be blood, voxels with signal intensities below the threshold are considered to be myocardium. Quantification of papillary muscles and trabeculae may play an important role detailed volumetric assessment especially in conditions with hypertrophy such as in HCM or athlete’s heart.
Moreover, it may also contribute to a significant reduction in time required for post- processing (109).
CMR is an excellent modality for measuring strain, but the majority of the strain analysis techniques required additional sequences. CMR-based deformation imaging therefore has not been widely used till the development of feature tracking analysis.
This novel quantification technique enables the assessment of myocardial strain using the conventional balanced steady-state free precession (bSSFP) cine images, no additional image acquisition is required. The optimal myocardium blood contrast provides optimal definition of the endocardial layer, therefore endocardial features can be tracked through the cardiac cylcle similar to the speckle tracking technique (110).
Feature tracking enables measurement of global and regional left and right ventricular strain parameters, mechanical dispersion and intraventricular dyssynchrony as well.
Cardiac remodeling is not only characterized by functional, but also morphological changes. Changes in cavity size and mass can be measured as left and right ventricular end-diastolic volume (LVEDV, RVEDV), end-systolic volume (LVESV, RVESV) and myocardial mass (LVM, RVM). Alterations in ventricular geometry/shape can be described using geometric indices such as sphericity index, relative wall thickness or maximal end-diastolic wall thickness to left ventricular end-diastolic volume index ratio (EDWT/LVEDVi) and left ventricular mass to end-diastolic volume ratio.
CMR also enables to detect structural changes of the heart by detecting scar formation and replacement fibrosis with late gadolinium enhancement technique (111). Ten to twenty minutes after gadolinium-based contrast administration, applying T1-wheighted inversion recovery gradient-echo sequences and nulling the normal myocardium – supressing the signal from healthy myocardium –, enables to differentiate normal tissue (dark) and fibrotic tissue (bright) (Figure 12). The localisation and pattern of the LGE allows us to differentiate between ischaemic and non-ischaemic aetiology as well as to distinguish between various non-ischaemic forms of cardiomyopathies (Figure 12).
29
Figure 12: Representation of LGE patterns characteristic for ischaemic and non- ischaemic pathologies. Adapted by Karamitsos et al. (112). DCM, dilated cardiomyopathy; HCM, hypertrophic cardiomyopathy; LGE, late gadolinium enhancement; MI, myocardial infarction.
Beside the diagnostic role, the presence of LGE also has an added value in risk stratification. The extent and localisation of fibrosis in different cardiomyopathies are associated with adverse clinical outcomes including heart failure and ventricular arrhythmias (113-116). Patients with LGE have a higher incidence of ventricular arrhythmias and adverse cardiac outcomes (117-119). Ventricular scar may act as a substrate of life-threatening arrhythmias, and detecting fibrosis using CMR imaging is becoming a part of the clinical work-up also in the field of sports cardiology.
Previously, it was understood that existing myocardial fibrotic tissue represents definite pathology, but recent literature suggests that focal LGE in the insertion points with unknown significance may be present in asymptomatic athletes. Potential mechanism behind aspecific myocardial fibrosis in athletes may be caused by pressure overload, exercise-induced repetitive microinjuries, genetic predisposition or silent myocarditis (120).
Advanced CMR techniques, such as native T1 mapping and calculation of extracellular volume, may also play an important role in the characterization of pathological and
30
physiological cardiac remodelling, especially in conditions with diffuse fibrosis (121, 122). Despite the many advantages of CMR techniques, implanted cardiac devices may carry some limitations. In the past, performing CMR examination in patients with pacemaker, ICD, CRT or implantable loop recorders has been contraindicated due to safety concerns. Recent data suggest that implanted cardiac devices represent no absolute contraindication. Manufacturers started to develop MRI conditional systems. A prospective, randomized multicenter study has proven no MRI-related contraindication, no MRI-attributed pacemaker sensing or threshold changes were observed (123).
Moreover, large clinical studies have proven that applying prespecified safety protocol and careful programming, thoracic and non-thoracic MR examinations even in patients with non-conditional PM or ICD are safe. Addressing the concerns that MR examination may lead to decreased sensing, impedance or increased capture threshold, large clinical studies have proved that these changes on device parameters are non- significant. Cardiac events are very rare including power-on reset, especially in ICD devices with low battery life, but in case of appropriate programming and imaging, the CMR examination do not lead to serious adverse cardiac events (124, 125). As fractured or abandoned leads may increase the risk of heating, scanning in these cases is not recommended. In addition, it is recommended to avoid MR imaging within six weeks post device implantation.
The technical improvement regarding devices, improved image quality and positive safety results of large trials will lead to further improvement of scanning patients with implanted cardiac devices. In case of relative contraindications for CMR examination, the benefits and potential risks should be carefully assessed.
1.6 Electroanatomic mapping and its role in the assessment of cardiac remodelling
Besides functional and morphological changes, cardiac remodelling is characterized by structural alterations of the left ventricle including scar formation. As scar tissue is a potential substrate of ventricular arrhythmias, its identification and modification during
31
radiofrequency catheter ablation (RFCA) may play an important role in the treatment of malignant ventricular arrhythmias in patients with structural heart disease.
Electroanatomic mapping (EAM) using various mapping systems enables the detection of pathological fibrous, fatty, or inflammatory infiltrates inside the myocardium and the identification of low voltage or dense scar areas in three-dimensional electroanatomic maps. It may facilitate mapping and RFCA of cardiac arrhythmias including macro- reentrant VT (126). Accurate identification of the pathological substrate especially in DCM is difficult; literature is controversial regarding thresholds for abnormal bipolar and unipolar voltages. Several studies have suggested different cut-off levels for normal and abnormal bipolar and unipolar, endocardial and epicardial left ventricular voltage values obtained by EAM. Based on previously proposed cut-off values to detect pathological substrates, low voltage area is mainly defined as electrograms with a bipolar voltage <1.5 mV, while dense scar is usually defined as a bipolar voltage <0.5 mV for the LV endocardium (127, 128). These thresholds are well validated in patients with ischaemic aetiology and although they are adopted for patients with DCM, only limited data support the validity of these cut-offs in DCM (129). Glashan and his colleagues analysed EAM for pathological substrate identification in DCM, and validated their findings by histology. They have concluded that pathological substrates in DCM fundamentally differ from substrates in patients with ischaemic aetiologies.
Therefore the currently applied EAM approaches need to be redefined and take the extent and localisation of fibrosis into account (130). Even though there are fixed thresholds for EAM, many clinical cardiac electrophysiologist change these cut-off values in order to better delineate pathological substrates.
As EAM provides a helpful tool in tissue characterization by reconstructing the VT circuits in structural heart diseases, it may contribute to improve outcomes of RFCA of ventricular tachycardia in patients with DCM.
32
2. Study aims
The main goal of our study was to analyse the functional, morphological and mechanical changes during physiological and pathological remodelling and reverse remodelling with the help of different CMR techniques.
2.1 Differentiation of pathological and physiological remodelling
The first aim of our studies was to describe then compare characteristics of physiological and pathological remodelling in athletes as well in cardiomyopathy patients, and to investigate the clinical and CMR characteristics of elite athletes with cardiomyopathies. We aimed to establish CMR parameters and cut-off values which may help to differentiate pathological and physiological remodelling.
2.2 Electro-anatomic and tissue characterization
Second aim was to investigate structural and electrophysiological remodelling in DCM patients by performing tissue characterization using CMR and electroanatomic characterization using electroanatomic mapping. We aimed to compare the distribution of late gadolinium enhancement and electroanatomical substrate. We proposed to assess VT ablation outcome and factors wich may influence the success.
2.3 Reverse remodelling assessment
Third goal was to investigate reverse remodelling as an effect of cardiac resynchronization therapy in symptomatic heart failure patients despite optimal medical therapy with broad QRS and LBBB morphology applying biventricular pacing during CMR examination. We also aimed to investigate the differences in the left ventricular function and mechanics between biventricular and asynchronous pacing modes.
33
3. Methods
3.1 Study design and study populations
3.1.1 Study design and study population of the Differentiation of pathological and physiological remodelling project
This retrospective study was conducted in the Semmelweis University Heart and Vascular Center. Healthy highly trained athletes, athletic and sedentary HCM and ARVC patients were examined using cardiac magnetic resonance imaging.
Non-athlete HCM patients (n=194, 50.2±13.6y, 108 male) with preserved ejection fraction (LVEF ≥50%) were consecutively enrolled. HCM was defined according to the current ESC guideline (40), as a maximal wall thickness ≥15 mm measured by CMR that is not explained solely by loading conditions. In 11% of our HCM patients who had wall thickness between 13–14 mm we evaluated other features including family history, electrocardiogram (ECG) and typical LGE pattern. Ten additional athletes (31±10y; 9 male, 14.4±6.5 training hours/week) were examined during training or competition period with the suspicion of HCM, and the comprehensive clinical investigation confirmed the diagnosis.
Non-athlete patients with definite diagnosis of ARVC (n=34, 40.5±13.4y, 22 male) were enrolled based on the revised Task Force Criteria (53). Eight additional highly trained athletes with ARVC (27.6±3.3y, 18.9±4.6 training hours/week, seven male) were enrolled, and the comprehensive investigation including resting ECG, ambulatory ECG monitoring, echocardiography, CMR and medical history confirmed the diagnosis.
Healthy athletes free of any cardiovascular diseases without ECG abnormality suggesting structural heart disease were recruited. The athletic cohort was comprised from canoe and kayak paddlers, water-polo players, rowers, handball players, speed skaters, swimmers, athletics, tennis players, cross country skiers, basketball players or cyclists.
Highly trained healthy athletes members of the National or Olympic Team (n = 150, 24.2±4.8y, 101 male) with a minimum of 18 hours of training per week for at least the last 18 months (male and female athletes with an average training per week: 22.1±5.1 h
34
and 21.2±3.5 h, respectively) performing highly dynamic, and at least, moderate static sports served as a control group of the sedentary HCM patient group.
Thirty-four highly trained healthy athletes with with a minimum of 15 hours of training per week for at least five years performing sports with high dynamic and static components (31.8 ± 6.1 years, 22 male, 18.6 ± 2.2 training h/week) served as a control group of the sedentary ARVC patient group.
Ethical approval was obtained from the Central Ethics Committee of Hungary (5012- 0/2011-EKU (142/PI/11)). Informed consent was obtained from all individual participants included in the study.
3.1.2 Study design and study population of Electroanatomic and tissue characterization project
This retrospective study was conducted in the Heart Center University of Leipzig. DCM patients (n=50, 58±15y, 39 male) who underwent RFCA of sustained VT or ventricular premature beats (VPB) and CMR scan (<30 days prior the ablation) were enrolled. The inclusion of the patients was based on the morphological appearance of a dilated LV and reduced ejection fraction using separate LVEDVi and LVEF criteria for men and women (131). Patients with significant coronary artery disease were excluded, and in case of VPB only patients without improvement of the LVEF after ablation were included. The CMR and EAM data were analysed by two blinded investigators, a third investigator was responsible for the spatial alignment of the EAM and CMR. An interrogation of the implantable cardioverter-defibrillator (ICD) devices and Holter ECGs were used to follow-up.
3.1.3 Study design and study population of Reverse remodelling project
This prospective study was conducted in the Semmelweis University Heart and Vascular Center. Patients (n=13, 64±7y, five male) with CRT indication according to
35
the current guidelines (symptomatic heart failure, LVEF ≤35%, New York Heart Association functional class II-III on optimal medical therapy for at least 3 months), complete LBBB and broad QRS (>150 ms) were prospectively recruited. All patients were in sinus rhythm and normal atrioventricular conduction. Exclusion criteria were any contraindications of CMR examination or CRT implantation. Patients meeting all inclusion criteria and with no exclusion criteria underwent the implantation of a commercially available MRI conditional CRT-P (n=5) or CRT-D (n=8) device. Baseline CMR scan with contrast material was performed 1-14 days before CRT implantation, and follow-up non-contrast CMR scan was performed at six months ± 14 days after CRT implantation during biventricular pacing (DOO) and right atrial pacing (AOO).
Changes of device parameters (e.g., impedance, thresholds, sensing and battery voltage) were recorded pre- and post CMR scan. ProBNP was measured and a 12-lead ECG was perormed at baseline and follow-up. CRT response was defined as the followings: 1) super-response: decrease in LVESVi >30%, 2) response: decrease in LVESVi >15%, 3) non-response: decrease in LVESVi <15%.
All patients provided written informed consent prior to enrolment. Approval was obtained from the local ethics committee (034309-006/2014/OTIG).
3.2 Image acquisition and analysis
3.2.1 Differentiation of pathological and physiological remodelling project
CMR imaging
CMR examinations were conducted on a 1.5 T MR scanner (Achieva, Philips Medical Systems, Best, The Netherlands) with a 5-channel cardiac coil. For the assessment of cardiac dimensions and functions, retrospectively-gated, balanced steady-state free precession (bSSFP) segmented cine images were acquired in 2-chamber, 4-chamber and LV and RV outflow tract views. Short-axis images with full coverage of the left and right ventricle were obtained. Late gadolinium enhancement (LGE) imaging was performed. During an inspiratory breath-hold, a bolus of gadobutrol (0.15 mmol/kg)
36
was injected at a rate of 2–3 ml/s through antecubital intravenous line. Contrast- enhanced images were acquired using a segmented inversion recovery sequence with additional phase sensitive reconstructions in the same views used for cine images 10–20 min after contrast administration.
Images were evaluated with Medis QMass 7.6 quantification software (Medis Medical Imaging Software, Leiden, The Netherlands). Endocardial and epicardial contour detection was performed by a blinded expert observer manually on short axis cine images. Quantification of the left ventricular ejection fraction (LVEF), volumes (LVESV, LVEDV, LVSV) and myocardial mass (LVM) were performed using conventional quantification method (CQ) (Medis QMass 7.6). Left ventricular volumes and masses were standardized to body surface area (BSA).
In nonathletic and athletic HCM patients and in a subgroup of athletes a threshold-based quantification method (TQ) (Medis QMass 7.6 MassK algorithm) was also performed (Figure 13). Using TQ the trabeculae and papillary muscles (TPM) were also quantified, the semi-automatic threshold-based algorithm allows us to estimate the spatially varying signal intensities of blood and muscle within an observer-provided epicardial contour. Voxels with signal intensities above the specified threshold are considered to be blood, voxels with signal intensities below the threshold are considered to be myocardium.
37
Figure 13: Conventional quantification (A,B,C,D) and threshold-based quantification method (E,F,G,H) in HCM (A,E), healthy athlete (B,F), healthy athlete with EDWT in the grey zone of hypertrophy (C,G) and athlete with HCM (D,H).
Maximal end-diastolic wall thickness (EDWT) measurements were performed in a short axis slice perpendicularly to the myocardial center line excluding right ventricular trabeculation. Minimal EDWT was measured in the same slice as the maximal EDWT.
To further characterize the left ventricular hypertrophy and geometry, sport indices were derived using both conventional and threshold-based quantification method, such as left ventricular maximal diastolic wall thickness to end-diastolic volume index ratio (EDWT(mm)/LVEDVi(ml/m2)) and left ventricular mass to end-diastolic volume ratio (LVM(g)/LVEDV(ml)). Using threshold-based quantification TPM%
((TPM(g)/LVM(g) *100) was also established.
In nonathletic and athletic ARVC patients and in a subgroup of healthy athletes additionally quantification of right ventricular ejection fraction (RVEF), volumes (RVESV, RVEDV, RVSV) and myocardial mass (RVM) were performed using conventional quantification method. Regional right ventricular akinesis, dyskinesis, dyssynchrony were qualitatively assessed. Global LV and RV strain analysis was performed based on cine images after manual contouring of the endocardial borders.
Additionally, regional strain analysis for the right ventricular free wall was performed based on RV endocardial contours on 4CH-view, peak systolic longitudinal strain and strain rate values of the basal, midventricular and apical free wall were established (Figure 14). Average and minimal values of the measured regional strain and strain rate values were also determined. Medical history, family history and 12-lead ECG were also obtained.
38
Figure 14. Regional free RV wall strain analysis of a healthy athlete (a) and a highly trained athlete with ARVC (b). Strain curves of the athlete with ARVC represent regional RV dyssynchrony and decreased longitudinal strain of the midventricular (white) and apical (blue) RV free wall. Segments of the RV free wall and regional strain values of these segments are presented with same colour. RV, right ventricular.
3.2.2 Electroanatomic and tissue characterization project
CMR imaging
CMR examinations were conducted on a 1.5 T MR scanner (Philips Ingenia, The Netherlands). Balanced steady-state free precession (bSSFP) segmented cine images were acquired as described before. Three-dimensional, high-resolution LGE-CMR imaging was performed more than 10 min after the application of intravenous contrast (gadolinium- DTPA, 0.2 mmol/kg). Two different protocols were used for patients with and without devices. For patients without devices, we performed a high-resolution,
39
three-dimensional LGE imaging: free breathing, navigator-gated image data acquisition, the measured in-plane spatial resolution was 1.4x1.4x4.0 mm which was reconstructed to 0.7x0.7x2.0 mm. For device patients, we used multi-slice two-dimensional LGE employing the wideband technique with a bandwidth of the pre-pulse of 3000 Hz and a frequency offset of +1000 Hz during breath holding. The scans were performed in single breath hold with a measured spatial resolution of 1.7x1.7x10 mm, and reconstructed to 1.3x1.3x10 mm. Image analysis was performed using IntelliSpace Portal 6, Philips Healthcare. LVEF, LVEDVi, LVESVi, LVSVi, and LVMi were evaluated based on short-axis images after manual contouring as described before.
Images were evaluated qualitatively by an observer blinded to the electroanatomical map for the presence or absence, pattern (subendocardial, mid-myocardial, subepicardial, transmural) and regional distribution of LGE areas using standardized myocardial 17-segment model. Extent of the LGE and its volume were established, LGE positive areas were quantified by thresholding signal intensity using the full-width half maximum (FWHM) method that defines the enhanced area by using 50% of the maximum signal found within the enhanced area.
Electro-anatomical mapping and electro-anatomical map adjustment
Endo- and epicardial cardial detailed maps of the left ventricle were obtained during sinus rhythm or ventricular pacing using CARTO system (Biosense Webster Inc., Diamond Bar, CA) with a 3.5-mm open irrigated-tip catheter (Navistar Thermocool, Biosense Webster Inc.). Bipolar (bandpass filtered at 30 to 500 Hz) electrograms were recorded and displayed at 200 mm/s sweep speed. A detailed assessment of individual electrogram characteristics was made off-line. The perivalvular areas were excluded.
The bipolar low-voltage areas were defined by the accepted thresholds for patients with ischaemic cardiomyopathy: 0.5–1.5 mV, dense scar area was defined as <0.5 mV. The distribution of the low-voltage areas was described based on the AHA (American Heart Association) 17-segment model (Figure 15).