Chapter 2
Bacteria in Soil
F. E. CLARK
U.S. Department of Agriculture Fort Collins, Colorado, U.S.A.
I. Introduction . . .
II. The Number of Bacteria in Soil . . . . III. The Bacterial Biomass and its Spatial Requirement IV. Respiratory Activity of Soil Bacteria
V. Factors Limiting Soil Bacterial Activity VI. Distributional Patterns of Bacteria in Soils VII. Moisture Requirements
VIII. Aeration Requirement
IX. Reaction and Temperature Requirements X. Biotic Limitations on Bacterial Activity . XI. Patterns in Microbial Transformations .
XII. The Priming Effect in Decomposition of Soil Humus XIII. Some Proposed Groupings of the Soil Bacteria XIV. Zymogenous and Autochthonous Floras
XV. The Predominant Bacteria in Soil . . . . XVI. Other Bacteria Abundant in Soil . . . . XVII. Well-known Genera not Abundantly Present in Soil
References . . .
15 16 17 18 20 22 26 28 31 32 33 39 40 42 43 44 45 47 I. I N T R O D U C T I O N
Bacteria are the smallest and the most numerous of the free-living micro- organisms in soil. Taken collectively, their spectrum of autotrophic and hetero- trophic capabilities is matched by none other of the major groups of the soil life. It belies their small size and comparatively simple morphology. Notwith- standing the abundance of bacteria in soil and extensive information about the activities of individual species in standardized environments, the role of bacteria in many soil processes is still poorly understood. Much also remains unknown concerning the forms of bacteria in soil and their ecological relation- ships within their micro-environments.
Commonly the soil bacteria are discussed according to their participations in the nitrogen and carbon cycles or in other cyclical transformations in soil.
Discussions of them may also be undertaken on the basis of their morphology and taxonomy, their environmental tolerances, their spatial distribution in soil, and from the standpoint of their biotic relationships with other micro- organisms or with higher plants. Several of these approaches are used in
subsequent chapters. It is the purpose of this chapter to consider the bacteria en masse in the soil, with little or no effort to spell out the many special problems posed by individual genera or species.
II. THE N U M B E R OF BACTERIA IN SOIL
The number of bacteria in 1 g of soil ranges from 1 million or less to several billions.* That their population needs to be expressed within such extremes is in part due to the great differences in populations that do exist among and within soils. Somewhat more disconcerting is the fact that with existing methodology, the bacterial population cannot be determined with precision in any given soil sample. Estimation, not measurement, is accomplished.
Estimates are made culturally or by direct microscopic examination.
The cultural method most commonly employed is the dilution plate technique.
A primary assumption in this technique is that each viable bacterium in the soil suspension used as an inoculant develops into a visible colony during incubation. Any such assumption is highly idealistic. It is not possible to prepare any one combination of substrate ingredients and conditions of incubation that will permit the growth of all bacterial species. Even with the cultural conditions made as optimal as knowledge permits for a given species, not all viable cells of that species will invariably produce colonies. Due to differences in stored reserves and enzymatic activity, or in dormancy or senescence, the individual cells are not equally vigorous in initiating growth.
There also are differences in their micro-environments within the cultural substrate, as for example, proximity or lack of proximity to other microbial cells.
That collectively these several factors can suppress colony formation by the majority of bacterial cells seeded into agar has been shown by Tchan (1952).
A known number of cells was taken from a young, actively growing culture of Azotobacter and transplanted into glucose agar. As microscopic examina- tion of the inoculant showed all cells to be actively motile, all the seeded cells were considered to be viable. The number of colonies subsequently developing represented only 25-33% of the number of bacterial cells known to have been seeded. If only one cell in three or four of a vigorously growing bacterium such as Azotobacter can successfully accomplish colony formation in a sub- strate designed especially for this organism, then it would indeed be sur- prising if more than one cell in ten, or even one in a hundred, of the wide assortment of bacteria in soil could initiate colony formation when seeded jointly on any single substrate under any given set of incubation conditions.
Soil bacterial populations as determined by cultural methods range from a few thousand cells per gram of soil to several hundred millions. Sand dunes, tundras, stony soils, and podsols usually contain comparatively low, and chernozems and other prairie soils, comparatively high bacterial populations.
Commonly for arable soils cultural methods of examination reveal from
* One billion as used by_ the author equals 109.
2. BACTERIA IN SOIL 17 5-50 million bacteria/g of soil. In rare instances bacterial populations as high as 500 million/g have been determined for field soil by cultural methods (Krasilnikov, 1958).
Even this value, however, hardly approaches the population estimates made by direct microscopical procedures. Strugger (1948), using fluorescent micro- scopy, observed from 2-9 billion viable cells/g. Taylor (1936), working with Rothamsted soils and using the dilution ratio method for direct counting, observed soil bacterial populations of approximately 3 billion/g. Direct counts were of the order of 10-50 times the magnitude of the agar plate counts made on the same samples. Jensen (1936) reported quite similar results for Australian soils. Direct counts were from 8-300 times higher than plate counts. The widest ratios between direct and cultural counts were found in soils receiving no recent additions of energy-rich material, such as green manure. Immediately following addition of an organic material to soil, the ratio between the two counts was narrowed very markedly. It frequently became less than 10 and at times approached unity.
Citations such as the preceding indicate that the soil bacterial population as determined by direct microscopy is usually of the order of 1-3 billion/g.
In highly fertile soils and for short periods, the value may approach 10 billion.
For purposes of discussion in some immediately following paragraphs, 2 billion cells/g will be taken as a representative value for the bacterial popula- tion of soil. Also, a representative bacterial cell in soil will be considered as spherical and to have a cell volume of 1 μ3. These two generalizations permit making some estimates of the weight of bacteria in soil and of the extent to which bacteria occupy the available space in soil. The standard population estimate will also be used for considering the suitability of soil as a milieu for bacterial growth.
III. THE B A C T E R I A L BIOMASS A N D ITS SPATIAL R E Q U I R E M E N T
On the basis of either a cell volume of 1 μ3 and a cell density only slightly in excess of unity (1-04 according to Kendall, 1928) or on the common general- ization that 1 trillion bacterial cells weigh 1 g (Pelczar and Reid, 1958), a direct count estimate of 2 billion bacterial cells/g of soil accounts for 0-2%
of the soil weight. This amounts to 4,000 lb live weight of bacteria/acre 6 in.
For many arable soils, the assumed bacterial population value, and there- fore the live weight value per acre are probably over-estimates, but not markedly so. Most writers prefer to state a general range of values when speaking of the amount of bacterial tissue per acre. Alexander (1961) has stated the range as from 300-3,000 lb/acre-furrow slice; Russell (1950), as from 1,500-3,500 lb; and Krasilnikov (1944), as 600-1,200 lb for uncropped soils, to as high as 3,600-6,400 lb for soil cropped to legumes.
In most arable soils, the amount of living bacterial tissue per acre is com- monly estimated to be somewhat less than that of the fungi, but to exceed that of the algae, protozoa, and nematodes combined. The matter of
18 F. E. CLARK
comparative weight, or biomass, in relation to population numbers merits emphasis. Although on a census basis the Eubacteriales may outnumber the Actinomycetales by a factor of 10, and the fungi by a factor of 100, the eubacterial biomass in many cultivated soils is about equal to that of the actinomycetes, and only about half that of the soil fungi.
To what extent do bacteria occupy the available space in soil? First, this can be calculated using the assumption that normally the bacteria exist in the water film in soil. For a soil containing 0-3 ml water/g, a bacterial popu- lation of 2 billion will occupy no more than 1*33% of the theoretically avail- able space. This calculation is based on the fact that spheres, regardless of size other than the provision that they be of uniform size, when uniformly open or cubic-packed within a container, occupy approximately one-half the container volume. Accordingly, in 0-3 ml presumably there could occur 150 billion cells. If, however, the bacterial cells are sufficiently plastic that they pack solidly, then the estimated 1-33% occupancy figure becomes halved.
Obviously also, if there were nothing to inhibit growth, the bacteria would continue to multiply until they packed the total porosity in soil. In such instance, there could occur something like 500 billion bacteria/g of soil, and the standard population postulated would occupy no more than 0-4% of the available space. Even this figure appears discordant with the statement a few lines above that 2 billion bacteria/g constitute only 0-2% of the soil weight.
That the two values are not inharmonious becomes apparent when one con- siders that the space occupied by the mineral particles is not included when calculating the soil space available for occupancy by bacteria.
At first glance, an approximate 0-4 to 1Ό% occupancy of available space suggests that the soil is not an especially suitable environment for bacteria.
Accordingly, it becomes fitting to compare the bacterial density in soil to the populations that are encountered in various other environments. Rahn (1945) has recorded some population densities for soured milk and for fresh human feces, as well as for nutrient broth in which bacterial growth has been allowed to continue to a maximum population level. For all three environ- ments, his estimates are of the order of 1 billion cells/g. This value is entirely comparable to the bacterial population in soil. Rahn's estimates are quite conservative, inasmuch as the writer has made estimates as high as 20 billion/g of decaying plant material as found in the field, and as high as 40 billion/g for fresh feces. Even higher values are on record, for example, 46 billion/g in decomposing green manure (Smith and Humfeld, 1930), and 100 billion/g in an infant's feces (Smith, 1961). Nevertheless, it still must be emphasized that on the basis of its contained population, the soil does appear to be an excellent environment for bacteria.
IV. R E S P I R A T O R Y ACTIVITY OF SOIL BACTERIA Numbers alone, however, are no measure of microbial activity. It is possible that a high population present in an environment, particularly if the population estimate is based on direct microscopy, can be largely dormant or
2. BACTERIA IN SOIL 19 resting. Some assessment of the general activity level of the soil microbial population can be obtained by considering respiratory activity. This can be done conveniently in terms of carbon dioxide production.
According to Mooney and Winslow (1935), carbon dioxide production in glucose-peptone broth by Salmonella pullorum occurs at a rate of 1-14 mg/
billion cells per hour during the early logarithmic growth phase. At stationary maximum population, the rate was determined as 0-08 mg. Similar data were obtained by Walker and Winslow (1932) working with Escherichia coli.
They reported 0-41 to 1-85 mg C02/billion cells per hour in the late logarith- mic phase, and less than 0-02 mg at the close of the logarithmic phase. Actively multiplying bacterial cells therefore appear capable of producing many times their dry matter weight of C02 during 24 hours, whereas in stationary popu- lations the production of C02 during 24 hours is approximately the equivalent of dry cell weight.
This latter estimate is in reasonable agreement with some observations on C02 production by micro-organisms in soil. Jensen (1936) noted production of up to 0-22 mg C02/billion bacteria in 24 hours, or roughly the equivalent of the bacterial dry weight. In general, however, the C02 production per billion bacteria during 24 hours amounted to about 0*1 mg. Miller and Schmidt (1961) measured 0-12 mg C02/billion bacteria per day in laboratory soil culture, and Goring and Clark (1952), 0-11 mg, from glucose-amended laboratory sand cultures.
As a first approximation, therefore, it appears plausible to accept Jensen's estimate of 0-1 mg C02/billion bacteria per day. This is equivalent to 0-004 mg on an hourly basis, a rate that is appreciably below those cited above for the stationary phase of S. pullorum and E. coli.
Rate of carbon dioxide production by field soil has been given by Alexander (1961) as 20 lb/acre per day; by Vine, Thompson and Hardy (1942) as 3 1/m2 per day; and by Krasilnikov (1958) as 2 kg/hectare per hour. These values, if all reduced to a lb/acre per hour basis, become 0-83, 2-2, and 1-78, respectively. Their mean value is 1-6 lb C02/acre per hour.
On the basis of two separate premises stated above, namely, that there are 2 billion bacteria/g of soil, and that in soil, bacteria produce C 02 at the rate of 0-004 mg/hour per billion, then the 1-8 x 10¹⁵ bacteria in an acre-furrow slice should produce 7,200 g C02 in 1 hour. This quantity, 15-9 lb, appears entirely too high for any ready reconciliation with the 1-6 lb that has been revealed by some actual field measurements. How best can this discrepancy be resolved ?
It appears reasonable and even obligatory to accept the field measurement of 1-6 lb/acre per hour for C 02 production from soil. Insofar as production by the soil bacteria is concerned, the 1-6 lb must be several times too high, simply because the bacteria constitute only about one-fifth of the biomass in soil and therefore should be held responsible for only part of the total respira- tory activity in soil. Accordingly, it appears necessary to challenge the propo- sition that there are 2 billion cells/g of soil that are producing C 02 at the rate of 0-004 mg/billion bacteria per hour. Although some cells may be exhibiting
this or some higher level of respiratory activity, the majority of them must be greatly enfeebled or resting cells, or spores, that are exhibiting an exceed- ingly low level of respiratory activity. Many of these probably would not be determined in the course of making plate count determinations of the soil population.
Acceptance of the possibility that appreciably less than 2 billion bacteria/g of soil are active helps to explain the wide disparity between plate count and direct count estimates of the bacterial population in soil. If, as documented above, the direct count exceeds the plate count by a factor of 50- to 300-fold, with the ratio below 10-fold only in freshly amended soils or in laboratory cultures of bacteria, then perhaps the plate count when used on soil does enumerate the viable and active bacteria somewhat more successfully than much of the raw data would indicate. The plate count appears more com- patible with observed rate of C02 production by field soil than does the direct count. Bacterial plate counts of 50 million/g are commonly reported to occur in field soils. If this population respires at a rate of 0-004 mg C02/billion cells per hour, then in an acre-furrow slice it would produce C02 at the rate of 04 lb/hour. If one is willing to assume that the soil bacteria produce approxi- mately one-fourth of the 1-6 lb/acre per hour produced by the total microbial population in soil, then this calculation of 0-4 lb/hour appears entirely reasonable.
Irrespective of any such subsidiary calculation, the discrepancy between the 15-9 lb calculated production and the measured 1*6 lb production makes it appear plausible that a major proportion of the possibly 2 billion bacteria in a gram of soil are in a resting or dormant condition, with their respiratory activity at a level appreciably below that of bacterial cells in broth cultures in the stationary phase of their growth cycle. In brief, population and respira- tory data considered jointly indicate that soil permits the survival of a great many bacterial cells during periods in which they are not very active meta- bolically. It is probable that the resting vegetative cells of at least some soil organisms can attain levels of respiratory activity of the order of 0Ό004 mg C02/billion cells per hour. At this level of activity, bacterial cells in the soil, even if present in such numbers as are suggested by direct microscopical counts, would make only a very minor contribution to the respiratory output field soil of 1-6 lb C02/acre per hour.
V. F A C T O R S L I M I T I N G SOIL B A C T E R I A L ACTIVITY If commonly in the soil, many of the bacteria are either inactive or else are showing only a very low level of activity, what are the factors that limit their activity? There is no quick and easy answer to this question. To do it justice, one becomes almost endlessly involved in innumerable interactions concern- ing many different soil factors variously affecting different bacteria. Any such approach conflicts with the initially announced objective of this discussion and will not be undertaken. Attention in the following paragraphs will be directed in quite general terms to limitations on bacterial activity imposed by
2. BACTERIA IN SOIL 21 the available food supply and by certain physical and biological factors in the environment. The physical factors given brief attention are those of moisture, aeration, reaction, and temperature.
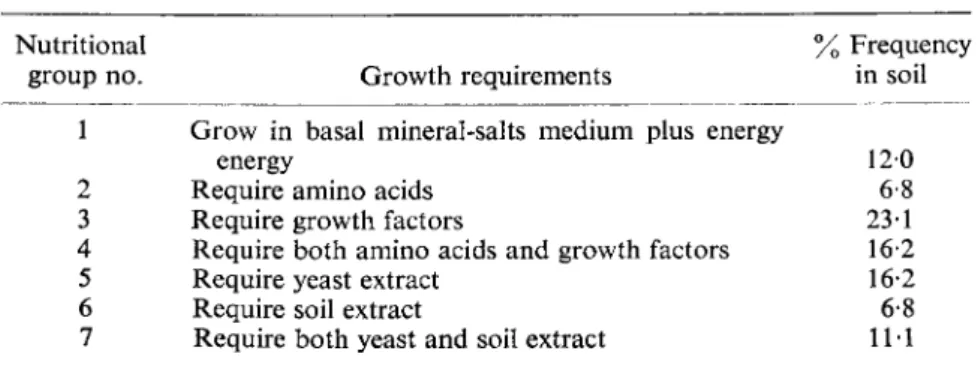
The principal factor limiting bacterial growth in soil is scarcity of food, or lack of a suitable and available source of energy. Consequently, any addition of fresh energy material to soil almost invariably elicits an increase in bac- terial activity. Many, if not most, bacteriologists believe that in the in vitro culture of single species of bacteria, the total yield of cells is proportional, over a wide range, to the amount of food available. The situation in soil in the presence of a mixed bacterial flora is probably analogous. Food supply is of paramount importance. The nature of an added energy material influences both the immediacy and the duration of the rise in activity, as well as the specificity of the responding flora.
Nutritionally, the great majority of the soil bacteria are heterotrophic, that is, they use organic compounds synthesized by autotrophic micro-organisms and higher plants both for their energy requirements and as the principal source of their cell carbon. In contrast, the autotrophic bacteria use carbon dioxide as a source of cell carbon and secure their energy by means of inor- ganic oxidations. Insofar as the nutrition of the heterotrophic bacteria is concerned, the amount of organic matter added to soil by autotrophic bacteria is negligible in comparison to that formed by the photosynthetic activity of higher plants. Although a tremendous tonnage of organic matter is produced yearly, the voracity of the heterotrophic organisms is such that in most soils the annual rate of decomposition balances out quite nicely with the annual rate of production of organic matter. Maintenance of this balance does not require that the soil organisms work at capacity throughout the year. Insofar as the soil bacteria are concerned, the supply of food materials in soil can be said to be perennially inadequate.
In instances where the supply of energy-yielding substrate is in itself adequate, it is possible that a short supply of one or more of the essential mineral nutrients or of necessary growth factors can be limiting for bacterial activity. A great deal of attention has been given to the requirements of bacteria for nitrogen, phosphorus, and other minerals in the course of decomposition of carbohydrates and of organic residues characterized by wide carbon/nitrogen ratios. With such materials, especially when used experimentally under favorable environmental conditions in the field or laboratory, dramatic stimulation of microbial activity can at times be achieved by using supplemental minerals. Data recently published by Stotzky and Norman (1961a, b) provide a good example. The respiratory output of carbon dioxide from a sandy soil treated with glucose only was doubled when nitrogen and phosphorus were used supplementarily. This rate in turn was quadrupled upon addition of sulfur.
A large number of essentially similar experiments could be cited. However, for most soils and with naturally occurring residues, similarly dramatic responses to supplemental minerals should not be expected to occur. In the work of Stotzky and Norman, the glucose amendment was free of sulfur,
and the sandy soil to which the glucose was added in liberal quantity was itself relatively low in sulfur content. Most organic residues reaching field soils contain nitrogen and other minerals in sufficient quantity that supplies of these minerals should be non-limiting or but slightly limiting to bacterial activity. Nevertheless, with more extended study it may be found that limiting supplies of mineral nutrients or vitamins more often restrict decomposition processes in soil than is generally recognized.
Nitrogen is the mineral nutrient most in demand by bacteria in decom- position of carbonaceous residues. Most crop residues containing 1·5% or more of nitrogen need no additional nitrogen to meet the needs of the bacteria.
For residues containing a lower level of nitrogen, the bacteria involved in the decomposition need extra nitrogen, particularly during the early stages of decomposition. Such extra nitrogen as is needed is usually available in the soil. Most arable soils in the course of a season produce from about 20 to about 100 lb of available nitrogen. The lower figure would be ample for the nitrogen demand during decomposition of 1 ton, and the latter figure for 5 tons, of straw or stover containing 0-5% nitrogen.
The quantity of residues returned annually to a soil is usually closely related to the nitrogen fertility of that soil. The residues from a poor soil are small and those from a fertile soil are large, and therefore less demand for soil nitrogen occurs in soils which are poor in nitrogen. It is difficult to find field conditions where the nitrogen content of the residues, when coupled with the available soil nitrogen, is not adequate to meet the nitrogen demands of the soil organisms carrying on the decomposition. Accordingly, it is but seldom that addition of nitrogen will accelerate residue decomposition in the field.
The fact that nitrogen is seldom limiting to the bacteria engaged in decom- position of residues does not mean that extreme nitrogen deficiency cannot occur in crop plants growing in soil well endowed with residues of wide car- bon/nitrogen ratios. In the presence of the abundant energy material, the soil organisms may demand all the available soil nitrogen, and leave none for the growing crop. Nitrogen fertilization therefore is essential for the crop but not for the bacteria.
The addition of nitrogen to crop residues does not, as is sometimes assumed, result in the retention of any greater percentage of plant residues as soil organic matter. Nitrogen additions to soils over a number of years do often result in a higher level of soil organic matter than would otherwise exist, but this is due to the production of larger crops and more residues, and not to any higher rate of residue conversion to soil organic matter.
VI. D I S T R I B U T I O N A L P A T T E R N S OF BACTERIA IN SOILS
Bacteria are not uniformly distributed throughout the soil profile, nor even throughout a single soil horizon. With but few exceptions, their distribution in soil echoes the distribution of soil organic matter. In the soil profile, organic matter content is usually highest in the A horizon and of lesser quantity in
the B and C horizons. A similar profile distribution of bacteria is commonly noted. Data compiled by Stare (1942) are cited in Table I. Essentially similar data have been obtained by various other workers in diverse localities.
There are, of course, many instances in which the standard profile pattern is subject to derangement. One such example is shown in Table II, wherein
TABLE I
Bacterial distribution according to depth in the soil profile (Stare, 1942)
Horizon Depth (cm)
Aerobic
bacteria Anaerobic bacteria (millions/g) Al
A2
Α2-Βχ Bx
B2
3 - 8 20- 25 35- 40 65- 75 135-145
7-8 1-8 0-47 001 0001
rABLE Π
1-95 0-38 010 0001 0001
Organic matter and bacterial distribution according to depth in a chernozem soil profile (Timonin, 1935)
Organic Aerobic Anaerobic Horizon Depth matter bacteria bacteria (cm) (%) (millions/g) Ax
A2
Bi B2
C
0- 6 6-12 12-28 28-48 48-80
804 3-18 2-41 1-76 0-80
49-2 131-8 158-3 45-3 6 0
1 0 10 100 10 0001
the bacterial maximum does not occur at the same profile depth as does the maximum value for organic matter. In some instances, such non-conforming maxima can be due to droughty conditions at the soil surface. In others, the surface horizon may simply be too acid to permit profuse bacterial develop- ment. Failure of bacteria to develop in an A horizon containing abundant energy material does not mean that other units of the soil biota, such as fungi or insects, must also fail to flourish.
In soils in which plants are growing, the organic exudates and sloughings emanating from the root surfaces provide an abundant source of energy material, and there results a profuse development of micro-organisms on or near the root surface. This phenomenon is known as the rhizosphere response.
Its study has intrigued many workers. The microbiology of the rhizosphere is
2 + S.B.
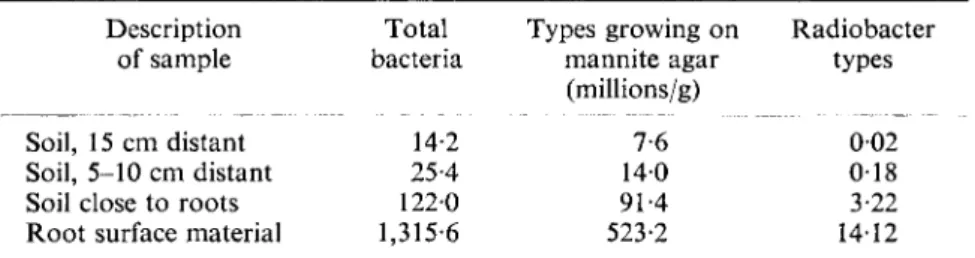
discussed by Parkinson in a later chapter. The rhizosphere is mentioned here only to emphasize that plant roots have a profound influence on the occur- rence and localization of soil bacteria. Data illustrative of the extent to which bacterial populations are increased in the immediate vicinity of plant roots are presented in Tables III and IV.
TABLE III
Influence of proximity to corn roots on abundance of bacteria (Starkey, 1931)
Description of sample
Soil, 15 cm distant Soil, 5-10 cm distant Soil close to roots Root surface material
Influence of proximity
Description of sample Soil, 10-15 cm distant Soil, 5-10 cm distant Soil, 2-5-5 cm distant Soil, 0-5-2-5 cm distant Soil, 0-0-5 cm distant Root surface scrapings
Total bacteria
14-2 25-4 1220 1,315-6
Types growing on Radiobacter mannite agar types (millions/g)
7-6 002 140 018 91-4 3-22 523-2 14-12
TABLE IV
to cotton (Clark,
Total bacteria
52-6 47-9 45-6 54-7 129-9 5100
roots on abundance of bacteria 1940)
Hundred thousands/g
Dye-tolerant Spores of of
bacteria Bacillus 7-4 170 9 0 180 7-7 170 150 100 91-3 13-7 4400 0 1
Additionally to local concentrations of bacteria in the rhizosphere, there can occur islands or foci of microbial activity in soil apart from plant roots.
Such foci vary greatly in magnitude. At one extreme is the condition that prevails when a green manure crop is plowed down. In such instance a food supply measurable in tons per acre is layered into the soil. Such layers can contain many billions of bacteria per gram of plant material, while soil but a few centimeters distant, if free of contact with the added plant parts, shows only a few millions per gram (Smith and Humfeld, 1930). On a smaller scale, foci of bacterial activity develop when individual plants or portions of them fall onto or become incorporated into the soil. Following harvest of seed cotton from a field, the writer has observed that decaying cotton carpels in
2. BACTERIA IN SOIL 25 natural microclimates at the soil surface can support bacterial populations of 20 billion/g plant material.
Other foci of bacterial development are known to be associated with the fecal droppings of insects and with dead mesofaunal and microbial tissues.
Microscopic examination of glass slides that have been buried in soil fre- quently reveals small threads or cylindrical masses of bacterial cells clustered about a disintegrating strand of fungus mycelium. Beyond this level of observation, there exists a relatively little explored area concerning the micro- distribution of bacteria in soil. Alexander and Jackson (1954) observed that soil bacteria commonly occur in the film of colloidal material coating the mineral particles in soil. Jackson et al. (1947) have published electron micro- graphs showing small masses of bacteria closely surrounded by clay particles.
Corroborative evidence that bacteria occur in small colonies in soil has been noted by Jones and Mollinson (1948). They observed that 77% of the bac- teria in soil occurred in groups of several to many cells, while the remaining 23% occurred as single cells. Minderman (1956), on the other hand, examined soil sections and concluded that the majority of the bacterial cells observed therein occurred as single cells.
Some occurrence of solitary bacteria in soil is to be expected. Individual cells must be subject to some transport within the soil by the migratory activities of the soil micro- and mesofauna. A certain amount of self-tillage occurs in soil coincidentally to gross changes in soil moisture and tempera- ture. Movement of gravitational water provides another possibility for bacterial transport in soil. According to Thornton and Gangulee (1926), motile bacteria propel themselves in the water films that exist in soil, and in so doing may achieve an effective migration rate of 1 in per day. Additionally to active motility, cell proliferation and elongation, particularly of filamen- tous bacteria, leads to some increase in the bacterial colonization of soil.
This mechanism of extension through soil becomes more effective in the presence of filamentous fungi possessing rapid growth rates. Such hyphae serve as roadways along which the bacteria follow, dining upon them en route. Finally, bacteria may be transported long distances above soil by airborne dust, by man-made machines, and by the migratory activity of large animals.
These several dispersal mechanisms have in the aggregate widely seeded bacteria throughout the soils of the world. Consequently, only rarely need soil inoculation be practised. Indeed, the population naturally present in a given habitat is almost invariably the one best adapted to exploit the habitat, and introducing one or more additional species of bacteria simply by inocu- lation is usually wasted effort. Either naturally occurring or man-induced changes in the habitat, however, are quickly followed by changes in the quali- tative nature of the soil flora, irrespective of whether or not inoculation is practised.
The cosmopolitan nature of the bacterial flora in soil attests to widespread distribution of the organisms involved, but it is uninformative as to the effi- ciency of the several dispersal mechanisms. The present-day distribution
26 F. E. CLARK
may have required thousands of years. Much more precise information is needed concerning the extent and rate at which bacteria can transport them- selves or be transported within soil.
There is evidence that bacteria do not move freely into or through the soil water. Soil is well known for its capacity to entrap the bacteria which it receives in sewage effluents. In the course of nitrification experiments in a soil perfusion apparatus, Quastel and Scholefield (1951) observed that heavy populations of nitrifying bacteria became established on the soil particles while the perfusing liquid itself remained practically free of bacteria. The writer has observed that in a soil initially free of soybean rhizobia, uninocu- lated border or buffer rows intervening between inoculated (and nodulated) rows of soybeans remained uniformly free of nodulation throughout the growing season. This was surprising, inasmuch as at the time the soybeans were about 4 in high, the farm operator, faced with a heavy work schedule, turned in excessive heads of irrigation water and achieved a basin or flood irrigation, rather than a furrow irrigation along the rows. In the course of a single growing season, neither such flooding, nor any combination of dis- persal mechanisms, sufficed to cause movement of rhizobia between nearly contiguous rhizospheres.
VII. M O I S T U R E R E Q U I R E M E N T S
The role of moisture in relation to microbial activity in soil has been studied extensively, possibly more so than has the influence of any other environ- mental factor. Notwithstanding such effort, there remain many gaps in knowledge concerning the soil water in terms of its interactions with other physical or biotic factors. Many of these gaps concern wet or extremely wet soils, in which the problem is really not one of moisture in itself, but of the severe restrictions imposed on aeration in wet soils.
Much of the earlier work on soil moisture in relation to bacterial activity is difficult to interpret. Moisture contents were expressed gravimetrically and without regard to the energy concept, in which soil moisture is expressed in terms of the physical force with which it is held in soil rather than in terms of actual percentage content. In some work, there was failure to insure a con- stant moisture content throughout an experimental period or to effect a uni- form distribution of moisture throughout the experimental sample. In other work, data accumulated are informative only for the given experimental conditions. The rather widely quoted work of Bhaumik and Clark (1948), for example, is informative for soils maintained in a shallow layer of 12 mm and subjected to a rapidly moving air stream across the soil surface. What happens at the same moisture tensions in the field at a depth of 100 mm can hardly be extrapolated from such laboratory data.
The most satisfactory information on the moisture relationships of bac- teria in soil is that which exists for the dry end of the moisture scale. Here the problem becomes simplified to definitions of the levels at which various bac- teria can no longer hold water within their cells in amounts sufficient for their
27 metabolism. At moisture tensions of 3 atmospheres or higher, bacterial activity in soil becomes reduced, and very markedly so at the 15 atmosphere, or permanent wilting percentage, moisture content. Inasmuch as bacteria differ in the extent to which they are active in droughty soil, not all bacterial transformations are uniformly curtailed during drying out of soil. Ammoni- fication, for example, can proceed under more stringent drought than can nitrification. The latter, although it occurs slowly in soil at the permanent wilting percentage, does not occur in soil of lower moisture content. Am- monification has been observed to occur in soil with moisture content at one-half the wilting percentage (Robinson, 1957).
Degradation of organic residues can occur at moisture contents below that of the permanent wilting percentage. Bartholomew and Norman (1947) observed that the threshold moisture content for decomposition of many plant residues is approximately that of 80% relative humidity. Possibly the observed decompositions were initiated by fungi rather than by bacteria.
From the practical standpoint, it must be emphasized that low moisture contents are generally limiting to microbial activity. As the moisture content drops to or below the wilting percentage, decomposition processes slow almost to a standstill. At 81% relative humidity, the rate of decomposition of oat straw was measured as less than 1% of that at the optimum moisture con- tent (Table V).
It is probable that at least some soils, even when in an air-dry condition, permit a very low level of respiratory activity. Negligible but nevertheless measurable production of C02 has been observed by the writer for a soil containing 4-8% organic matter and holding 3% moisture following air- drying in the laboratory. The rate of C 02 production was of the order of 0Ό001 mg C02/g of air-dry soil per day. In the same study, several other soils containing approximately 1% organic matter and holding approximately 1%
moisture in the air-dry state showed no measurable production of C02 during 2 weeks of incubation.
TABLE v
Carbon dioxide evolution from oat straw under differing moisture conditions (Bartholomew and Norman, 1947)
% Moisture in oat straw
250 150 60 36 24 19 16
Moisture tension (atmospheres)*
113 40 206 289
Relative humidity saturation saturation saturation
97-1%
92-0%
85-9%
80-8%
co
2straw, evolved/g of , mg in 144 hr
152 139 79 40 16 4 1
* Values in this column calculated by the writer; not shown in the initial publication.
28
There occurs a marked reduction in the number of bacteria in soil as it undergoes drying. Certain bacterial species are commonly believed more resistant to drying than are others, and that consequently, sporulating and other drought-resistant bacteria constitute the bulk of the remaining viable population. This point of view is an over-simplification. All of the soil bac- teria are quite resistant to drying. Seldom are individual species entirely eliminated from soils that are stored in an air-dry condition. When such soils are re-wetted, such varied phenomena as nitrification, ammonification, non- symbiotic nitrogen fixation and sulfur oxidation almost invariably proceed without any soil reinoculation whatsoever being required. Calder (1957) noted that the nitrate productivity of dry soil stored for 3 years was almost unimpaired. Sen and Sen (1956) encountered two soils in which Rhizobium japonicum survived for 19 years during storage of the soils in an air-dry con-
dition. The writer has noted survival of Azotobacter in soil stored air-dry in the laboratory for 30 years.
These citations should not lead the reader to assume that specific bacteria are never entirely eliminated from soil as it undergoes drying. Workers engaged in nitrification studies and making use of stored dry soil at times find that some soils, or possibly only a single replicate of several small lots taken from a larger gross lot, do fail to show nitrification when properly moistened and incubated. Occasionally rhizobia may also fail to withstand soil drying.
In some field soils cropped to annual legumes, especially if such soils are poorly buffered and subjected to severe drought during the non-growing season, there may be insufficient carryover of viable rhizobia to effect nodu- lation of the newly planted crop. Consequently, inoculation of the legume seed with rhizobia must be undertaken annually at time of planting.
When a soil is dried rapidly, it is not uncommon to note that such widely differing subgroups as spores of aerobic bacilli, nitrifying bacteria, denitri- fying bacteria, and aerogenic bacteria respond uniformly with decrease in the total count. The decrease in the viable count is not linked to unilateral survival of sporulating bacilli.
For many soils, the decrease in bacterial numbers during drying is more apparent than real, and hinges on some physical entrapment or clumping effect, rather than on any true lethality. If, following drying, special mechanical or chemical dispersing treatments are applied to the dry soils prior to making plate counts thereon, the viable counts in the several soils are then higher, with magnitude of the increase differing in different soils, than counts obtained on aliquots of the same dry soils not given dispersing treat- ment prior to plating. Differences in physical entrapment effects among soils during drying can be expected to occur. Such differences may help to explain why different soils show widely varying decreases in total counts during drying.
VIII. A E R A T I O N R E Q U I R E M E N T
Wet soils are unfavorable for most bacteria simply because filling up of pore space with water diminishes soil aeration. The restrictive factor is lack
2. BACTERIA IN SOIL 29 of oxygen and not the excess water in itself. At first glance it appears that soils with moisture content at or lower than field capacity could be expected to furnish oxygen to bacteria at a rate adequate to meet their biochemical oxygen demand. Seldom do field measurements of oxygen in the soil atmos- phere reveal the presence of less than 10% oxygen; for most well-drained soils, the measurement usually is of the order of 20% (Russell, 1950). During wet periods and for heavy soils (Boynton and Compton, 1944; Vine et al.,
1942) or following heavy irrigation (Kemper and Ameniya, 1957), oxygen contents of 3% or below have been measured. These values represent oxygen contents measured in a large soil volume and may be an over-estimate of the oxygen content in some of the smaller and less accessible pores. The amount of oxygen present in a soil microsite at any given time is a function of the biochemical oxygen demand of soil organisms (and plant roots if present) and of the rate of oxygen movement into the soil atmosphere and into and through the water barriers in soil.
Movement of oxygen into the larger pores of the soil atmosphere occurs readily by gaseous diffusion. The oxygen pressure difference necessary to cause adequate movement through air-filled pores need equal only 1-4%
oxygen. Bacteria in the soil, however, are surrounded by water films, and rate of oxygen diffusion through water is only about one ten-thousandth as fast as the rate through air. Consequently, water barriers to oxygen movement at times become limiting for bacterial respiration.
On a gross scale, such barriers can be established at the soil surface either by heavy rains or by irrigation practices. In the event that a water seal is thus established at the soil surface, the amount of oxygen in the soil atmo- sphere does not provide an inexhaustible reservoir for soil organisms. Its disappearance depends on the rate of oxygen use by soil organisms and plant roots and on the amount of oxygen initially entrapped. This amount is determined by the depth of the water table, the fraction of the soil volume occupied by air, and the initial oxygen content of the entrapped air. In many soils the entrapped oxygen is sufficient to supply the biochemical oxygen demand from several days to a week.
A much more difficult problem is that posed by the water barriers that occur in and around individual soil pores and bacteria and the extent to which these barriers can limit movement of oxygen to bacterial cells. One can be reason- ably certain that these barriers are of little or no consequence at the moisture content of the permanent wilting percentage, inasmuch as at such content only soil pores having radii of 1 μ or less remain water-filled. With moisture content at field capacity, however, pores with radii as large as 3-4 μ become water-filled. Combinations of such pores, without intervening larger pores, may lead to conditions of inadequate aeration. Short of waterlogged condi- tions, however, it is difficult to postulate any idealized geometry on which to base calculations of rate of oxygen movement into and rates of consumption within soil micropores. Such calculations have been made for root segments surrounded by rhizosphere bacteria and soil-water barriers. Using experi- mentally measured rates of oxygen consumption and basing calculations on
the logarithmic relation between diffusion coefficient and film thickness, Clark and Kemper (1966) concluded that critical oxygen levels could occur within the internal root cells when the water or water mucigel barrier imme- diately surrounding the root reaches thicknesses of 0-1-0-5 mm.
In many soils, it is highly probable that microsites of anaerobiosis occur in greater profusion in the plow layer than in the subsoil. Well-drained soils with droughty surfaces normally can be expected to be rather fully aerated throughout the entire profile. With either sufficient precipitation or irrigation to effect a temporary water seal at the soil surface, the plow layer loses its oxygen much more rapidly than does the deeper profile, simply because the greater number of micro-organisms, and thus the greater biochemical oxygen demand, occurs in the topsoil. In such instances, the subsoil is better aerated than is the topsoil.
The observed distribution of anaerobic bacilli throughout the soil profile suggests that oxygen-deficient sites must occur in the plow layer of field soils.
The data in Table I show that anaerobic bacteria were found most numerous, both relatively and absolutely, in the upper profile. In the Αχ horizon, they constituted 25% of the total count for aerobic bacteria, and in the next three and successively deeper horizons, 21, 21, and 10%, respectively. Whether the anaerobes proliferate during the times when temporary water-seals develop at the soil surface or whether they proliferate on a more or less continuing basis within microsites whose oxygen is consumed by aerobic bacteria is not currently known.
It is well known that nitrates are produced in the plow layer of field soils and accumulate therein unless taken out by plants or by leaching. The oxygen level required for nitrification is distinctly higher than that tolerated by obligate anaerobes. That both nitrifying and anaerobic bacteria develop in the plow layer suggests either that microsites of aerobiosis and anaerobiosis exist contemporaneously, or else that some sites fluctuate between aerobiosis and anaerobiosis under changing soil conditions.
Workers attempting to define the optimum soil atmosphere for either microbial transformations or microbial species have commonly placed major if not sole emphasis on the factor of oxygen content. The fluctuations that occur in the carbon dioxide content are also deserving of attention. Either unusually high or low carbon dioxide concentrations in the soil atmosphere at times are limiting for bacterial activity. Much of the work determining tolerances of soil organisms to high concentrations of carbon dioxide has been with the soil fungi rather than with the soil bacteria. Studies on threshold and optimal levels of C02 more frequently have been concerned with a few pathogenic bacteria rather than with the soil bacteria. Some information, however, has been developed concerning the C 02 requirements of the nitri- fying bacteria.
In the course of numerous studies by various workers on nitrification in soil, it has been recognized that incubation of soil samples with too shallow a layer of soil or with too small a quantity of soil in the incubation container, or with too vigorous aeration of the incubating soil, adversely affects the rate
2. BACTERIA IN SOIL 31 of nitrification (Harmsen and van Schreven, 1955). Recent work indicates that the oxygen contents that exist under such differing conditions of incu- bation are not critical, but that build-up of soil carbon dioxide to a value above the normal atmospheric level is needed in order to secure an optimum rate of nitrification (Beard and Clark, 1962). Incubation techniques that favored rapid escape from soil of the respiratory carbon dioxide depressed rate of nitrification, and experimental removal of C 02 from the soil atmos- phere almost completely inhibited nitrification. These effects of C 02 con- centration could be observed at normal or near normal atmospheric oxygen levels. Oxygen itself became limiting only when its concentration by volume in the enclosed atmosphere fell to 10% or less. Nitrification rates in soils whose atmospheres contained concentrations of oxygen in the range of 10-20% by volume did not differ significantly. C02 content necessary for rapid nitrification fell within the range of 0-5-5-0% by volume.
Until more is known of the gaseous environment confronting the soil bacteria, one must be content with the generalization that soil moisture contents within the range of 50 - 80% of moisture-holding capacity appear compatible with good soil aeration. At least in soils of such wetness, there occurs a combination of moisture and aeration that favors the activities of most of the heterotrophic bacteria in soil.
IX. R E A C T I O N A N D T E M P E R A T U R E R E Q U I R E M E N T S The reaction range commonly tolerated by soil bacteria is that between pH 4 and pH 10. The optimum within this range is slightly on the alkaline side of neutrality. Some bacteria are readily limited by acidity or alkalinity while others show wide tolerances to extremes in reaction. Such differences exist even within a single genus. Azotobacter chroococcum, for example, is widely distributed in neutral and alkaline soils but is not found in soils below about pH 6. A. indiens, in contrast, tolerates an acidity of pH 3.
Thiobacillus thiooxidans, an autotroph capable of oxidizing elemental sulfur, tolerates an acidity of ph 0-6. It is reported to be the most acid tolerant of any living organism (Breed et al., 1957).
As a group, the soil bacteria are less well adapted or less competitive for food supplies in distinctly acid soils than are the soil fungi. This is particularly evident in the microflora of forest and heath soils. In soils strongly acid in the surface profile, fungi are dominant, and even if the fungi are restricted experimentally by the addition of a fungicide, the pH alone suffices to restrict any vigorous colonization of the habitat by bacteria.
The optimum temperature range for soil bacteria is from about 25°-35°c.
A great many grow quite well over the range of 10°-40°c. In the field, high soil temperatures are seldom if ever the primary factor limiting bacterial growth. Unusually high temperatures occur only at or near the surface in dry and barren soils. In such sites, lack of water is the primary factor limiting microbial growth. In moist tropical soils in which plants are growing, the soil temperature in the root zone is usually either optimal or suboptimal for
2*
bacteria. Some arable soils, if row-cropped, clean-tilled, and not shaded by the growing crop, at times slightly surpass the optimum temperature for soil bacteria. Temperatures of this magnitude may be harmful to plant roots and therefore of economic importance. Their occurrence is usually avoided by corrective or alternative methods of land management.
On a limited scale, temperatures above the optimum for bacteria occur in soils or waters under the influence of thermal hot springs or volcanic activity.
Stored hay and grain, if not sufficiently dry to inhibit microbial activity, may yield sufficient heat during spoilage to be inimical to many species of bacteria and even to cause spontaneous combustion in the stored material itself. Small islands of plant residues in soils, or layers of such residues that are plowed under, show measurable but inconsequential microbial thermogenesis (Clark et öf/., 1962). Such temperature elevations are very transitory and do not exceed about l°c.
In other tropical soils, temperatures below the optimum range for bacteria occur seasonally, and at time of occurrence are limiting to bacterial activity.
The principal effect of seasonably low soil temperatures is simply to postpone microbial activity until a later date. Such postponement may have great economic importance in a cold, wet spring insofar as nutrient availability to a growing crop is concerned.
An extensive literature on the influence of temperature on diverse microbial transformations in soil has been reviewed by Richards et al (1952), and their discussion will not be duplicated here.
X. BIOTIC L I M I T A T I O N S ON B A C T E R I A L ACTIVITY Emphasis in the preceding paragraphs has been on the extent to which the available food supply and physical factors in the environment determine bacterial activity in soil. Discussion of these factors severally or jointly fails to tell the full story, inasmuch as soil micro-organisms themselves exhibit pronounced effects upon one another. In some instances the biotic relation- ships may be beneficial to one or more organisms, but more often than not, mixed colonization of a substrate leads to restricted development of one or more of the species involved. Norman (1947) has characterized the soil popu- lation as one nutritionally fiercely competitive within itself. The extent to which the antibiotic and inhibiting substances are limiting to microbial acti- vity in soil is discussed by Park in a later chapter.
The proposition that many of the microbial species present in a soil at any given time are in a resting or dormant condition has been put forward above. The competitive or ecological significance of such resting cells must be quite analogous to that of ungerminated but viable seeds in a plant com- munity. Furthermore, among the active microbial species in soil, food special- izations make possible the co-existence of a large number of ecological niches within any given habitat. In the rhizoplane, for example, with its wide assort- ment of materials exuded or sloughed from the root, it is probable that many
of the microbial species simultaneously present on the root surface are sub- sisting on different materials. The organisms occupy separate ecological niches and therefore are not in actual competition. Finally, any given sub- strate or microhabitat undergoes sequential changes with time, either because of fluctuations in the physical environment, or because of the activities of other micro-organisms. Such a substrate therefore presents a succession of ecological niches.
A simple illustration of one such succession can be seen in the nitrification cycle. Ammonia is oxidized to nitrite by the genus Nitrosomonas, and the nitrite to nitrate, by the genus Nitrobacter. Much more complex successions occur in the decomposition cycles of the organic residues that reach the soil.
Many of these cycles have not yet been adequately studied. Recently, Kendrick and Burges (1962) have described the patterns of fungal specificity and suc- cession that occur in decaying pine needles. Only by such studies, together with delimitation of the specific factors and mechanisms which enable one or another species to be found where it is found in soil, will the soil micro- biologist be able to replace the redundancy in "this micro-organism is dominant in this microsite because it is the successful competitor" with a more meaningful conception of the role of competition in soil biology.
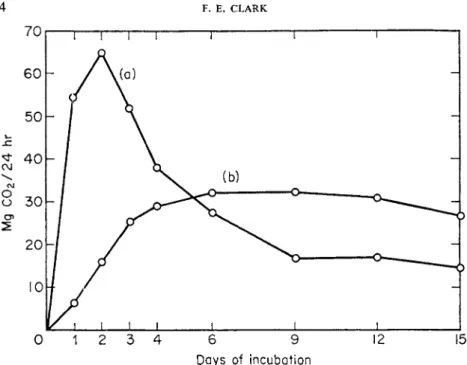
XI. P A T T E R N S IN M I C R O B I A L T R A N S F O R M A T I O N S The many interactions of food supply with physical and biotic factors make each soil habitat, large or small, almost unique. At the same time, in the continual flux of microbial activity, some response patterns occur with such sufficient regularity that they are worthy of brief characterization. A few such response patterns are discussed in terms of C02 production, the parameter usually considered as the most informative concerning the course of organic matter decomposition in soil. When appropriate, some attention will be given to nitrification or other data. There is no implication that the few curves presented are all-inclusive for patterns of microbial activity, nor that any specific data, other than that given, will identify itself with any one curve. The rate curves shown, however, represent actual data taken from the literature, and are not constructed as idealized diagrams.
The principal food materials reaching the soil are plant and animal resi- dues or excreta. These are almost continually added, and upon initial addition, contain soluble and easily available energy materials. The addition of such food materials to soil elicits therein the "microbial explosion" of which my former teacher Charles Thorn so dearly loved to speak. Such explosions are characterized by a sudden onset of decomposition, the rise of the rate curve to a sharp peak within a day or so, and rapid subsidence of respiratory acti- vity in the immediately following days, simply because the easily available food supply has been exhausted. Such decomposition curves are shown as the
" A " curves in Figs 1 and 2.
Such data as are shown in Figs 1 and 2 represent total microbial respiratory
F. E. CLARK
6 9 Days of incubation
FIG. 1. Effect of two differing moisture tensions on the respiratory pattern in soil amended with 1% corn stover (Bhaumik and Clark, 1948).
(a) At 50 cm moisture tension ; (b) at 0-0 cm moisture tension.
C\J
o I
o o u u
60
20
80
4 0
" I
:
_ - |
-
— i r
1 1
1 1 r
S>—Q(b)
9 h 1
1 l
—H
H
1
-J
-^
16 Days
20 24 28 32 FIG. 2. Effect of additional nitrogen on the respiratory pattern in soil amended with 1 %
glucose (Stotzky and Norman, 1961).
(a) 1% glucose plus 0-15% nitrogen; (b) 1% glucose.
2 . BACTERIA IN SOIL 35 activity, and it is probable that much of the respiratory activity is by the soil fungi. However, it safely can be assumed that soil bacteria are also involved in the initial or explosive stage of decomposition of the added organic materials.
Burges (1939) and Garrett (1956) have characterized the particular soil fungi involved in the early or rapid phase of decomposition as the "sugar fungi."
Although their terminology might equally well be applied to the bacteria, the writer prefers not to speak of the "sugar bacteria." Nor for reasons to be dis- cussed shortly does he concur in the designation of these rapidly responding bacteria as "zymogenous bacteria." Acceptance of the zymogenous and autochthonous classification of the soil bacteria as proposed by Winogradsky (1925) implies a rigidity of classification that does not exist. Bacteria that are zymogenous under one set of conditions may well be non-zymogenous under another set. It does, however, appear logical to speak of the explosive or peak activity that almost immediately follows the addition of fresh residues as the zymogenous response.
Under the influence of any one or more of a number of factors, the initial explosive activity or zymogenous response may be variously modified. Fre- quently, as some factor becomes limiting to decomposition, the ascending curve of respiratory activity breaks off to a horizontal plateau. With time, this limited activity accomplishes depletion of the food supply, and the respiratory curve drops off thereafter in much the same fashion as if the delaying factor had not intervened. Delayed or truncated patterns of zymo- genous réponse are shown as the (b) curves in Figs 1 and 2. In Fig. 1, lack of adequate aeration due to excess moisture is the limiting factor; in Fig. 2, lack of essential mineral nutrient is responsible for the truncation.
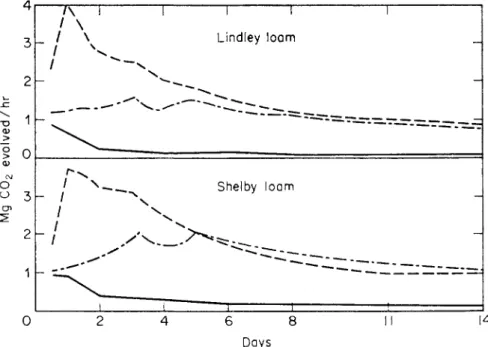
Many organic residues that normally reach the soil contain, in addition to easily soluble and available components, others that are relatively resistant to decomposition. In plant residues, lignins and waxes commonly occur as such resistant material. They are responsible for the long-continued and rela- tively constant output of respiratory carbon dioxide following the transitory and explosive zymogenous response. The extent to which the water-soluble and non-water-soluble materials in corn stover contribute to the zymogenous and the residual patterns of response has been nicely demonstrated by Newman and Norman (1943). Their data are reproduced in Fig. 3. The water- extractables are responsible for the zymogenous peaks obtained on the first day, but after about 5 days their influence has been almost entirely dissi- pated, as shown by the coincidence of the respiratory curves for extracted and whole stover between the fifth and fourteenth days of incubation.
Some microbial transformations in soil show a lag pattern of response, or more descriptively, the growth curve pattern of response. This response is associated with the addition to a given soil of materials which are not com- monly or frequently added thereto, or else if commonly added, only a few specialists in the soil population are capable of effecting their oxidation or hydrolysis. This pattern is characterized not only by a slow onset of microbial activity, corresponding to the lag phase of the well-known microbial growth curve for a population seeded into a fresh substrate, but also by the fact that
36 F. E. CLARK
this lag or slow onset can be greatly foreshortened by pretreatment or baiting of the soil with the specific material.
A representative lag curve is obtained when a material such as a chlori- nated organic pesticide is first added to a soil. Its decomposition occurs slowly. A second addition made shortly following the first addition is decom- posed within a much shorter interval of time. Such a small first addition as one part per million of 2,4-D in soil suffices to increase the rate of decom- position of a second dose.
\ 1
o u 3 Έ en
2
l\ I _ / \ / \
/
/ V
! -^
Γ^
h / / I / Γ /
φ^
φ*^
I
I
^Ns^--^
/ ' ^ -
P
I Lindley
"** *». ,^
~ - ^ - Ξ . :
Shelby
s.
. ^ • ^ - -
""^-«c "
I
—r
loam
" " - ^ ■ - =:
loam
—— » ___
I
I
=^r"-'=-T^=---=-^^r.-=.-=-
""""■ *—~ —— ^ . ~ ~~""" —— ■
I
H
-=v=rd
-J
—'
1 - ~ = L :
0 2 4 6 8 M I4 Days
FIG. 3. Respiratory patterns in soils amended with extracted and whole corn stover (Newman and Norman, 1943).
Dashed line, soil and cornstalks; chain-dotted line, soil and water-extracted cornstalks;
full line, soil alone.
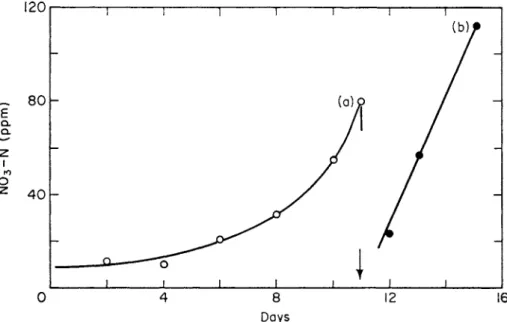
A lag curve of response also is commonly observed when nitrifiable nitro- gen is added to soil. A typical lag curve for nitrification in soil is shown in Fig. 4. The slow onset of nitrification is not due to any lack of nitrifiable nitrogen—indeed, the early part of the lag curve is entirely independent of the amount of nitrifiable nitrogen initially added.
The lag curve for nitrification in a laboratory soil perfusion apparatus is shown in Fig. 5. Additionally in this figure, there is shown the nitrification curve for ammonia added immediately following the completion of nitri- fication of a preceding addition.
E
Q. Q.
1 ro 1
o
<L\J\J
160
l?0
80
4 0
r
"~
-
—
"
— i —
x,
^ r~
s\
J
~T
/
_L
" 1 1 1 1 1 1 1 1 1 1 I' J^l 1— 1
,y ^ --J
-x - ^ \
<
y'" 1
/ s' \
s' '' 1
> ί ^ ^ 1
^ ^ -Η
... 1 ί J I I I 1 I 1 I 1 - I I
12 16 20 24 Days
28 32 36
FIG. 4. Typical nitrification curves following additions of nitrifiable nitrogen to soil (Parker and Larson, 1962).
Chain dotted line, 150 ppm NH4—N; dashed line, 100 ppm NH4—N; full line, no nitrogen added.
Days
FIG. 5. Nitrification curves obtained during an initial and a second perfusion of soil with nitrifiable nitrogen (Quastel and Scholefield, 1951).
(a) Initial perfusion; (b) second perfusion of same soil.
38 F. E. CLARK
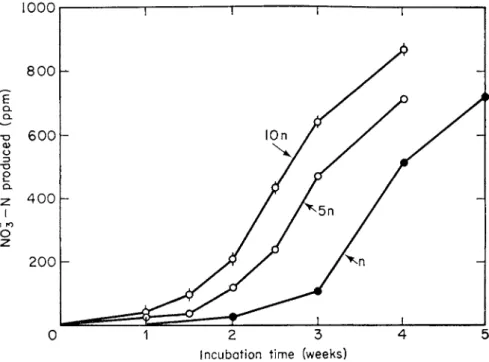
The extent to which increasing the population level of the nitrifying bac- teria shortens the lag portion of the nitrification curve is shown in Fig. 6.
In the lag response pattern, the responding bacteria must be considered normally to occur in soil at a low population level. The species involved are sufficiently slow growing that typically a week or more is required for them to reach any sizable population level even in the presence of ample energy material. Lees (1954) has commented on the slowness with which autotrophic bacteria such as the nitrifiers synthesize their cellular material.
E QL Q.
■σ α>
o o
I I fO
o 2 8 0 0
6 0 0
4 0 0
200
1 i
ΙΟη Α
/ /
i r—
^ 5 n /
An
I 1 -^
/ A
A
A
2 3 Incubation time (weeks)
FIG. 6. Influence of initial population of nitrifying organisms on the nitrification pattern in soil (Sabey et al, 1959).
n = 1 ml of inoculum of nitrifiers.
That slowly-growing bacteria participate in many transformations in the soil carries the implication that these forms are not faced with any appreciable competition for the substrate on which they subsist. Sugars, on the other hand, are susceptible to attack by a wide variety of heterotrophic organisms, and rapidity of response is mandatory for an organism if it is to compete successfully for a share of the added substrate. Another factor not to be overlooked is the frequency with which fresh residues reach the soil. As a consequence of this continued baiting, a microflora capable of zymogenous response is ever present in the average topsoil,