Securities on Capital Markets
Reader
Prepared by
Andreász KOSZTOPULOSZ, PhD
2019.
Methodological expert:
Edit GYÁFRÁS
Preface
The purpose of the course is to provide a comprehensive overview of the bond market and its role in the financial system at bachelor level and to introduce how bond prices are set in accordance with market interest rates and why bond prices change with those rates. This reader is based on renowned textbooks on investing such as Bodie, Kane and Marcus’ „Investments”, Smart, Gitman and Joehnk’s „Fundamentals of Investing” and Fabozzi’s „The handbook of fixed income securities”. It is designed to follow the structure of the course and to make a contribution to mastering professional competencies
of the students. This reader presents a theoretical framework used to address issues in investment valuation and risk management. It provides the students with the tools required for further studies in financial investment valuation. Each chapter is followed by a set of basic questions on both numerical and conceptual topics mainly excerpted from the referred textbooks.
This reader includes sample tests and exams also.
2019.01.03.
Lecturer: Andreász KOSZTOPULOSZ
This teaching material has been made at the University of Szeged, and supported by the European Union. Project identity number: EFOP-3.4.3-162016-0001
Contents
Course Information ……….4
Part 1: The Investment Environment……….8
Part 2: Markets for Debt Securities or Fixed-Income Market ………23
Part 3: Investing in Bonds I.: the Return of the Investment ………...31
Part 4: Investing in Bonds II.: the Risk of the Investment ....………39
Part 5: Bond’s Duration and Managing Interest Rate Risk ……….……..49
Sample Tests and Solutions ……….……….55
References ………61
Course information
Course title: SECURITIES ON CAPITAL MARKETS Course code:
60C109 Lecture Credit: 3 Type: lecture
Contact hours / week: 2
Evaluation: exam mark (five-grade) Semester: 5th
Prerequisite course: Introduction to Finance
Learning Outcomes
a) regarding knowledge, the student
- has a clear idea of the basic characteristics of the bond market and its role in the financial system
- is familiar with the concept of time value of money - understands the relationship between risk and return
- is familiar with the basics of the investment valuation and risk management
- is familiar with the concepts and methods of controlling, organising and performing investment and financing processes along with the methodology of analysing said processes, preparing and supporting decisions;
-has a good command of the basic linguistic terms used in the field of investments b) regarding competencies, the student
- is capable of calculating the financial consequences of economic processes and organisational events;
- can employ problem solving techniques in the preparation of investment decisions with regard to their application requirements and limits;
- can cooperate with the financial managers of the firm and with the investors;
c) regarding attitude, the student
- behaves in a proactive, problem oriented way to facilitate quality work. As part of a project or group work the student is constructive, cooperative and initiative.
- is open to new information, new professional knowledge and new methodologies. The student is also open to take on task demanding responsibility in connection with both solitary and cooperative tasks. The student strives to expand his/her knowledge and to develop his/her work relationships in cooperation with his/her colleagues.
- is sensitive to the changes occuring to the wider economic and social circumstances of his/her job, workplace or enterprise. The student tries to follow and understand these changes.
- is accepting of the opinions of others.
d) regarding autonomy, the student
- prepares and presents tasks and projects related to financial decisions independently or under general professional supervision
- conducts the tasks defined in his/her job description;
- takes responsibility for his/her analyses, conclusions and decisions.
Requirements
There are 2 tests in the study period. At the end of the semester a grade based upon the tests will be proposed (if you accept it, you do not have to write the exam in the examination period). Opportunity to retake the mid-term test: once at the end of the semester. 51% of the points have to be collected in order to pass.
Exam: written test in the examination period. 51% of the points have to be collected in order to pass and at least 90% for the excellent grade. Numerical calculator as well as annuity and discount tables can be used at the exam and the tests.
Class attendance is not compulsory but recommended as well as continuous (weekly) learning and practicing during the semester.
Grading
• 0-50%: fail
• 51-65%: pass
• 66-79%: satisfactory
• 80-89%: good
• 90-100%: excellent
Course topics
This course provides a comprehensive overview of the most important topics in Investments and Security Markets at bachelor level and consists of three main parts. In the first part we introduce the important institutional material focusing on the financial environment. We discuss the major players in the financial markets, provide an overview of the types of securities traded in those markets, and explain how and where securities are traded.
In the second part we turn to specific analyses of a particular security market: the fixed- income security market. These securities have the advantage of being relatively easy to understand because the payment formulas are specified in advance. Risk considerations are minimal as long as the issuer of the security is sufficiently creditworthy. That makes these securities a convenient starting point for the investment analysis. We turn next to bond pricing, showing how bond prices are set in accordance with market interest rates and why bond prices change with those rates. We examine valuation principles, determinants of risk and return considering the impact of default or credit risk on bond pricing and looking at the determinants of credit risk and the default premium built into bond yields.
Because interest rate risk is crucial to formulating investment strategies in the fixed-income security market, in the third part we begin our discussion with an analysis of the sensitivity of bond prices to interest rate fluctuations. This sensitivity is measured by the duration of the bond, and we devote considerable attention to what determines bond duration. We discuss several passive investment strategies, and show how duration-matching techniques can be used to immunize the holding-period return of a portfolio from interest rate risk.
The students will acquire knowledge about the concept of present value, how investment opportunities are valued in financial markets, the basic measures of risk and methods for incorporating risk in valuation. The skills acquired during the course include applying various techniques for calculating the risk and return of investments. The course will help the students to ask the right questions when times change and new problems need to be analyzed. It also tells them which things
they do not need to worry about. The course shows how investors use financial theory to solve practical problems in the field of investments leading the students to be devoted to performing high quality work with responsibility.
Part 1: The Investment Environment
Learning outcome of the topic:
This chapter provides a broad overview of the investment environment. We begin by examining the differences between financial assets and real assets. We proceed to a discussion of the many roles of financial markets in the economy. We then turn to the three broad sectors of the financial environment: households, businesses, and the government. Students will learn the essentials of some specific types of transactions, such as buying on margin and short-selling stocks.
Investment Environtment
An investment is the current commitment of money or other resources in the expectation of earning future benefits.
Real assets v. financial assets (Bodie et al. 2012)
The material wealth of a society is ultimately determined by the productive capacity of its economy, that is, the goods and services its members can create. This capacity is a function of the real assets of the economy: the land, buildings, machines and knowledge that can be used to produce goods and services.
In contrast to real assets are financial assets such as stocks and bonds. Such securities are no more than sheets of paper or, more likely, computer entries, and they do not contribute directly to the productive capacity of the economy. Instead, these assets are the means by which individuals in well-developed economies hold their claims on real assets.
Financial assets are claims to the income generated by real assets (or claims on income from the government). If we cannot own our own auto plant (a real asset), we can still buy shares in Ford or Toyota (financial assets) and thereby share in the income derived from the production of automobiles.
While real assets generate net income to the economy, financial assets simply define the allocation of income or wealth among investors. Individuals can choose between consuming their wealth today or investing for the future. If they choose to invest, they may place their wealth in financial assets by purchasing various securities. When investors buy these securities from companies, the firms use the money so raised to pay for real assets, such as plant, equipment, technology, or inventory. So investors’ returns on securities ultimately come from the income produced by the real assets that were financed by the issuance of those securities.
We will focus almost exclusively on financial assets. But you shouldn’t lose sight of the fact that the successes or failures of the financial assets we choose to purchase ultimately depend on the performance of the
underlying real assets.
Financial Assets
It is common to distinguish among three broad types of financial assets: fixed income, equity, and derivatives (Bodie et al. 2012).
Fixed-income or debt securities promise either a fixed stream of income or a stream of income determined by a specified formula. For example, a corporate bond typically would promise that the bondholder will receive a fixed amount of interest each year. Other so- called floating-rate bonds promise payments that depend on current interest rates. Unless the borrower is declared bankrupt, the payments on these securities are either fixed or determined by formula. For this reason, the investment performance of debt securities typically is least closely tied to the financial condition of the issuer.
Unlike debt securities, common stock, or equity, in a firm represents an ownership share in the corporation. Equityholders are not promised any particular payment. They receive any dividends the firm may pay and have prorated ownership in the real assets of the firm. If the firm is successful, the value of equity will increase; if not, it will decrease. The performance of equity investments, therefore, is tied directly to the success of the firm and its real assets.
For this reason, equity investments tend to be riskier than investments in debt securities.
Derivative securities are so named because their values derive from the prices of other assets. For example, the value of the call option will depend on the price of Intel stock. Other important derivative securities are futures and swap contracts.
In addition to these financial assets, individuals might invest directly in some real assets. For example, real estate or commodities such as precious metals or agricultural products are real assets that might form part of an investment portfolio.
Financial Markets and the Economy
Financial assets and the markets in which they trade play several crucial roles in developed economies. Financial assets allow us to make the most of the economy’s real assets.
The main roles of financial markets are (Bodie et al. 2012):
The Informational Role
Consumption Timing
Allocation of Risk
Separation of Ownership and Management The Informational Role of Financial Markets
Financial markets play a central role in the allocation of capital resources. Investors in the stock market ultimately decide which companies will live and which will die.
If a corporation seems to have good prospects for future profitability, investors will bid up its stock price. The company’s management will find it easy to issue new shares or borrow funds to finance research and development, build new production facilities, and expand its operations. If, on the other hand, a company’s prospects seem poor, investors will bid down its stock price. The company will have to downsize and may eventually disappear.
The process by which capital is allocated through the stock market sometimes seems wasteful. Some companies can be “hot” for a short period of time, attract a large flow of investor capital, and then fail after only a few years. But that is an unavoidable implication of uncertainty. No one knows with certainty which ventures will succeed and which will fail. But the stock market encourages allocation of capital to those firms that appear at the time to have the best prospects. Many smart, well-trained, and well-paid professionals analyze the prospects of firms whose shares trade on the stock market. Stock prices reflect their collective judgment.
Consumption Timing
Some individuals in an economy are earning more than they currently wish to spend. Others, for example, retirees, spend more than they currently earn.
How can you shift your purchasing power from high-earnings periods to low-
earnings periods of life? One way is to “store” your wealth in financial assets. In high- earnings periods, you can invest your savings in financial assets such as stocks and bonds. In low-earnings periods, you can sell these assets to provide funds for your consumption needs.
By so doing, you can “shift” your consumption over the course of your lifetime, thereby allocating your consumption to periods that provide the greatest satisfaction.
Allocation of Risk
Virtually all real assets involve some risk. When Ford builds its auto plants, for example, it cannot know for sure what cash flows those plants will generate. Financial markets and the diverse financial instruments traded in those markets allow investors with the greatest taste for risk to bear that risk, while other, less risk-tolerant individuals can, to a greater extent, stay on the sidelines. For example, if Ford raises the funds to build its auto plant by selling both stocks and bonds to the public, the more optimistic or risk-tolerant investors can buy shares of its stock, while the more conservative ones can buy its bonds. Because the bonds promise to provide a fixed payment, the stockholders bear most of the business risk but reap potentially higher rewards. Thus, capital markets allow the risk that is inherent to all investments to be borne by the investors most willing to bear that risk.
This allocation of risk also benefits the firms that need to raise capital to finance their investments. When investors are able to select security types with the risk-return characteristics that best suit their preferences, each security can be sold for the best possible price. This facilitates the process of building the economy’s stock of real assets.
Separation of Ownership and Management
Many businesses are owned and managed by the same individual. This simple organization is well suited to small businesses and, in fact, was the most common form of business organization before the Industrial Revolution. Today, however, with global markets and large-scale production, the size and capital requirements of firms have skyrocketed.
Corporations of such size have hundreds of thousand stockholders with an ownership stake in the firm proportional to their holdings of shares. Such a large group of individuals obviously cannot actively participate in the day-to-day management of the firm. Instead, they elect a board of directors that in turn hires and supervises the management of the firm.
This structure means that the owners and managers of the firm are different parties. This gives the firm a stability that the owner-managed firm cannot achieve.
For example, if some stockholders decide they no longer wish to hold shares in the firm, they can sell their shares to other investors, with no impact on the
management of the firm. Thus, financial assets and the ability to buy and sell those assets in the financial markets allow for easy separation of ownership and management.
How can all of the disparate owners of the firm, ranging from large pension funds holding hundreds of thousands of shares to small investors who may hold only a single share, agree on the objectives of the firm? Again, the financial markets provide some guidance. All may agree that the firm’s management should pursue strategies that enhance the value of their shares. Such policies will make all shareholders wealthier and allow them all to better pursue their personal goals, whatever those goals might be.
Do managers really attempt to maximize firm value? It is easy to see how they might be tempted to engage in activities not in the best interest of shareholders. For example, they might engage in empire building or avoid risky projects to protect their own jobs or overconsume luxuries such as corporate jets, reasoning that the cost of such perquisites is largely borne by the shareholders. These potential conflicts of interest are called agency problems because managers, who are hired as agents of the shareholders, may pursue their own interests instead.
The Players
From a bird’s-eye view, there would appear to be three major players in the financial markets (Bodie et al. 2012):
1. Firms are net borrowers. They raise capital now to pay for investments in plant and equipment. The income generated by those real assets provides the returns to investors who purchase the securities issued by the firm.
2. Households typically are net savers. They purchase the securities issued by firms that need to raise funds.
3. Governments can be borrowers or lenders, depending on the relationship between tax revenue and government expenditures.
Corporations and governments do not sell all or even most of their securities directly to individuals. For example, about half of all
stock is held by large financial institutions such as pension funds, mutual funds, insurance companies, and banks. These financial institutions stand between the security issuer (the firm) and the ultimate owner of the security (the individual investor). For this reason, they are called
financial intermediaries (Fabozzi-Choudry 2004).
Similarly, corporations do not market their own securities to the public. Instead, they hire agents, called investment bankers, to represent them to the investing public.
Markets Are Competitive
Financial markets are highly competitive. Thousands of intelligent and well-backed analysts constantly scour securities markets searching for the best buys. This competition means that we should expect to find few, if any, “free lunches,” securities that are so underpriced that they represent obvious bargains. This no-free-lunch proposition has two main implications (Bodie et al. 2012).
1. The Risk-Return Trade-Off
Investors invest for anticipated future returns, but those returns rarely can be predicted precisely. There will almost always be risk associated with investments. Actual or realized returns will almost always deviate from the expected return anticipated at the start of the investment period.
Naturally, if all else could be held equal, investors would prefer investments with the highest expected return. However, the no-free-lunch rule tells us that all else cannot be held equal.
If you want higher expected returns, you will have to pay a price in terms of accepting higher investment risk.
2. Efficient Market Hypothesis
Another implication of the no-free-lunch proposition is that we should rarely expect to find bargains in the security markets. Financial markets process all relevant information about securities quickly and efficiently, that is, that the security price usually reflects all the information available to investors concerning its value. According to this hypothesis, as new information about a security becomes available, its price quickly adjusts so that at any time, the security price equals the market consensus estimate of the value of the security. If this were so, there would be neither underpriced nor overpriced securities.
One interesting implication of this
“efficient market hypothesis” concerns the choice between active and passive investment-management strategies.
Passive management calls for holding highly diversified portfolios without spending effort or other resources
attempting to improve investment performance through security analysis. Active management is the attempt to improve performance either by identifying mispriced securities or by timing the performance of broad asset classes—for example, increasing one’s commitment to stocks when one is bullish on the stock market. If markets are efficient and prices reflect all relevant information, perhaps it is better to follow passive strategies instead of spending resources in a futile attempt to outguess your competitors in the financial markets.
If the efficient market hypothesis were taken to the extreme, there would be no point in active security analysis; only fools would commit resources to actively analyze securities.
Without ongoing security analysis, however, prices eventually would depart from “correct”
values, creating new incentives for experts to move in. Therefore, even in environments as competitive as the financial markets, we may observe only near-efficiency, and profit opportunities may exist for especially diligent and creative investors.
Specific transactions on the market
Now we turn to the essentials of two specific types of transactions, which are buying on margin and short-selling stocks. Buying on margin means borrowing money from a broker to buy more securities than can be purchased with one’s own money alone. Short-selling is the practice of selling securities that the seller does not own.
Buying on Margin
Purchasing stocks on margin means the investor borrows part of the purchase price of the stock from a broker. The margin in the account is the portion of the purchase price contributed by the investor; the remainder is borrowed from the broker. The brokers in turn borrow money from banks at the call money rate to finance these purchases; they then charge their clients that rate plus a service charge for the loan. All securities purchased on margin must be maintained with the brokerage firm in street name, for the securities are collateral for the loan.
The extent to which stock purchases can be financed using margin loans is limited by the regulatory intstituiton. Generally the initial margin requirement is 50%, meaning that at least 50% of the purchase price must be paid for in cash, with the rest borrowed. The current
initial margin requirement is 50%, meaning that at least 50% of the purchase price must be paid for in cash, with the rest borrowed.
Example: Buying on Margin
The percentage margin is defined as the ratio of the net worth, or the “equity value,” of the account to the market value of the securities. To demonstrate, suppose an investor initially pays $6,000 toward the purchase of $10,000 worth of stock (100 shares at $100 per share), borrowing the remaining $4,000 from a broker. The initial balance sheet looks like this:
Assets Liabilities and Owners’ Equity
Value of stock $10,000 Loan from broker $4,000 Equity $6,000 The initial percentage margin is:
Margin = Equity in account / Value of stock = $6,000 / $10,000 = .60, or 60%
If the price declines to $70 per share, the account balance becomes:
Assets Liabilities and Owners’ Equity
Value of stock $7,000 Loan from broker $4,000 Equity $3,000
The assets in the account fall by the full decrease in the stock value, as does the equity. The percentage margin is now:
Margin = Equity in account / Value of stock = $3,000 / $7,000 = .43, or 43%
If the stock value in the example were to fall below $4,000, owners’ equity would become negative, meaning the value of the stock is no longer sufficient collateral to cover the loan from the broker. To guard against this possibility, the broker sets a maintenance margin. If the percentage margin falls below the maintenance level, the broker will issue a margin call, which requires the investor to add new cash or securities to the margin account. If the investor does not act, the broker may sell securities from the account to pay off enough of the loan to restore the percentage margin to an acceptable level.
Suppose the maintenance margin is 30%. How far could the stock price fall before the investor would get a margin call?
Let P be the price of the stock. The value of the investor’s 100 shares is then 100 P, and the equity in the account is 100 P - $4,000. The percentage margin is (100 P - $4,000)/100 P. The price at which the percentage margin equals the maintenance margin of .3 is found by solving the equation (100P -4,000)/100P= .3 which implies that P= $57.14. If the price of the stock were to fall below $57.14 per share, the investor would get a margin call.
Source: Bodie et al (2012)
Why do investors buy securities on margin? They do so when they wish to invest an amount greater than their own money allows. Thus, they can achieve greater upside potential, but they also expose themselves to greater downside risk.
To see how, let’s suppose an investor is bullish on IBM stock, which is selling for $100 per share. An investor with $10,000 to invest expects IBM to go up in price by 30% during the next year. Ignoring any dividends, the expected rate of return would be 30% if the investor invested $10,000 to buy 100 shares.
But now assume the investor borrows another $10,000 from the broker and invests it in IBM, too. The total investment in IBM would be $20,000 (for 200 shares). Assuming an interest rate on the margin loan of 9% per year, what will the investor’s rate of return be now (again ignoring dividends) if IBM stock goes up 30% by year’s end?
The 200 shares will be worth $26,000. Paying off $10,900 of principal and interest on the margin loan leaves $15,100 (i.e., $26,000 – $10,900). The rate of return in this case will be ($15,100 - $10,000)/$10,000=51%
The investor has transformed a 30% rise in the stock’s price into a 51% rate of return on the
$10,000 investment.
Doing so, however, magnifies the downside risk. Suppose that, instead of going up by 30%, the price of IBM stock goes down by 30% to $70 per share. In that case, the 200 shares will be worth $14,000, and the investor is left with $3,100 after paying off the $10,900 of principal and interest on the loan. The result is a disastrous return of ($3,100 -
$10,000)/$10,000=-69%
If there is no change in IBM’s stock price, the investor loses 9%, the cost of the loan.
Suppose that in this margin example, the investor borrows only $5,000 at the same interest rate of 9% per year. What will the rate of return be if the price of IBM goes up by 30%? If it goes down by 30%? If it remains unchanged?
Change in Stock Price End-of-Year Value of Shares
Repayment of Principal and Interest*
Investor’s Rate of Return
30% increase $26,000 $10,900 51%
No change $20,000 $10,900 -9%
30% decrease $14,000 $10,900 -69%
*Assuming the investor buys $20,000 worth of stock, borrowing $10,000 of the purchase price at an interest rate of 9% per year.
The 200 shares will be worth $26,000. Paying off $10,900 of principal and interest on the margin loan leaves $15,100 (i.e., $26,000 – $10,900). The rate of return in this case will be ($15,100 - $10,000) / $10,000 = 51%
The investor has parlayed a 30% rise in the stock’s price into a 51% rate of return on the
$10,000 investment.
Doing so, however, magnifies the downside risk. Suppose that, instead of going up by 30%, the price of IBM stock goes down by 30% to $70 per share. In that case, the 200 shares will be worth $14,000, and the investor is left with $3,100 after paying off the $10,900 of principal and interest on the loan. The result is a disastrous return of
($3,100 - $10,000) / $10,000 = -69%
The table above summarizes the possible results of these hypothetical transactions. If there is no change in IBM’s stock price, the investor loses 9%, the cost of the loan.
Short Sales
Normally, an investor would first buy a stock and later sell it. With a short sale, the order is reversed. First, you sell and then you buy the shares. In both cases, you begin and end with no shares.
A short sale allows investors to profit from a decline in a security’s price. An investor borrows a share of stock from a broker and sells it. Later, the short-seller must purchase a share of the same stock in order to replace the share that was
borrowed. This is called covering the short position. The short-seller anticipates the stock price will fall, so that the share can be purchased later at a lower price than it initially sold for; if so, the short-seller will reap a profit.
Short-sellers must not only replace the shares but also pay the lender of the security any dividends paid during the short sale.
In practice, the shares loaned out for a short sale are typically provided by the shortseller’s brokerage firm, which holds a wide variety of securities of its other investors in street name (i.e., the broker holds the shares registered in its own name on behalf of the client). The owner of the shares need not know that the shares have been lent to the shortseller.
If the owner wishes to sell the shares, the brokerage firm will simply borrow shares from another investor. Therefore, the short sale may have an indefinite term. However, if the brokerage firm cannot locate new shares to replace the ones sold, the short-seller will need to repay the loan immediately by purchasing shares in the market and turning them over to the brokerage house to close out the loan.
Finally, exchange rules require that proceeds from a short sale must be kept on account with the broker. The short-seller cannot invest these funds to generate income, although large or institutional investors typically will receive some income from the proceeds of a short sale being held with the broker. Short-sellers also are required to post margin (cash or collateral) with the broker to cover losses should the stock price rise during the short sale.
Example: Short Sales
To illustrate the mechanics of short-selling, suppose you are bearish (pessimistic) on Dot Bomb stock, and its market price is $100 per share. You tell your broker to sell short 1,000 shares. The broker borrows 1,000 shares either from another customer’s account or from another broker.
The $100,000 cash proceeds from the short sale are credited to your account. Suppose the broker has a 50% margin requirement on short sales. This means you must have other cash or securities in your account worth at
least $50,000 that can serve as margin on the short sale. Let’s say that you have
$50,000 in Treasury bills. Your account with the broker after the short sale will then be:
Assets Liabilities and Owners’ Equity Cash $100,000
T-bills $50,000
Short position in Dot Bomb $100,000 stock (1,000 shares owed)
Equity $50,000
Your initial percentage margin is the ratio of the equity in the account, $50,000, to the current value of the shares you have borrowed and eventually must return, $100,000:
Percentage margin = Equity / Value of stock owed = $50,000 / $100,000 = .50
Suppose you are right and Dot Bomb falls to $70 per share. You can now close out your position at a profit. To cover the short sale, you buy 1,000 shares to replace the ones you borrowed. Because the shares now sell for $70, the purchase costs only $70,000. (Notice that when buying on margin, you borrow a given amount of dollars from your broker, so the amount of the loan is independent of the share price. In contrast, when short-selling you borrow a given number of shares, which must be returned. Therefore, when the price of the shares changes, the value of the loan also changes.) Because your account was credited for
$100,000 when the shares were borrowed and sold, your profit is $30,000: The profit equals the decline in the share price times the number of shares sold short.
Source: Bodie et al. (2012)
Like investors who purchase stock on margin, a short-seller must be concerned about margin calls. If the stock price rises, the margin in the account will fall; if margin falls to the maintenance level, the short-seller will receive a margin call.
You can see now why stop-buy orders often accompany short sales. Imagine that you short- sell Dot Bomb when it is selling at $100 per share. If the share price falls, you will profit from the short sale. On the other hand, if the share price rises, let’s say to $130, you will lose $30 per share. But suppose that when you initiate the short sale, you also enter a stop-buy order at $120. The stop-buy will be executed if the share price surpasses $120, thereby limiting your losses to $20 per share. (If the stock price drops, the stop-buy will never be executed.) The stop-buy order thus provides protection to the short-seller if the share price moves up.
Short-selling periodically comes under attack, particularly during times of financial stress when share prices fall. The last few years have been no exception to this rule. For example, following the 2008 financial crisis, the
SEC voted to restrict short sales in stocks that decline by at least 10% on a given day. Those stocks may now be shorted on that day and the next only at a price greater than the highest bid price across national stock markets.
Law of One Price and the Arbitrage
An arbitrage opportunity arises when an investor can earn riskless profits without making a net investment. A trivial example of an arbitrage opportunity would arise if shares of a stock sold for different prices on two different exchanges. For example, suppose IBM sold for $60 on the NYSE but only $58 on Nasdaq. Then you could buy the shares on Nasdaq and simultaneously sell them on the NYSE, clearing a riskless profit of $2 per share without using any of your own capital.
The Law of One Price states that if two assets are equivalent in all economically relevant respects, then they should have the same market price. The Law of One Price is enforced by arbitrageurs: if they observe a violation of the law, they will engage in arbitrage activity—
simultaneously buying the asset where it is cheap and selling where it is expensive.
In the process, they will bid up the price where it is low and force it down where it is high until the arbitrage opportunity is eliminated.
The idea that market prices will move to rule out arbitrage opportunities is perhaps the most fundamental concept in capital market theory.
The critical property of a risk-free arbitrage portfolio is that any investor, regardless of risk aversion or wealth, will want to take an infinite position in it. Because those large positions will quickly force prices up or down until the opportunity vanishes, security prices should satisfy a “no-arbitrage condition,” that is, a condition that rules out the existence of arbitrage opportunities.
Problem sets.
1. Are the following assets real or financial?
a. Patents
b. Lease obligations c. Customer goodwill d. A college education e. A $5 bill
2. An investor initially pays $2,250 toward to purchase of $3,000 worth of stock (50 shares at $60 per share) borrowing the remaining amount from the broker.
a.) What is the initial percentage margin?
b.) What will be the percentage margin if the price goes up to $80 per share?
c.) Suppose the maintenance margin is 40%. How far could the stock price fall before the investor would get a margin call?
3. You are bearish on Telecom and decide to sell short 100 shares at the current market price of $50 per share.
a.) How much in cash or securities must you put into your brokerage account if the broker’s initial margin requirement is 50% of the value of the short position?
b.) How high can the price of the stock go before you get a margin call if the maintenance margin is 30% of the value of the short position?
(Problems are from Bodie, Kane and Marcus’ „Investments”)
Part 2: Markets for Debt Securities or Fixed-Income Market
Learning outcome of the topic:
We begin the chapter by analyzing debt securities. A debt security is a claim on a specified periodic stream of income. Debt securities are often called fixed-income securities. The bond is the basic debt security, and this chapter provides an overview of the universe of bond markets, including both treasury and corporate bonds.
Instruments are sometimes said to comprise the fixed-income market, because most of them promise either a fixed stream of income or a stream of income that is determined according to a specific formula.
The money market is a subsector of the fixed-income market. It consists of very short-term debt securities that usually are highly marketable. Many of these securities trade in large denominations, and so are out of the reach of individual investors. Money market funds, however, are easily accessible to small investors. These mutual funds pool the resources of many investors and purchase a wide variety of money market securities on their behalf.
Treasury bills, certificates of deposits, commercial papers, repos and reverses etc.
The bond market is composed of longer term borrowing or debt instruments than those that trade in the money market. This market includes Treasury notes and bonds, corporate bonds, municipal bonds, mortgage securities etc. (Fabozzi-Modigliani 2003)
Treasury Bills
Treasury bills (T-bills, or just bills, for short) are the most marketable of all money market instruments. T-bills represent the simplest form of borrowing: The government raises money by selling bills to the public. Investors buy the bills at a discount from the stated maturity value. At the bill’s maturity, the holder receives from the government a payment equal to the face value of the bill. The difference between the purchase price and ultimate maturity value constitutes the investor’s earnings.
T-bills are issued with initial maturities of 4, 13, 26, or 52 weeks. Individuals can purchase T- bills directly, at auctions, or on the secondary market from a government securities dealer.
T-bills are highly liquid; that is, they are easily converted to cash and sold at low transaction cost and with not much price risk. Unlike most other money market instruments, which sell in minimum denominations of $100,000, T-bills sell in minimum denominations of only $100, although $10,000 denominations are far more common. The income earned on T-bills is exempt from all state and local taxes, another characteristic distinguishing them from other money market instruments.
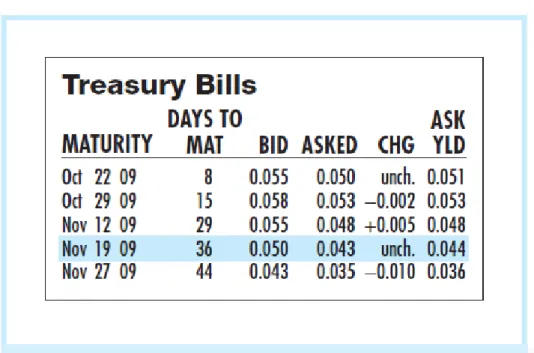
Figure 1 is a partial listing of T-bill rates. Rather than providing prices of each bill, the financial press reports yields based on those prices. You will see yields corresponding to both bid and asked prices. The asked price is the price you would have to pay to buy a T-bill from a securities dealer. The bid price is the slightly lower price you would receive if you wanted to sell a bill to a dealer. The bid–asked
spread is the difference in these prices, which is the dealer’s source of profit.
(Notice in Figure 1 that the bid yield is higher than the ask yield. This is because prices and yields are inversely related.)
Figure 1. Partial Listing of T-Bill Rates
Source: Compiled from data obtained from The Wall Street Journal Online, October 15, 2009.
The first two yields in this figure are reported using the bank-discount method. This means that the bill’s discount from its maturity or face value is “annualized” based on a 360-day year, and then reported as a percentage of face value. For example, for the highlighted bill maturing on November 19, days to maturity are 36 and the yield under the column labeled
“Asked” is given as 0.043%. This means that a dealer was willing to sell the bill at a discount from par value of 0.043% X (36/360) = .0043%. So a bill with $10,000 par value could be purchased for $10,000 X (1 - .000043) = $9,999.57.
Similarly, on the basis of the bid yield of 0.05%, a dealer would be willing to purchase the bill for $10,000 X [1 - .0005 X (36/360)] = $9,999.50.
The bank discount method for computing yields has a long tradition, but it is imperfect for at least two reasons. First, it assumes that the year has only 360 days. Second, it computes the yield as a fraction of par value rather than of the price the investor paid to acquire the bill.
An investor who buys the bill for the asked price and holds it until maturity will see her investment grow over 90 days by a multiple of $10,000/$9,999.57 = 1.000043, or .0043%.
Annualizing this return using a 365-day year results in a yield of .0043% X (365/36) = .044%, which is the value reported in the last column under “Asked Yield.” This last value is called the Treasury-bill’s bond-equivalent yield.
Bond Characteristics
A bond is a publicly traded debt contract (a security) that specifies a fixed set of cash flows which the issuer has to pay to the bondholder (Faure 2013). The cash flows consist of a coupon (interest) payment until maturity as well as repayment of the par value of the bond at maturity.
Every year until the bond matures, you collect regular interest payments. At maturity, when you get the final interest payment, you also get back the face (or par) value of the bond, which is called the bond’s principal.
The coupon rate (annual payment in the percentage of the par value), maturity date and par vale determine the cash flow of the bond.
Sometimes zero-coupon bonds are issued that make no coupon payments: investors receive par value at the maturity date but receive no interest payments until then (the bond has a coupon rate of zero). These bonds are issued at prices below par value, and the investor’s return comes solely from the difference between issue price and the payment of par value at maturity.
The bond market is composed of longer term borrowing or debt instruments than those that trade in the money market. This market includes Treasury notes and bonds, corporate bonds, municipal bonds, mortgage securities, and federal agency debt.
These instruments are sometimes said to comprise the fixed-income capital market, because most of them promise either a fixed stream of income or a stream of income that is determined according to a specific formula. In practice, these formulas can result in a flow of income that is far from fixed. Therefore, the term “fixed income” is probably not fully appropriate. It is simpler and more straightforward to call these securities either debt instruments or bonds.
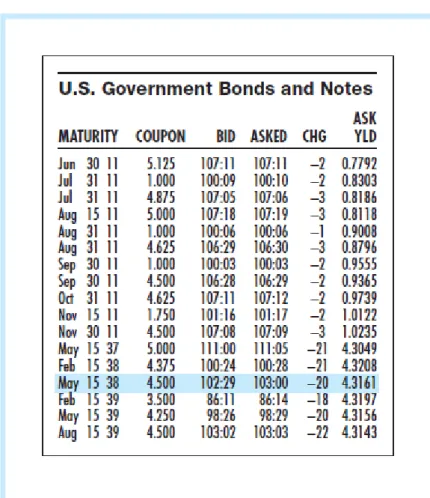
Treasury Notes and Bonds
The U.S. government borrows funds in large part by selling Treasury notes and Treasury bonds. T-notes are issued with maturities ranging up to 10 years, while bonds are issued with maturities ranging from 10 to 30 years. Both notes and bonds may be issued in increments of $100 but far more as commonly trade in denominations of $1,000. Both notes and bonds make semiannual interest
payments called coupon payments, a name derived from precomputer days, when investors would literally clip coupons attached to the bond and present a coupon to receive the interest payment.
Figure 2 is showing a listing of Treasury issues. Notice the highlighted note that matures in May 2038. The coupon income, or interest, paid by the note is 4.5% of par value, meaning that a $1,000 face-value note pays $45 in annual interest in two semiannual installments of
$22.50 each. The numbers to the right of the colon in the bid and asked prices represent units of 1/32 of a percentage point. The bid price of the note is 102 29/32%, or 102.906%.
The asked price is 103%. Although notes and bonds are sold in denominations of $1,000 par value, the prices are quoted as a percentage of par value. Thus the bid price of 102.906 should be interpreted as 102.906% of par, or $1029.06, for the $1,000 par value security.
Similarly, the note could be bought from a dealer for $1,030. The -20 change means the closing asked price on this day fell 20/32 (as a percentage of par value) from the previous day’s closing asked price. Finally, the yield to maturity on the note based on the asked price is 4.316%.
Figure 2. Listing of Treasury Bonds and Notes
Source: Compiled from data obtained from The Wall Street Journal Online, October 15, 2009.
The yield to maturity reported in the financial pages is calculated by determining the semiannual yield and then doubling it, rather than compounding it for two half-year periods.
This use of a simple interest technique to annualize means that the yield is quoted on an annual percentage rate (APR) basis rather than as an effective annual yield (Bodie et al.
2012). The APR method in this context is also called the bond equivalent yield.
The bond prices that you see quoted in the financial pages are not actually the prices that investors pay for the bond. This is because the quoted price does not include the interest that accrues between coupon payment dates.
If a bond is purchased between coupon payments, the buyer must pay the seller for accrued interest, the prorated share of the upcoming semiannual coupon. For example, if 30 days have passed since the last coupon payment, and there are 182 days in the semiannual coupon period, the seller is entitled to a payment of accrued interest of 30/182 of the semiannual coupon. The sale, or invoice, price of the bond would equal the stated price plus the accrued interest.
Example: Accrued Interest
Suppose that the coupon rate is 8%. Then the annual coupon is $80 and the semiannual coupon payment is $40. Because 30 days have passed since the last coupon payment, the accrued interest on the bond is $40 X (30/182) = $6.59. If the quoted price of the bond is
$990, then the invoice price will be $990 + $6.59 = $996.59.
The quoted bond price is known as the flat (or clean) price. The price that the bond buyer actually pays is sometimes called as the full (or dirty) price.
Bonds traded on formal exchanges are subject to minimum tick sizes set by the exchange.
Corporate Bonds
Corporate bonds are the means by which private firms borrow money directly from the public. These bonds are similar in structure to Treasury issues—they typically pay semiannual coupons over their lives and return the face value to the bondholder at maturity.
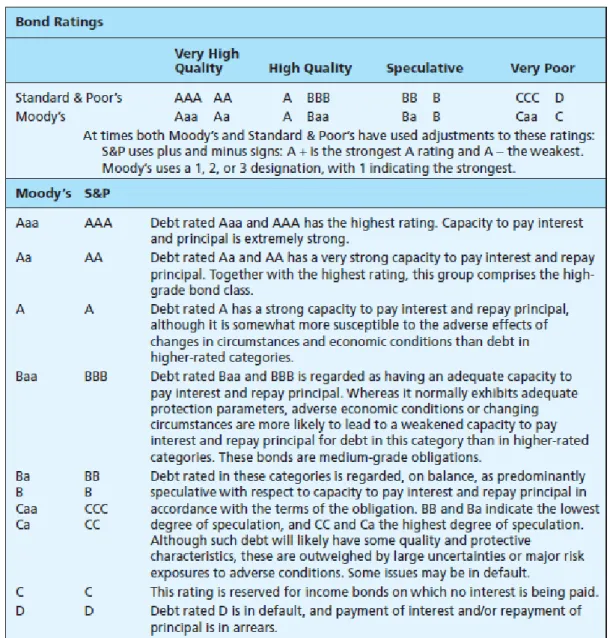
They differ most importantly from Treasury bonds in degree of risk. Default risk is a real consideration in the purchase of corporate bonds. We distinguish only among secured bonds, which have specific collateral backing them in the event of firm bankruptcy;
unsecured bonds, called debentures, which have no collateral; and subordinated debentures, which have a lower priority claim to the firm’s assets in the event of bankruptcy. In practice, the bond market can be quite “thin,” with few investors interested in trading a particular issue at any particular time.
Corporate bonds sometimes come with options attached (Bodie et al. 2012).
Callable bond allows the issuer to repurchase the bond at a specified call price before the maturity date. For example, if a company issues a bond with a high coupon rate when market interest rates are high, and interest rates later fall, the firm might like to retire the high-coupon debt and issue new bonds at a lower coupon rate to reduce interest payments.
The option to call the bond is valuable to the firm, allowing it to buy back the bonds and refinance at lower interest rates when market rates fall.
Convertible bonds give bondholders an option to exchange each bond for a specified number of shares of common stock of the firm.
While the callable bond gives the issuer the option to extend or retire the bond at the call date, the puttable bond gives this option to the bondholder. If the bond’s coupon rate exceeds current market yields, for instance, the bondholder will choose to extend the bond’s life. If the bond’s coupon rate is too low, it will be optimal not to extend; the bondholder instead reclaims principal, which can be invested at current yields.
Floating-rate bonds make interest payments that are tied to some measure of current market rates. For example, the rate might be adjusted annually to the current T-bill rate plus 2%. If the 1-year T-bill rate at the adjustment date is 4%, the bond’s coupon rate over the next year would then be 6%. This arrangement means that the bond always pays approximately current market rates.
Although preferred stock strictly speaking is considered to be equity, it often is included in the fixed-income universe. This is because, like bonds, preferred stock promises to pay a specified stream of dividends. However, unlike bonds, the failure to pay the promised dividend does not result in corporate bankruptcy. Preferred stock rarely gives its holders full voting privileges in the firm.
Indexed bonds make payments that are tied to a general price index. By tying the par value of the bond to the general level of prices, coupon payments as well as the final repayment of par value on these bonds increase in direct proportion to the Consumer Price Index.
Therefore, the interest rate on these bonds is the real rate.
Problem Sets.
1. What were the bid price, asked price, and yield to maturity of the 4.25% May 2039 Treasury bond displayed in Figure 2? What was its asked price the previous day?
2. Two bonds have identical times to maturity and coupon rates. One is callable at 105, the other at 110. Which should have the higher yield to maturity? Why?
3. You can see information about a T-bill below:
Maturity Days to mat. Bid Asked Chg. Ask yld.
Febr 28 ’09 73 6.08 6.03 +0.04 ? a) What does it cost for us to purchase this T-bill?
b.) What is the ask yield (last column)?
4.You can see information about a T-bond below:
Maturity Coupon Bid Asked Chg. Ask yld.
May 15 ’38 4.500 102:29 103:00 -20 4.3161
a.) What is the par value?
b.) What is the minimum price change (in dollars)?
c.) What was the asked price of bond (in dollars) the previous day?
d.) What is the upcoming semiannual coupon payment (in dollars)?
e.) If the accrued interest is $10, how much does one have to pay for the note?
5. Is it possible to sell a bond at 105% if the next coupon payment is in 292 days, the coupon rate is 15% and the investors’ required rate of return is 18%? Why?
(Problems are partly from Bodie, Kane and Marcus’ „Investments”)
Part 3: Investing in Bonds I.: the Return of the Investment
Learning outcome of the topic:
In this chapter we turn to bond pricing. The students learn how bond prices are set in accordance with market interest rates and why bond prices change with those rates. Given this background, we can compare several measures of bond returns such as coupon rate, current yield, simple yield to maturity, yield to maturity, holding period rate and realized compound return. The formulas are illusrated by numerical examples.
Investor considers the risk and return of the investment. Returns are reflected in the bond prices. Risk is associated with the possible default of the issuer and the unexpected changes of the bond price.
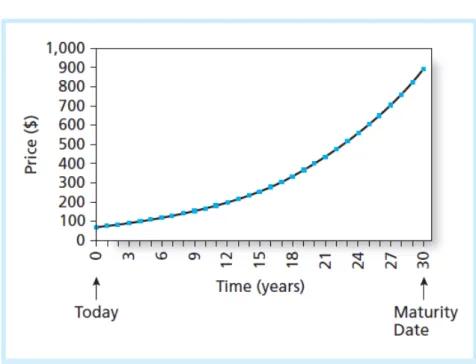
Bond Pricing
Because a bond’s coupon and principal repayments all occur months or years in the future, the price an investor would be willing to pay for a claim to those payments depends on the value of dollars to be received in the future compared to dollars in hand today. This “present value” calculation depends in turn on market interest rates.
A bond is a publicly traded debt contract that specifies a fixed set of cash flows which the issuer has to pay to the bondholder. The cash flows consist of a coupon (interest) payment until maturity as well as repayment of the par value of the bond at maturity.
Every year until the bond matures, you collect regular interest payments. At maturity, when you get the final interest payment, you also get back the face value of the bond, which is called the bond’s principal.
Value of bond = PV (cash flows) = PV (coupons)+ PV (par value)=
=PV(annuity of coupon payments)+PV(final payment of principal)
Example: Pricing OATs
French government bonds, known as OATs (short for Obligations Assimilables du Trésor), pay interest and principal in euros (€). Suppose that in December 2015 you decide to buy €100 face value of the 8.5% OAT maturing in December 2019.
Each December until the bond matures you are entitled to an interest payment of .085 X100= €8.50.
This amount is the bond’s coupon.
When the bond matures in 2019, the government pays you the final €8.50 interest, plus the principal payment of the €100 face value.
Your first coupon payment is in one year’s time, in December 2009. So the cash payments from the bond are as follows:
2016 2017 2018 2019
€8.5 €8.5 €8.5 €108.5
What is the present value of these payments? It depends on the opportunity cost of capital, which in this case equals the rate of return offered by other government debt issues denominated in euros.
In December 2008, other medium-term French government bonds offered a return of about 3.0%. That is what you were giving up when you bought the 8.5% OATs. Therefore, to value the 8.5% OATs, you must discount the cash flows at 3.0%:
PV=8.5/1.03 + 8.5/1.032 + 8.5/1.033 + 108.5/1.034 = €120.44
You may have noticed a shortcut way to value this bond. Your OAT amounts to a package of two investments.
The first investment gets the four annual coupon payments of €8.50 each. The second gets the €100 face value at maturity. You can use the annuity formula to value the coupon payments and then add on the present value of the final payment.
PV=8.5 X(PVIFA=3.717)+100 X (DF=0.888)= €120.44
Source: Brealey et al. (2006)
Return of a Bond
How can we measure the return of a bond? There are several measures in use (Bodie et al 2012):
coupon rate (?)
current yield
simple yield to maturity
yield to maturity
holding period rate
realized compound return
The problem with the coupon rate as a yield measure is that the investor rarely buys the bond at its par value. Current yield (CY) is the bond’s annual coupon payment divided by the bond price. For example, for the 8%, 30-year bond currently selling at $1,276.76, the current yield would be $80/$1,276.76 = .0627, or 6.27%, per year. Current yield measures only the cash income provided by the bond as a percentage of bond price and ignores any prospective capital gains or losses. The simple yield to maturity (SYTM) is only an approximation of total return because it ignores the time value of money but it measures also the prospective capital gains or
losses.
SYTM=
The yield to maturity (YTM) is the standard measure of the total rate of return, but it is far from perfect and we explore several variations of this measure such as holding period rate and realized compound return.
YTM is the interest rate that makes the present value of a bond’s payments equal to its price. It is often interpreted as a measure of the average rate of return that will be earned on a bond if it is bought now and held until maturity.
The yield to maturity can be interpreted as the compound rate of return over the life of the bond under the assumption that all bond coupons can be reinvested at that yield. It can be calculated using a trial-and-error approach or spreadsheet programs (Excel).
In practice, an investor considering the purchase of a bond is not quoted a promised rate of return. Instead, the investor must use the bond price, maturity date, and coupon payments to infer the return offered by the bond over its life.
Example: Calculation of a Bond’s YTM
To calculate the yield to maturity, we solve the bond price equation for the interest rate given the bond’s price.
Suppose an 8% coupon, 30-year bond is selling at $1,276.76. What average rate of return would be earned by an investor purchasing the bond at this price? We find the interest rate at which the present value of the remaining 60 semiannual payments equals the bond price.
This is the rate consistent with the observed price of the bond. Therefore, we solve for r in the following equation:
1,276.76= 40XAnnuity factor(r, 60)+1,000XPV factor(r, 60)
These equations have only one unknown variable, the interest rate, r. You can use a financial calculator or spreadsheet to confirm that the solution is r = .03, or 3%, per half-year. This is the bond’s yield to maturity.
Source: Bodie et al. (2012)
The financial press reports yields on an annualized basis, and annualizes the bond’s semiannual yield using simple interest techniques, resulting in an annual percentage rate, or APR. (See the last column in Figure 2. p.17.) Yields annualized using simple interest are also called “bond equivalent yields.”
Therefore, the semiannual yield would be doubled and reported in the newspaper as a bond equivalent yield of 6%.
The effective annual yield of the bond, however, accounts for compound interest. If one earns 3% interest every 6 months, then after 1 year, each dollar invested grows with interest to $1 X (1.03) 2 = $1.0609, and the effective annual interest rate on the bond is 6.09%.
If the investor doesn’t hold the bond until maturity the average return of the bond can differ from the bond’s YTM. In this case we can calculate the holding period return (HPR) which is the internal rate of return of the investment in the bond considering the price at which the investor sells the bond at the end of the holding period.
Example: Calculation of a Bond’s HPR
A newly issued bond pays its coupons once annually. Its coupon rate is 5%, its maturity is 20 years, and its yield to maturity is 8%.
Find the holding-period return for a 1-year investment period if the bond is selling at a yield to maturity of 7% by the end of the year. The bond’s initial price is P0 = $705.46 at r=8%.
Next year's price is P1 = $793.29 at r=7%.
HPR=(50+(793.29-705.46))/705.46=19,54%
Source: Bodie et al. (2012)
We have noted that yield to maturity will equal the rate of return realized over the life of the bond if all coupons are reinvested at an interest rate equal to the bond’s yield to maturity.
What if the reinvestment rate does not equal to the YTM?
Then we can calculate the realized compund return using the reinvestment rates but only after the investment period ends and it cannot be computed in advance without a forecast of future reinvestment rates. Realized compound return is the annual effective growth rate of invested fund.
Example: Calculation of Bond’s Realized Compound Return
Consider, for example, a 2-year bond selling at par value paying a 10% coupon once a year.
The yield to maturity is 10%. If the $100 coupon payment is reinvested at an interest rate of 10%, the $1,000 investment in the bond will grow after 2 years to $1,210. But if the reinvestment rate is less than 10%, so will be the realized compound return.
To illustrate, suppose the interest rate at which the coupon can be invested equals 8%. The calculations are the following:
Future value of first coupon payment with interest earnings =$100X1.08=$ 108 + Cash payment in second year (final coupon plus par value) =$1,100
= Total value of investment with reinvested coupons =$1,208
The realized compound return is the compound rate of growth of invested funds, assuming that all coupon payments are reinvested. The investor purchased the bond for par at $1,000, and this investment grew to $1,208.
V0(1+r)2=V2
$1,000(1+r)2=$1,208 r=.0991 = 9.91%
Source: Bodie et al. (2012)
Problem Sets.
1. We have information on three 5-year bonds in the same risk class. All the 3 bonds are issued at par value of €100 with 0%, 10% and 20% coupon rate. Their prices are €80, €82 and
€90, respectively. Do these prices satisfy the no-arbitrage condition?
2. A bond is issued with $1000 par value, maturity of 15 years and 5% coupon rate. What is the bond’s market price?
3. A 10-year German government bond (bund) has a face value of €100 and a coupon rate of 5% paid annually. Assume that the interest rate (in euros) is equal to 6% per year. What is the bond’s PV?
4. A 10-year U.S. Treasury bond with a face value of $10,000 pays a coupon of 5.5% (2.75%
of face value every six months). The semiannually compounded interest rate is 5.2% (a six- month discount rate of 5.2/2 = 2.6%). What is the present value of the bond?
5. A 3-year bond with an annual coupon rate of 4.8% sells for $970. What is the bond’s current yield/simple yied to maturity/yield to maturity?
6. Here are the prices of three bonds with 10-year maturities:
Bond Coupon (%) Price (%)
2 81.62
4 98.39
8 133.42
If coupons are paid annually, which bond offered the highest yield to maturity?
7.A bond has a current yield of 9% and a yield to maturity of 10%. Is the bond selling above or below par value?
8. Which security has a higher effective annual interest rate?
a.) A 3-month T-bill selling at $97,645 with par value $100,000.
b.) A coupon bond selling at par and paying a 10% coupon semiannually.
9. Treasury bonds paying an 8% coupon rate with semiannual payments currently sell at par value. What coupon rate would they have to pay in order to sell at par if they paid their coupons annually? (Hint: What is the effective annual yield on the bond?)
10. The yield to maturity (YTM) on 1-year zero-coupon bonds is 5% and the YTM on 2-year zeros is 6%. The yield to maturity on 2-year-maturity coupon bonds with coupon rates of 12% (paid annually) is 5.8%. What arbitrage opportunity is available for an investment banking firm? What is the profit on the activity?
11. The current price of a 3-year zero-coupon bond is 74%, the current price of a 2-year bond with 15% coupon rate is 109,4% and a 3-year bond with 10,4% coupon rate can be issued at par value. Under these conditions at what price can the company issue a 3-year bond with 20% coupon rate?
12. Suppose you buy a 5-year, 8% (p.a.) coupon bond for 80% of the par value. What will be the realized compaund return if the reinvestment rate is 10%?
13. Consider an 8% coupon bond selling for $953.10 with 3 years until maturity making annual coupon payments. The interest rates in the next 3 years will be, with certainty, r1 = 8%, r2 = 10%, and r3 = 12%. Calculate the yield to maturity and realized compound yield ofthe bond.
14. The invoice price of a 4-year, 18% coupon rate is 98,5%. The par value is $10,000. You observe the following yields through the life of the bond:
Yields (reinvestment rates)
at the issuance 1 year later 2 years later 3 years later 4 years later
r1 18,0% 18,0% 17,0% 17,0% 17,0%
r2 19,0% 18,5% 17,5% 17,5% 17,5%
r3 19,5% 18,0% 18,0% 18,0% 18,0%
r4 19,5% 19,0% 18,5% 18,0% 18,5%
What will be the realized compound return at the maturity of the bond?
15. Are the following statements are true or false? Explain why.
a.) If a bond’s coupon rate is higher than its yield to maturity, then the bond will sell for more than face value.
b.) If a bond’s coupon rate is lower than its yield to maturity, then the bond’s price will increase over its remaining maturity.
16. What is the relationship among coupon rate, current yield and yield to maturity a.) for premium bonds?
b.) for bonds selling at discounts from par?
17. The stated yield to maturity and realized compound yield to maturity of a (default-free) zerocoupon bond will always be equal. Why?
(Problems are partly from Bodie, Kane and Marcus’ „Investments”)
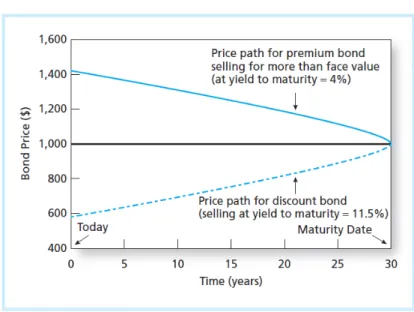
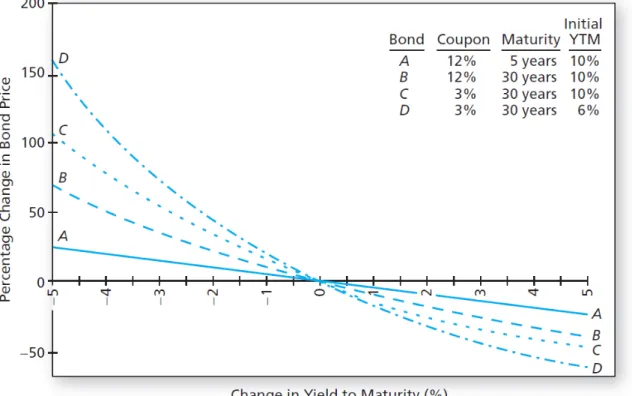
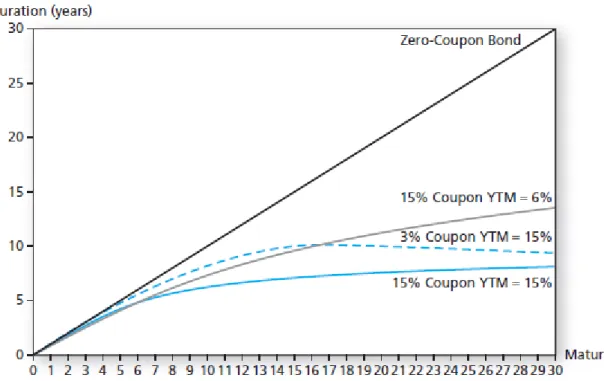
Part 4: Investing in Bonds II.: the Risk of the Investment
Learning outcome of the topic:
In this chapter, we consider the impact of default or credit risk on bond pricing and the students will learn what the determinants of credit risk are and how the default premium is built into bond yields. Another source of risk is the interest rate risk that is crucial to formulating investment strategies in the fixed-income security market. The students will understand the determinants of the sensitivity of bond prices to interest rate fluctuations.