Banking Supervisors Tracing the Transition to IFRS 9*
Attila Háda
The paper presents the supervisory approach of the transition to IFRS 9, implemented in the credit institution sector from 1 January 2018. The author evaluates the impacts of the transition and describes the IFRS-specific items that require a different supervisory approach. One of the conclusions of the paper is that transition to IFRS9 had no major influence on credit institutions’ capital adequacy situation. When assessing the objective of fair valuation and hedge accounting, it may be stated that those essentially support forward-looking, risk-based supervision. As a result of the introduction of the new impairment rules, prudential and accounting impairment approximated each other, but the management of expected losses not sufficiently covered by impairment is not explicit, and the author also makes a recommendation for a potential solution.
Journal of Economic Literature (JEL) codes: G21, M41, M48
Keywords: IFRS9, banking supervision, impairment, fair valuation, hedge accounting
1. Introduction
The analysis and processing of the data reporting submitted by credit institutions (banks) forms integral part of the supervisory work and serves as a basis for risk assessment. The reports necessary to fulfil the MNB’s supervisory duties can be allocated to two major groups: data presenting financial and accounting information (FINREP1), and the data tables related to prudential (capital, liquidity, large risk) compliance (COREP2). The starting point of data reporting is always based on the accounting rules and information used by the banks. From 1 January 2018, the individual financial statements of credit institutions must be compiled, on a mandatory basis, according to the IFRS standards (European Commission 2008), adopted by the EU, instead of the Hungarian accounting rules, resulting in a major change in supervisory practices. The difficulties involved with this transition were further exacerbated by the fact that the new IFRS 9 standard (European Commission
* The papers in this issue contain the views of the authors which are not necessarily the same as the official views of the Magyar Nemzeti Bank.
Háda Attila is a Senior Supervisor at Magyar Nemzeti Bank. E-mail: hadaa@mnb.hu The Hungarian manuscript was received on 14 June 2019.
DOI: http://doi.org/10.33893/FER.18.4.77111
2016) on the treatment of financial instruments (classification, measurement, impairment and hedge accounting) also entered into force at this time, and thus the transition also had a major effect even on banks that had previously used IFRS.
Due to temporary exemptions, exceptions to this included the cooperative credit institution sector and a few specialised credit institutions, but from 2019 all credit institutions must compile both the financial statements and the supervisory reports uniformly, on the basis of IFRS.
Summarising the IFRS-based credit institution data3, the paper presents the composition of financial instruments, the related valuation methods and the various accounting policy decisions. Setting out from this, the paper describes the consequences of the transition to IFRS 9, the supervisory assessment of the IFRS- specific elements and the differences in the valuation methods. Accounting and supervisory objectives often differ, and thus it is necessary and expected that all stakeholders (market participants, auditors, supervisors) understand the differences and apply the related rules correctly. The key objective of the accounting regulation is to present, by compiling the annual accounts, a true and fair view of the financial situation, primarily for external stakeholders (e.g. investors, lenders). By contrast, the primary objective of the supervisory regulation is to ensure the stability of the financial system and protect the depositors of credit institutions, which necessitates the application of approaches different from the accounting valuation. While accounting focuses on the current situation and the presentation of a fair view, supervisory valuation prepares for an anticipated future economic downturn, and thus tries to reduce the sensitivity of the banking operation to business cycles (procyclical4 operation). Accordingly, from time to time it applies more conservative approaches (e.g. prudent valuation, prudential filters, supervisory parameters used for capital requirement calculation).
The EU regulation containing the prudential requirements and capital adequacy rules (CRR 2013) refers to the IFRS standards for several basic terms (e.g. deferred tax assets, accumulated other comprehensive income), and thus the knowledge of the accounting background of these items is essential for the proper application of the supervisory requirements. In the paper, the summary of the data underlying the analysis always focuses on the elements stressed in the respective topic, and hence it deliberately does not follow the structure of the data tables in the supervisory balance sheet. The analysis does not intend to describe the IFRS rules in detail, but rather, setting out from those, it attempts to identify the supervisory issues that may arise and presents the accounting and prudential relations. A summary of the key differences is included in Table 1:
3 Based on unaudited IFRS data of individual credit institutions for 2018, except Section 4.
4 During the economic boom, bank usually lend more actively than desirable and take higher risk than justified, while during times of recession they cut back lending excessively, strengthening the cyclical nature of the economy.
Table 1
Key differences in accounting and prudential rules Accounting and prudential
topics
Method of treatment
Accounting treatment Supervisory treatment Basis of consolidation Based on control Based on the scope of activity
(banking, financial) Method of consolidation Full, equity-based Full, proportionate
Exposure value of assets Book value Adjusted book value,
replacement value Assessment of expected loss Sensitive to business cycles, with
outlook over one year Independent of the business cycles, with annual outlook Assets and liabilities measured at
fair value Fair value (exit price) Adjusted fair value (prudent
value), prudential filters Source: Edited based on European Commission (2008) and CRR
For banking groups, accounting examines – for the purpose of inclusion in consolidation – significant influence, i.e. the existence of control. By contrast, the purpose of supervision on a consolidated basis is to identify the multiple use of own funds (BCBS 1999:8–9), and thus it is primarily aimed at the inclusion of financial sector entities. One important difference is that under consolidated supervision use of the equity method is not permitted, since it would not ensure the direct calculation of risk-weighted exposures in the course of quantifying capital adequacy.
Different supervisory treatment can also be observed in defining the exposure values determined as a starting point for calculation of the capital requirement (e.g. the exposure value must be adjusted for the items already deducted from own funds). In addition, the prudential regulation, setting out from the accounting valuation, modifies5 the exposure values at several places or calculates them using a special methodology,6 with a view to increasing risk sensitivity. Additional differences can also be identified in fair valuation and the assessment of expected losses, which will be dealt with in detail in the following sections.
2. Fair valuation
In terms of the valuation methods selectable under IFRS 9, fair valuation is a dominant factor, and thus it is necessary to review it for the purpose of the valuation of balance sheet items. While the IFRS 9 standard defines the range of items to be measured at fair value, the principles and valuation techniques of fair valuation are regulated by the standard IFRS 13 (European Commission 2012).
Although Hungarian accounting standards also provided for the fair valuation in
5 E.g. probability of the drawdown of off-balance sheet items
6 E.g. exposure values of derivatives, securities funding transactions, based on Articles 111 (2) and 166(5), (7) of CRR
the past, they did not prescribe the use thereof on a mandatory basis.7 According to IFRS 13, the instruments are to be arranged in a fair value hierarchy based on the possibility of observing valuation inputs and the liquidity of the markets characteristic for the instrument. The standard is a principle-based one, it does not prescribe specific rules for the valuation methods of the individual instruments since those may be extremely diverse. It is an important principle that the fair value is not the mid-market price, but rather an exit price at which the respective asset can be effectively sold or paid for a liability between independent parties.
2.1. Fair value hierarchy
Due to the diversity of financial instruments, the variety of valuation techniques and the different availability of market prices, it is often difficult to compare the fair value of the individual instruments (e.g. upon market or model-based valuation).
Consequently, the standards introduced the notion of the fair value hierarchy, where three different valuation levels have been defined from the perspective of the reliability of the market price setting (Szücs – Ulbert 2017). The key criteria of the classification are summarised in Table 2:
Table 2
Fair valuation hierarchy Hierarchy levels
of fair valuation Basis of valuation Valuation
method 1. level Quoted prices in active markets for identical assets or liabilities
that the entity can access on the measurement date Valuation based on market prices 2. level
Quoted prices for similar instruments in active markets
Quoted prices for identical or similar instruments in markets that are not active
Model-based estimated value, if all major inputs are observable
Model-based valuation 3. level Model-based estimated value, if at least one major input is
unobservable
Source: Compiled based on European Commission (2012)
The assets/liabilities with the most reliable – for the purpose of valuation – directly observable and liquid market prices are allocated to Level 1 (e.g. based on market prices quoted on the exchange). Instruments that have no directly observable market price, but for which upon fair valuation all major valuation inputs are based on observable market data or can be determined based on the price of a similar instrument quoted on an available active market, are to be allocated to Level 2.
If no market prices are available and there is significant valuation uncertainty, the instrument must be allocated to the lowest level, i.e. Level 3. Table 3 illustrates the
7 Based on Section 59/A of Act C of 2000 on Accounting.
breakdown of the various balance sheet items measured at fair value according to the end of 2018 hierarchy.
Table 3
Portfolios measured at fair value according to the fair value hierarchy (31 December 2018)
Instrument types Level 1
(HUF billions) Level 2
(HUF billions) Level 3
(HUF billions) Total (HUF billions)
Securities 3,513 934 0 4,447
Derivatives 15 788 9 812
Loans 6 41 95 142
Equity stakes 11 54 10 75
Deposits, loans taken, bonds 0 163 0 163
Total 3,545 1,980 114 5,639
Source: Data reporting ordered based on MNB (2018a)
The data in Table 3 show that a major portion of the overall portfolio subjected to fair valuation includes Level 1 securities, which are typically Hungarian government securities. Level 2 assets include all types of instruments, but is dominated by securities and derivatives. For supervisory purposes, it is a positive fact that the ratio of Level 3 assets involving a high degree of valuation uncertainty is low (merely 2 per cent). The European Central Bank (ECB) launched an asset quality review, in which one of the key considerations was the revision of the valuation of Level 3 assets (ECB 2014). The review of the valuation requirements specifically covered the fair valuation requirements prescribed by IFRS 13 (Dentgen – Gramatke 2014), while the ECB took into consideration the potential value differences during the stress test that followed the asset quality review, as the adjustment of own funds.
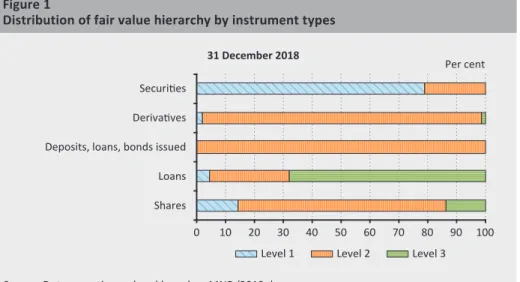
Loans and derivatives typically have no prices observable on active markets and are thus dominated by Level 2 and Level 3 assets. In such cases, additional valuation adjustments may be necessary for the purpose of determining the exit price, which is expected by the standard (e.g. for asset-type derivatives with positive fair value, credit valuation adjustment which also considers the non-performance risk of the counterparty8). Pursuant to Article 381 of CRR, banks are also expected to recognise a capital requirement for the CVA risks, which provides cover for the unexpected additional losses, while under the prudent valuation – which also includes supervisory considerations – additional value adjustments may also be necessary (e.g. close-out costs, future administration costs, model risk). Distribution of the individual instrument types by fair value hierarchy is presented by Figure 1:
8 CVA: Credit valuation adjustment
Figure 1 shows that the vast majority of the securities belong to Level 1 (77 per cent), since most of them are highly liquid assets with low credit risk. The derivatives, subject to mandatory fair valuation, are typically valued at Level 2 (97 per cent), since due to the unique contractual conditions usually no direct comparable market prices are available. The ratio of Level 2 and Level 3 asset within equities is high (e.g. strategic investments), since usually only listed securities may be allocated to Level 1. The fair value portfolio of other liability-side items is negligible; those are usually involved for risk management purposes, as part of fair value options. Such cases may include the fair valuation of a bond in the case of an issued bond and the hedging transaction that swaps the fixed interest thereof for variable interest (since it is mandatory to use fair valuation for the related hedging transaction). It may also be necessary to use fair valuation for liabilities in the case of refinancing directly connected to loans measured at fair value, due to the same reason.
2.2. Valuation adjustment due to the requirements of prudent valuation
As regards the supervisory requirements, Articles 34 and 105 of CRR contain the requirement that the credit institutions must – as the case may be – recognise additional valuation adjustments for their (bank and trading book) positions measured at fair value. The economic crisis of 2008 proved that liquidity drying up in markets may make fair valuation uncertain, and thus a more conservative approach may be necessary, primarily in respect of less liquid positions or those
Figure 1
Distribution of fair value hierarchy by instrument types
Shares Loans Deposits, loans, bonds issued Derivatives Securities
0 10 20 30 40 50 60 70 80 90 100
Per cent 31 December 2018
Level 1 Level 2 Level 3 Source: Data reporting ordered based on MNB (2018a)
with higher inherent valuation uncertainty. The amount of the adjustment reduces the value of assets and increases the value of liabilities, and thus it always has a profit-deteriorating effect. The item is special in the sense that – although it must be treated as a prudential adjustment – it does not form part of accumulated other comprehensive income, but rather adjusts the value of the respective instrument to a prudent value. All of this leads to a more conservative, supervisory approach of fair valuation, which expresses that in a given case the exit price determined during fair valuation may result in additional losses. The prudent valuation may overlap the valuation adjustments applied under fair valuation (e.g. non- performance risk, cost of finance, credit spreads), and thus the position may be exempted, where appropriate, from prudent valuation. It is an important difference that while the valuation adjustments used under fair valuation also appear in the accounting statements (they modify net income), the additional valuation adjustments recognised under prudential valuation only reduce the amount of own funds.
The detailed rules issued by the EBA9 on the topic (European Commission 2016a) contain the requirements related to calculating the valuation adjustment. Market participants without major fair value positions have the opportunity, also considering the principle of proportionality, to determine the value of the adjustment using the simplified approach (0.1 per cent of the absolute sum of the assets and liabilities measured at fair value). As regards Hungarian credit institutions, it can be stated that – due to their size – they have no positions of major significance at the European level and usually their fair value can also be measured reliably (Level 1 assets). Based on the foregoing, the simplified approach is commonly applied, with the exception of banks whose parent company is registered abroad, which are obliged to use the core approach at the group level (assets and liabilities exceeding EUR 15 billion measured at fair value), since in their case the core approach, used by the parent company, must also be applied at the sub-consolidated level.
9 EBA: European Banking Authority
3. Analysis of the balance sheet
3.1. Assets
When assessing the impact of the transition to IFRS 9, the starting point of the analysis is the aggregated balance sheet of the credit institutions, through which the valuation method selected for the various financial instruments can be presented.
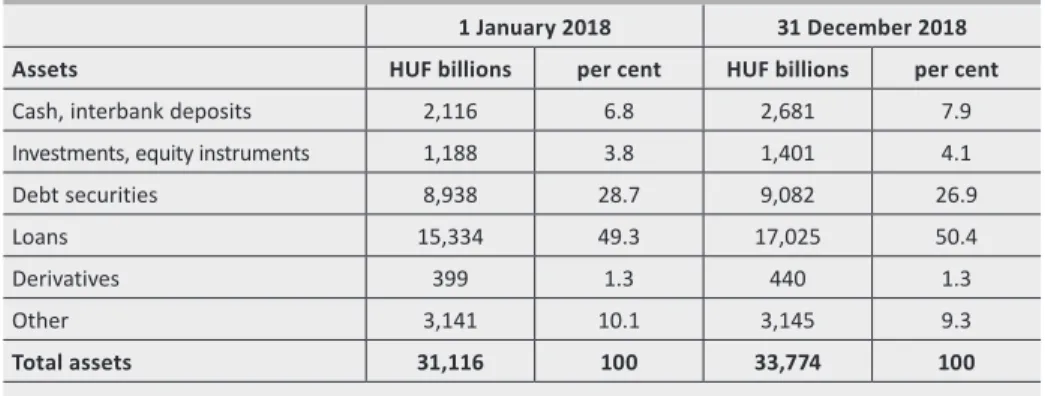
Table 4 illustrates the change in the assets of banks that used IFRS in 2018:
Table 4
Change in the 2018 balance of assets and their structure
1 January 2018 31 December 2018
Assets HUF billions per cent HUF billions per cent
Cash, interbank deposits 2,116 6.8 2,681 7.9
Investments, equity instruments 1,188 3.8 1,401 4.1
Debt securities 8,938 28.7 9,082 26.9
Loans 15,334 49.3 17,025 50.4
Derivatives 399 1.3 440 1.3
Other 3,141 10.1 3,145 9.3
Total assets 31,116 100 33,774 100
Source: Data reporting ordered based on MNB (2018a)
The data show that the growth in the balance sheet total in 2018 was mostly caused by the increase in the balance of loans and certain liquid assets (cash, interbank deposits). The share of loans within the balance sheet total exceeded 50 per cent by the end of 2018. Upon introducing the IFRS rules, one of the determinant elements is the use of fair valuation, which is mandatory for derivatives, while in the case of other instruments it depends on the assessment of certain conditions (e.g.
assessment of business model). In Table 4, deferred tax assets are included in the other items, because in the past Hungarian accounting did not treat the accounting and tax differences separately in the balance sheet. Figure 2 shows the ratio of banks using fair valuation among their financial instruments:
It is clear that among the financial instruments the ratio of assets valued at amortised cost (AC10) increased further, which was attributable to the surge in outstanding lending. The decrease in the portfolios measured at fair value mostly resulted from the change in debt securities. The bulk of the assets within the fair valuation category are valued directly through other comprehensive income (FVTOCI11), while the smaller part of them are valued through current year’s profit or loss (FVTPL12).
From supervisory perspective, one of the consequences of fair valuation is that in the case of instruments not held to maturity the change in market factors underlying the calculation of fair value (e.g. benchmark yields) immediately appears in the value of the instruments. A typical case was, for example, when in the declining yield environment the fair value of fixed rate securities purchased earlier increased. All of this also had a positive effect on capital adequacy through the rise in shareholders’
equity. However, the excessive recognition of unrealised gains may represent a supervisory risk of such a degree that it needs to be addressed. Fair valuation may also be undesirable in an economic stress situation or market turbulence, since it may make the capital adequacy ratio uncertain due to the excessive volatility of the unrealised profit/loss components. Namely, the purpose of own funds (particularly of CET113) is to take stock of the profit/loss components, primarily of
10Amortised cost: The value of the financial asset or financial liability determined upon initial recognition, reduced by principal repayments, and increased or decreased by the accumulated amortisation of the difference of such initial value and the value at maturity, calculated using the effective interest rate method and adjusted, in the case of financial assets, for any recognised loss.
11Fair value through other comprehensive income
12Fair value through profit and loss
13Common Equity Tier 1 Figure 2
Valuation method of financial instruments
5.1% 16.9% 3.6% 14.0%
82.5%
78.1%
1 January 2018 31 December 2018
FVTPL FVTOCI AC
FVTPL FVTOCI AC
Source: Data reporting ordered based on MNB (2018a)
those already realised, that are definitely suitable for covering the loss. Accordingly, it can be stated in general that the application of the amortised cost of historical approach reduces the risks related to volatility, but in the case of certain portfolio elements (e.g. securities held for trading or sales) it is justified and useful to apply fair valuation due to the timely mapping of the risks arising from unrealised losses.
All of this is essentially in line with the forward-looking supervisory objectives.
Fair value option
Fair valuation may also be applied on the basis of choice, the opportunity for which is provided by the fair value option, which permits the elimination or material reduction of the accounting inconsistency. Such cases may include when a bank, fearing a rise in market yields, concludes hedging transactions for the interest rate risk of its fixed-rate assets (e.g. loans, securities), where it swaps the fixed interest for variable interest, thereby eliminating its risks (of positive or negative sign) stemming from the change in market rates. If the sole purpose of holding the instruments is to collect the contractual cash flows and the contractual conditions satisfy the SPPI requirements, those should be measured at amortised cost (hedged transactions). According to the IFRS requirements, it is mandatory to measure the related derivative transactions of hedging purposes at fair value, while the hedged transactions would remain at amortised cost. In this case, there is a possibility to state the hedged items at fair value as well, and thus the profit/loss impacts stemming from the change in fair value may almost offset each other. Strict conditions apply to the use of hedge accounting and the inclusion in hedge relationships (e.g. preparation of hedge documentation, monitoring of hedge effectiveness), to which the application of fair value option may be an alternative. Namely, it is also true for the fair value option that the recognition of the profit/loss elements of opposite sign against each other reduces the volatility of own funds.
From supervisory point of view, application of the fair value option instead of hedge accounting is also favourable, if the effect of the first can be measured reliably, the risk management objectives are documented and the economic content of the transactions also supports it.
3.1.1. Loans
Loans constitute the most dominant part of banks’ assets. Loans are debt-type financial instruments where the regulation permits recording at amortised cost, if the following conditions are met: One of the requirements comes from the business model, according to which the purpose of holding the instrument is to collect the contractual cash flow (exception: upon selecting the held for sale business model or fair value option, which are subject to fair valuation). The second requirement is that these cash flows should include only principal and interest payments; however,
this is conditional upon passing the SPPI14 test. Interest payments may only consist of certain elements (time value of money, borrower’s credit risk, defined profit margin). If the future cash flows of the respective loan (type) are not only of an interest and principal nature, it must be valued at fair value. Examples of this may include when the interest period of the loan and the period of the reference rate differ: in this case benchmark analysis must be performed in respect of the change in the cash flows. If the difference between the estimated cash flows is material, fair valuation must be applied. For the purpose of recording the instruments – in addition to the transaction interest – the effective interest rate must be also defined, which is an internal rate of return, which may be used for discounting the contractual cash flow due at different dates to the initial principal amount of the loan, while the difference between the transaction and effective interest rates is recognised gradually during the term (amortised) in the current cost (Madarasiné et al. 2017:55–59). The effective interest rate of financial instruments also plays an important role when establishing loan impairments, upon discounting the future cash flows payable by the borrower to present value. The composition of loans by valuation method is illustrated by Table 5.
Table 5
Changes in and distribution of outstanding lending by valuation method 1 January 2018 31 December 2018
Loans HUF billions per cent HUF billions per cent
Loans valued at amortised cost (AC) 15,163 98.9 16,883 99.2
Loans valued at fair value 171 1.1 142 0.8
Total loans 15,334 100 17,025 100
Source: Data reporting ordered based on MNB (2018a)
As part of the transition to IFRS 9, credit institutions conducted the SPPI test, based on which at the beginning of 2018 98.9 per cent of the outstanding lending satisfied the prescribed conditions, and thus they were stated at amortised cost at year-end.
Fair valuation had to be applied on a mandatory basis for the remaining portfolio (merely 1.1 per cent) and the value change was recognised through profit/loss.
Within the total outstanding lending as at the end of 2018, the ratio of loans valued at amortised cost rose by 0.3 per cent to 99.2 per cent.
In the case of loans, fair valuation must be used, for instance, when the reference rate stated in the contract contains leverage as specified in subsection B4.1.9 of the IFRS 9 standard, which during the tenor may overstate the price change in the market reference rates (e.g. reference rate tied to market index), and the cash flows
14Solely payments of principal and interest: proving that during the tenor the instrument contains only principal payments and interest payments directly related thereunto.
so generated may not comply with the notion of interest in the narrow sense. The exposures already impaired upon origination, referred to as POCI 15exposures, were also recognised in the category subject to mandatory fair valuation; in Hungary this must be applied to the non-performing foreign-currency denominated mortgage loans previously converted into forint, in respect of which the MNB also issued a notice.16 On the whole, the valuation effect of these exposures is negligible, also due to the small portfolio.
3.1.2. Securities
In the case of debt securities, the key difference compared to the loans is that almost half of the portfolio is measured at fair value. The securities portfolio of banks contain almost solely – due to their prudent operation – government securities, the market price of which can be measured on a daily basis. Figure 3 shows that at the start of the year, fair valuation through other comprehensive income (FVTOCI) was the most common valuation category, while by the end of the year the portfolio stated at amortised cost prevailed:
15Purchased or originated credit-impaired financial assets
16https://www.mnb.hu/letoltes/forintositas.pdf Figure 3
Valuation method of securities
8.6% 4.5%
51.1% 51.0% 44.4%
40.3%
1 January 2018 31 December 2018
FVTPL FVTOCI AC
FVTPL FVTOCI AC Source: Data reporting ordered based on MNB (2018a)
Valuation through other comprehensive income is justified by the fact that for these liquid securities the business model also includes the intention to sell, in addition to collecting the contractual cash flows. Intention to sell may appear due – among other things – to satisfying a liquidity requirement suddenly appearing during the tenor of the instrument or for the purpose of capitalising on favourable price movements. Based on the 2018 data, it can be established that the ratio of securities measured at fair value decreased, which was partly attributable to the realisation of formerly profitable positions.
Other comprehensive income
Other comprehensive income (OCI) is stated separately from the net income of the financial year. It includes unrealised profit/loss components resulting from fair valuation, which could make the net income of the financial year – mostly monitored by investors – volatile, and thus it is justified to present these items separately in the statement of other comprehensive income. These include, among other things, the valuation differences from the mark-to-market valuation of real properties, the positive or negative fair value adjustment of equity stakes/
debt instruments, the fair value adjustments of certain hedging transactions and the fair value adjustments stemming from the credit institution’s own credit risk.
The accumulated amount of these appears directly both in shareholders’ equity and own funds (as accumulated other comprehensive income), which will be dealt with also upon presenting the shareholders’ equity items. Separation of the two income categories is also important for the purpose of dividend payments, as such may only be made from net income.
FVTOCI securities are always stated in the balance sheet at fair value, while the difference between the prevailing market value and the amortised cost is shown in shareholders’ equity as accumulated other comprehensive income. The deferred tax effect related to the valuation difference must be also recognised here for these items. For the purpose of determining the valuation difference of securities valued through other comprehensive income it is also necessary to keep continuous records – in addition to the market value – of the amortised cost, which also serves as a basis for recognising the interest incomes stated in the profit and loss account.
Upon derecognition of the instrument, the valuation difference recorded in the principal is realised and must thus be transferred from other comprehensive income to net income. FVTPL securities typically include instruments held for trading from the outset (predetermined, regular and frequent sales), but the fair value option may be used here as well upon initial recognition. Subsequent reclassification between the individual valuation categories is permitted only in exceptional cases, upon the change of the business model, which also limits the possibility of regulatory arbitrage (e.g. upon the occurrence unrealised loss reclassification of the instrument measured at fair value to amortised cost).
3.1.3. Equity stakes
Equity instruments are essentially subject to mandatory fair valuation. Exemption may be given in certain cases, e.g. in the case of equity stakes included in consolidation. If the fair value cannot be estimated reliably, application of the historical cost approach is permitted for the best estimation of the fair value.
The distribution of equity stakes by the methods of fair valuation is illustrated by Figure 4:
Based on the data reporting related to the end of 2018, it can be established that the ratio of equities measured at fair value through profit and loss rose substantially.
Equities on the asset side are stated at the prevailing fair value, while on the liability side the valuation differences are stated as valued through profit or loss or through other comprehensive income. In the latter case, the fair value appears in the other comprehensive income as the (positive/negative) difference of the fair value and the amortised cost. Upon derecognition of these equities it is not permitted to transfer the valuation difference back to net income (while this must be done in the case of debt instruments), as it forms part of the prevailing equity.
3.1.4. Derivatives
For banks using IFRS for the first time, the valuation differences related to derivatives is a new element in the balance sheet. Compared to the earlier Hungarian accounting standards this may be regarded as a novelty only in the sense that the application of fair valuation is now mandatory on a uniform basis,
Figure 4
Fair valuation of equity instruments
0 10 20 30 40 50 60 70
Per cent
Fair value through profit or loss (FVTPL) Fair value through other comprehensive income (FVTOCI)
1 January 2018 31 December 2018 Source: Data reporting ordered based on MNB (2018a)
rather than an option. The fair value adjustment of derivatives must be recognised through net income, under assets (positive valuation difference of a profit nature) or under liabilities (negative valuation difference of a loss nature). Banks conclude, typically with credit institution counterparties, over-the-counter deals for trading or hedging purposes (e.g. interest rate or foreign exchange swaps). However, under IFRS 9 strict rules apply to the inclusion in a hedging relationship. Accordingly, hedging transactions in the economic sense are often17 stated in the banks’ balance sheets as held for trading, due to the absence of hedging documentation or hedge effectiveness. Inclusion in a hedge is also complicated by the fact that the hedging relationship must be documented in detail already upon the origination of the transactions and the hedge effectiveness must be presented on a continuous basis (E&Y 2014). This also means that upon the existence of the hedging relationship, the change in the fair value of the hedging and hedged transactions must move closely together during the tenor, in different directions (it must be effective). The fair value of derivatives is typically calculated by considering some kind of valuation input (e.g. the market yield curve determining the valuation of the instrument), by discounting the expected cash flows.
3.1.5. Deferred tax assets
The requirements related to the accounting treatment of deferred tax assets are included in the standard IAS 12 (International Accounting Standards, IAS) on income taxes (European Commission 2012). Since these are also subject to special supervisory treatment, it is justified to present the difference in more detail.
Deferred tax assets arise from the different valuations of assets and liabilities according to accounting and taxation laws (e.g. temporary differences arising after fair valuation). The future tax effect of the valuation differences thus arising appear as deferred tax. Deferred tax assets also include unused tax loss and tax credits, which may be used to reduce future tax liabilities.
The asset or liability nature of the deferred tax depends on the type of the temporary difference (of a profit or loss nature) and the type of the underlying balance sheet item (asset/liability). Based on this there may be deductible (generating deferred tax assets) or taxable (generating deferred tax liabilities) differences. The nature of the temporary differences are summarised in Table 6:
17Roughly 30 per cent of the valuation differences of transactions classified as held for trading related to economic hedging transactions (based on the MNB F10 consolidated data reporting for end of 2018).
Table 6
Types of temporary differences
Asset Liability
Book value > Tax value Taxable Deductible
Book value < Tax value Deductible Taxable
Book value = Tax value Neutral Neutral
Source: Edited based on IAS 12
Deferred tax assets may include, for instance, impairments/provisions not recognised by the taxation law, or tax effects calculated on the negative fair value adjustments on the assets side. Deferred tax liabilities may include the positive fair value adjustment on the assets side or the recognition of development reserves (BDO 2014). A recognised deferred tax asset reduces the tax liability payable in the future, while a deferred tax liability will increase the tax payable in the future. One special rule is that the deferred tax on items stated in other comprehensive income must be shown in the balance sheet under the related item. Such cases include the deferred tax liability payable on the positive fair value adjustment of government securities measured at fair value through OCI (temporary difference).
Due to the high degree of uncertainties inherent in deferred tax assets (usability – of annually varying degree – based on business plans, time constraints, change of tax rate), the prudential regulations (Articles 36 and 48 of CRR) treat deferred tax assets that increase the profit/loss more strictly. These items must be allocated to categories defined by CRR (depending/not depending on future profit/loss;
temporary/non-temporary difference). Depending on the nature of the item, upon quantifying the capital adequacy ratio, risk weighting and/or deduction from own funds must be applied, a summarised overview of which is presented in Table 7.
Table 7
Types of deferred tax assets and their supervisory treatment Deferred tax assets
Type Supervisory treatment under CRR
Non-temporary differences depending on future
profit/loss (tax loss carry forwards) Must be fully deducted from own funds, and thus no risk weighting is necessary.
Temporary differences depending on future profit/
loss
Deductible over specified limits (adjusted CET1 capital 10, 15 per cent), while for the part below the limit higher risk weight is to be applied.
Temporary differences not depending on future
profit/loss No obligation to deduct; 100 per cent risk
weighting is to be applied as exposure.
Tax overpayments; current year tax losses of the
institution carried back to previous years Generates current-year receivable from the tax authority, 100 per cent risk weight is to be applied
3.2. Liabilities
Customer deposits account for the largest part of the banks’ outstanding liabilities (almost 80 per cent). Based on Table 8 it can be found that in 2018 the rise in outstanding liabilities was also mostly caused by the increase in deposits.
Table 8
Change in the balance of liabilities in 2018 and its structure
1 January 2018 31 December 2018
Liabilities HUF billions per cent HUF billions per cent
Deposits 21,713 79.0 23,732 79.4
Loans taken 3,667 13.3 3,697 12.4
Issued securities 1,084 3.9 1,244 4.2
Derivatives 377 1.4 372 1.2
Other liabilities 656 2.4 843 2.8
Total liabilities 27,497 100 29,888 100
Source: Data reporting ordered based on MNB (2018a)
In addition, a minor rearrangement of the liability structure can be observed from refinancing loans to the benefit of issued securities. Thus, the surge in lending by banks, observed on the assets side, was typically financed by customer deposits – which are more stable than the interbank funds – and this is favourable in terms of liquidity. On the liability side, deposits and other liabilities are typically measured at amortised cost, while derivatives (loss-type differences) are subject to mandatory fair valuation. In exceptional cases, it is permitted to apply the fair value option for liability-side items as well, if there is some kind of accounting inconsistency. On the whole, it can be stated that valuation at amortised cost should be applied for the vast majority of liabilities (98.1 per cent); fair valuation appears only optionally (1.9 per cent) for some kind of hedging purpose, and thus it usually does not cause any major volatility in values.
3.3. Shareholders’ equity
Shareholders’ equity serves the safe operation of banks, and as such it is a starting point for determining own funds. Usually, the already realised capital elements (e.g.
subscribed capital, capital reserve, retained earnings) can be included in full, while within accumulated other comprehensive income, which also contains unrealised
capital elements, prudential adjustments must be applied in certain cases. The components of and changes in the shareholders’ equity are presented in Table 9.
Table 9
Change in the balance of shareholders’ equity in 2018 and its structure
1 January 2018 31 December 2018
Equity HUF
billions per cent HUF
billions per cent
Paid-up subscribed capital 685 18.9 685 17.6
Share premium 581 16.0 545 14.0
Accumulated other comprehensive income (OCI) 170 4.7 90 2.3
Retained earnings 1,527 42.2 1,738 44.7
Profit or (-) loss of the financial year 412 11.4 515 13.2
Other 246 6.8 314 8.1
Total equity 3,620 100 3,885 100
Source: Data reporting ordered based on MNB (2018a)
The data in Table 9 show that the equity increment is the result of profitable operations and the increase in retained earnings. It is also clear from the change in OCI in 2018 (decline of 53 per cent) that the portfolio may be extremely volatile, since it mostly contains yet unrealised profit elements (e.g. upon an interest rate increase the fair value of fixed-securities measured at fair value may decrease, or upon sales the difference is realised). The decrease was essentially attributable to the valuation difference of debt securities. The OCI reserve represents the accumulated fair value adjustment of the financial instruments valued through other comprehensive income, but the fair value adjustment of certain hedging transactions also should be allocated to this category (e.g. cash flow hedge effective portion). Depending on the changes in the market price, the fair value adjustment related to financial instruments may be both positive and negative.
For supervisory purposes, the unrealised capital gains/losses, which are stated in accumulated other comprehensive income, fully form part of the own funds. By contrast, the impact of the unrealised valuation differences recognised through net income (e.g. change in the foreign exchange rate) appears later in time, after the mid-year/year-end audit of the financial statements, if the accumulated profit/
loss is positive. If the net profit/loss is a loss, it must be deducted from the own funds. International forums disagreed for a long time on the possibility of off-setting the unrealised profit/loss elements arising from fair valuation, since many of the actors argued for the former, more conservative measurement (the loss should be deducted from own funds, but the profit element should be ignored (Seregdi et al. 2015:65). Finally, the CRR permitted the full recognition of the unrealised fair value adjustments, but at the same time prudential filters are to be applied in
the future as well for addressing the differences in the accounting and prudential considerations. With this, the scope of the adjustment items – following the previous heterogeneous practices – became uniform in the practice of European institutions18 related to the calculation of own funds (Seregdi 2015:24).
3.4. IFRS-specific elements of prudential filters
Accumulated other comprehensive income forms part of own funds in full. However, it has some special components, the profit/loss impact (be it positive or negative) of which should be eliminated, with special attention to the following IFRS-specific elements:
• Cash flow hedge reserves: it represents the positive or negative fair value of those hedging transactions that may be deemed effective. According to Article 33.1 a) of CRR, the fair value reserves related to gains or losses on cash flow hedges of financial instruments that are not measured at fair value, including projected cash flows, must be eliminated from own funds. This means that if the fair value of the hedging transaction is positive it must be deducted from own funds, and if it is negative, it must be added back to own funds. If the profit or loss on the hedged item is realised, the reserve of the hedging must be transferred to profit/loss, and thus the two items offset each other. The ineffective part of the hedging transaction – if the fair value of the hedging transaction (e.g. +100) exceeds the fair value of the hedged transaction (e.g. –80) – must be recognised immediately through profit and loss. Such transactions may include, for instance, the hedging of (the cash flow change) of a variable-rate issued bond with an interest rate swap. The purpose of the transaction is to avoid the growth in the cost of funds stemming from the increase in interest rates, and thus it swaps the prevailing variable interest for a pre-agreed fixed interest during the tenor. From a supervisory point of view, the problem is represented by the fact that in this way the presentation of the transaction is “one-sided”: while OCI includes the fair value of the hedging transaction, the hedged transaction is stated at amortised cost and thus the fair value changes connected to the cash flows of those do not appear in the balance sheet until such time as the cash flows connected to the bond are realised. Hence, for supervisory purposes, the unrealised items must be eliminated from the own funds.
• Cumulative gains and losses due to changes in own credit risk on fair valued liabilities: a special element of measurement at fair value is that, in addition to the market factors, the bank’s own creditworthiness (non-performance risk) must be also taken into consideration upon the measurement of liability items at fair value.
The measurement of liabilities at fair value may take place based on a business model (instrument held for trading) or upon applying the fair value option. Part
18Credit institutions and investment firms falling under the scope of CRR
of the change in the fair value originating from own credit risk (e.g. the impact of the rise in the risk spread of the issuer of the bond) must be stated in the OCI reserves, if it does not cause major accounting inconsistency. Thus, situations may occur when – via a decrease in the value of liabilities – the increase in the bank’s own credit risk leads to a rise in shareholders’ equity. Recognition of these items cannot be justified from a supervisory point of view, since upon liquidation of the bank the debtor’s actual receivable does not decrease, and hence the capital element thus recognised has no loss-bearing capacity. Accordingly, the valuation changes arising from the change in own credit risk must be eliminated from the own funds (BCBS 2012).
• Fair value gains and losses arising from the institution’s own credit risk related to derivative liabilities: a similar situation also arises for liability-type derivatives when a deterioration in the bank’s credit risk improves the profit/loss via a decrease in the fair value of the liability, which also has an undesirable positive impact on the capital position (BCBS 2012).
4. Impairment under the IFRS 9 requirements
4.1. Supervisory considerations and experiences
The transition to IFRS 9 resulted in major changes, representing progress in the definition of the impairment requirements, in addition to the classification and valuation of the instruments. Namely, the former loss impairment concept, based on objective evidence – used by the IAS 39 standard (European Commission 2008) – was replaced by the approach based on expected losses, which attempts to address the “too little and too late” recognition of impairment during the crisis.
Accordingly, under IFRS 9 the expected loss concept – on the whole – narrows the earlier gap between accounting and prudential expected losses (Balázs -Tardos 2006). The Basel Committee on Banking Supervision expects that the transition will reduce the former regulation’s procyclicality strengthening nature. Since the former requirements only prescribed statement of already incurred losses, in the descending branch of the economic cycles this exacerbated banks’ financial situation through abruptly recognised, large amounts of impairments (Novotny- Farkas 2015:31–32). The losses had an unfavourable impact on and curbed the risk appetite of market participants. However, the supervisory objective is to ensure that banks are well capitalised and support economic growth through lending even in the event of a financial crisis. This is why they must prepare in due course to cover the expected losses and recognise the necessary impairments to prevent them from burdening banks’ own funds all at once. This is further supported by
the countercyclical capital buffer measures introduced in the meantime,19 based on which in the event of overheating in the economy banks must recognise capital buffers, which they may use during economic downturns to maintain their lending activity (MNB 2015). The new standard strengthens the forward-looking nature of the impairment by prescribing various macro variables and scenario analyses, creating impairment models, taking into consideration broader credit information and breaking down impairment into three stages. In order to determine the impairment, the individual portfolio elements must be classified based on the following key criteria:
Stage 1: This includes assets of low risk from the outset, or for which the credit risk has not yet increased significantly since initial recognition. The expected loss must be quantified setting out from the defaults expected in the next 12 months (12-month expected loss). The standard does not preclude zero impairment, but it may be applied only in exceptional cases.
Stage 2: If the credit risk of the transaction has increased materially since initial recognition (underperforming loans), it must be reclassified to Stage 2. It is expected in all cases that the monitoring information available under the debtor and transaction rating are taken into consideration in full. The change can be typically identified on the basis of the rise in the probability of default (PD20). Impairment must be recognised from Stage 2 for the full life time of the transaction (for the expected losses arising from the defaults occurring during the entire term). For assets classified from the outset with low credit risk it is not necessary to identify the rise in credit risk, but this may take place only in exceptional cases.
Stage 3: If a transaction can be classified as impaired for the purpose of accounting, it must be reclassified to Stage 3, for which the standard provides specific examples (e.g. financial difficulties of the client, start of liquidation). The accounting impaired category is roughly the same as the impairment recognised on the basis of objective evidence under IAS 39, and thus the additional impairment recognised in Stage 2 may represent the biggest change compared to the previous practice.
Naturally, the individual categories are not static, they are continuously changing (Figure 5).
19Capital buffers are capital requirements of macroprudential nature, in addition to Pillar 1 and 2, which must be satisfied by the highest quality (CET1) capital elements.
20Probability of default: the probability of a client becoming non-performing within one year.
In analysing the movements in 2018, it can be seen that the most frequent reclassification occurs between Stages 1 and 2 and that 72 per cent of the movements are related to these two categories. The higher the impairment category the instrument has been allocated to, the lower the probability of reclassification to a lower category. While 25 per cent of the movements related to improvement from Stage 2 to Stage 1, only 6 per cent of the movements can be linked to recovery from Stage 3. It may happen that the instrument immediately switches two categories (between Stages 1 and 3), but in the present ascending lending cycle this occurs much less frequently; usually a gradual deterioration can be observed.
Stages 1 and 2 are characterised by group, portfolio level rating, while in Stage 3 impairment recognition at the individual transaction level becomes more common as a result of the better availability of individual information implying losses. In assessing impairment at group level, it is an important requirement to create homogeneous portfolios with identical credit risk characteristics in advance, while the expected loss is calculated by taking account of the observed probability of default (PD), the loss given default (LGD21) and the exposure at default (EAD22),
21Loss given default: the ratio of the loss arising from the client’s default relative to the exposure outstanding on the date of the default.
22Exposure at default: the exposure outstanding at the time when the default occurs.
Figure 5
Distribution of movements in 2018 between the individual impairment stages
0 5 10 15 20 25 30 35 40 45 50
0 5 10 15 20 25 30 35 40 45
Per cent Per cent 50
1–>2 2–>1 1–>3 3–>1 2–>3 3–>2
Source: Data reporting ordered by MNB (2018a)
typically on the basis of impairment model (e.g. setting out from historical loss rates). However, historical experience may only serve as a starting point and must be adjusted in accordance with the expectation of the standards, also taking into consideration the lending cycle and future expectations, which represents one of the greatest challenge for banks.
Among other things, the new requirements include the consideration of macro variables, the preparation of at least two scenarios (with positive and negative outcome) and the definition of the related probability weights. Subsequent testing of the models is an important requirement, according to which the results of the impairment model must be compared (backtested) annually to the actual empirical data. The assumptions of the model must be adjusted as necessary, which may be regarded as an iteration process, while the results of the backtesting must be regularly approved by an internal, independent organisational unit. This requirement also appears in Article 174.d) of CRR, for the internal rating based (IRB) risk parameters used in the supervisory capital calculation.
In the course of supervisory monitoring, the relationship between the individual impairment stages and overdue items deserves special attention. Namely, the standard relies on the rebuttable assumption that a significant increase in credit risk occurs, at the latest, when the loan is past due over 30 days (reclassification to Stage 2) and after 90 days the transaction becomes impaired (reclassification to Stage 3). Thus, when reclassification is not performed and the related higher impairment is not recognised, the entity must be able to justify this. Another important audit criterion is the comparison23 of the definitions used for default, since there may be major definition differences in practice (Bholat et al. 2016:23–
25), which must be specified. It may be practicable to harmonise the definitions which are close to each other (e.g. the notion of accounting impaired and supervisory default/ non-performing). One of the key criteria is to identify the increase in credit risk in due course, during which all relevant, available and forward- looking information must be taken into consideration, in respect of which the MNB also published an Executive Circular.24
The distribution of the loan portfolio among the impairment stages is an important supervisory issue, and the level of the related coverage by impairment must be also monitored; the relevant changes in 2018 are illustrated in Figure 6.
23“Non-performing” as per the MNB Decree (MNB 2016), “default” under Article 178 of CRR, “impaired” in Appendix A to IFRS.
24Executive Circular on using macroeconomic information and the factors indicating a significant increase in credit risk under the IFRS 9 standard (https://www.mnb.hu/letoltes/ifrs9-vezetoi-korlevel.pdf).
The data in Figure 6 show that roughly 90 per cent of the total bank portfolio belong to the best category of Stage 1, where no significant increase in the credit risk can be identified. Accordingly, the coverage by impairment is also the lowest here, i.e.
at 0.5 per cent on average. As regards 2018, by the end of the year the share of Stage 2 had increased, but at the same time this was accompanied by a decline in the average coverage by impairment, which may have been also attributable to fine-tuning of the newly-introduced model-based methodologies. Coverage by impairment decreased slightly by the end of the year in Stages 2 and 3. For supervisory purposes, regular monitoring of the portfolios and analysis of outliers from the market average bear the utmost importance.
The experience gained so far in relation to the transition shows that upon determining the expected loss, as prescribed by IFRS, it was primarily the smaller banks using the standardised approach for capital calculation (formerly not modelling PD and LGD factors) that faced greater challenges. For these banks, the lack of databases related to historical empirical data and the provision of the human and IT resources necessary for the development of the models represented a general problem. In relation to the transition, the standard permits simplifications
Figure 6
Distribution of the loan portfolio and coverage by impairment by stages
0.5% 0.4%
6.3% 3.0%
60.6%
56.2%
0 10 20 30 40 50 60 70 80 90
% % 100
0 10 20 30 40 50 60 70 80 90 100
31 March 2018 31 December 2018
Stage 1 Stage 2 Stage 3
Coverage stage 1 Coverage stage 2 Coverage stage 3 Source: Data reporting ordered by MNB (2018a)
(e.g. classification based on the number of days past due), but it emphasises that those should be applied as exceptions rather than as a general practice. The missing empirical data can be typically replaced by external, purchased databases.
In most cases, the increase in credit risk occurs already before the transaction becoming past due, since the delay – according to the standard – is usually only the subsequent symptom of the client’s payment difficulties, and as such it is unsuitable for enforcing the forward-looking approach. However, the timely identification of the rise in credit risk requires an extensive customer rating and monitoring system, which necessitates the continuous enhancement of the risk management tools.
Banks that use the IRB approach already had impairment models before the transition and also had to quantify the risk parameters underlying the expected loss (PD, LGD, EAD). However, during the estimation of the parameters, the accounting and prudential objectives may differ here as well (Table 10).
Table 10
Accounting and prudential differences in the estimation of risk parameters
IFRS 9 CRR
PD
Measurement period 12-month (stage 1)
12-month Lifetime (stages 2,3)
Sensitivity to cycles Sensitive to business cycles (point in time, PIT) with forward-looking information (macro indicators)
Cross business cycles (through the cycle, TTC)
LGD/EAD
Basis of estimation
Estimation aligned with currently expectable business cycles with forward-looking information (macro indicators)
(Downturn) estimation based on economic recession
Source: BCBS 2016
In the modelling of PD, two types of approaches developed in international practice:
the cross business (credit) cycles (TTC, through the cycle) approach expected by the supervisory authority, and the method considering the changes in the cycles and capturing the changes in the near future (PIT, point in time). The impairment logic of IFRS 9 is closer to the PIT approach. The PIT approach takes into consideration the changes in the credit cycles and thus results in more volatile impairment. By contrast, the TTC approach assesses the probability of default based on a worst-case scenario, which represents a more balanced impairment level independent of cycles.
Accordingly, the customer rating category using the PIT approach improves and deteriorates together with the credit cycle, while the TTC rating takes a relatively stable risk value. The time horizon of the PD estimation also differs: the supervisory authority asks for a forward-looking PD estimate for 1 year, while in accounting the probabilities of default expected during the lifetime of the transaction must be also taken into consideration. Upon estimating the loss given default, in the