Establishment of relationships between native and inhalation device specific spirometric parameters as a step towards patient tailored inhalation device
selection
Árpád Farkas1, Annamária Szipőcs2, Alpár Horváth3,4, Ildikó Horváth5, Gabriella Gálffy4, János Varga5, Kristóf Galambos6, Szilvia Kugler6, Attila Nagy6, Zsuzsanna Szalai2
1Centre for Energy Research, Hungarian Academy of Sciences, Konkoly-Thege Miklós út 29- 33, 1121 Budapest, Hungary
2Petz Aladár County Teaching Hospital, Pulmonology Department, Vasvári Pál u. 2-4, 9024 Győr, Hungary
3Chiesi Hungary Ltd., Dunavirág u. 2, 1138 Budapest, Hungary
4County Institute of Pulmonology, Department of Pulmonology, Munkácsy M. u.70, 2045 Törökbálint, Hungary
5National Koranyi Institute for Pulmonology, Pihenő u. 1, H-1121 Budapest, Hungary
6Wigner Research Centre for Physics, Hungarian Academy of Sciences, Konkoly-Thege Miklós út 29-33, 1121 Budapest, Hungary
Keywords: management of COPD patients, personalized device selection, patient and device specific spirometric parameters
Corresponding author:
Árpád Farkas
Centre for Energy Research, Hungarian Academy of Sciences Konkoly-Thege Miklós út 29-33, 1121 Budapest, Hungary farkas.arpad@energia.mta.hu
2 Abstract
Introduction
Drug emission from DPIs is dependent on the inspiratory flow parameters through them, which are not directly measured by standard spirometry. Their estimation based on native spirometric data could help in choosing the appropriate device and optimizing the drug deposition.
Objectives
The aim of this study was to survey patient preferences and to find correlations between breathing parameters of COPD patients through DPI devices and their baseline spirometric data, age, gender, disease severity and anthropometric characteristics. Another objective was to establish relationships between peak inspiratory flows (PIFdev) through Breezhaler®, Genuair® and Turbuhaler® inhalers and their determinants.
Methods
Breathing parameters of 49 patients with previously diagnosed COPD and currently using one of the above inhalers were recorded by normal spirometry and while inhaling through the selected DPIs. Statistical analysis of the measured data was completed. All specific data are provided as (mean ± standard deviation).
Results
More than 60% of the patients stated that their current device is the easiest to use. The means of the measured PIFdev values were 91.4 L/min, 77.1 L/min and 77.5 L/min for Breezhaler®, Genuair®, and Turbuhaler®, respectively. PIFdev were significantly higher for males than for females, but differences upon age, BMI and disease severity group were not significant (at p=0.05). Peak inspiratory flows through the inhalers (PIFdev) correlated best with their native spirometric counterparts (PIF) and linear PIFdev-PIF relationships could be determined (Breezhaler®: r=0.60, p=0.002, Genuair®: r=0.55, p=0.001, Turbuhaler®: r=0.57, p=0.002). Physical background of the deduced equations was also provided.
Conclusions
Present correlations may be used to assess the success of inhalation of COPD patients through the studied devices and to choose the appropriate device for each patient. As a consequence, the amount of the drug emitted by the device can be optimized, the deposition efficiency within the lungs increased and the related therapeutic effect improved.
3 Introduction
Aerosol drugs play a key role in the treatment of airway diseases, especially asthma and COPD. Due to the rise in the number of asthmatics and COPD patients the market for aerosol drugs is also increasing. This expansion triggers intensive drug and device developments. The release of bicomponent, and recently even tricomponent fixed combination drugs further enhanced the number of available device-drug pairs. In addition, concomitant with the expiration of several original drug licences in the last couple of years an increasing number of generic aerosol drugs are being introduced into the market. Due to the high and continuously enhancing number of available device-drug combinations and admitting that every patient is different (physical and mental capacity, disease type and severity etc.), it is more and more difficult to choose the right device and medication for each patient. The absence of an ‘ideal device’ and the difficulties in choosing the ‘right device’ has been recognized also by major respiratory societies (European Respiratory Society, International Society for Aerosols in Medicine, American Thoracic Society), who are trying to formulate principles and recommendations in this field [1]. Besides cognitive ability and dexterity of the patients inhalation characteristics should be a major determinant of device selection. Due to the broad spectrum of available devices even in the case of pressurized metered dose inhalers (pMDIs), where the emitted dose and aerosol particle characteristics are not functions of the patient’s breathing capabilities, the selection of the drug and device providing optimal lung deposition is not a trivial task. The situation becomes even more complicated in the case of dry powder inhalers (DPIs). The emitted amount of drug and the detachment of active pharmaceutical ingredients (APIs) from the carriers can be highly influenced by the breathing parameters of the patients [2]. Weak inhalation force of the patient may lead to low emitted dose, insufficient API detachment and poor therapeutic outcome. Although lung function data is usually available at the moment of drug prescription, how these data convert into breathing performance through different DPIs is far from trivial. In practice, the breathing parameter values that a patient would produce through different inhalation devices are not available to the doctor and it is practically not possible to acquire them for each patient and device due to several reasons, such as technical difficulties, consultation time constrains and so on. It is worth noting that the In-Check/In-Check Dial device (Clement Clarke International) may partly overcome this problem and also serve as a training tool. Based on the studies available in the open literature this peak flow meter proved to be both useful and reliable [3]. However, the device is not available everywhere, requires the cooperation of the patient, does not include all the inhalers available on the market (although the latest version contains many of
4
them and classes of devices upon resistance ranges have been introduced) and still requires some time to perform the flow measurements. In addition, the device does not provide information on other predictors of inhaler usage or lung deposition. Among other developments in the field of patient breathing capability assessment and training tools it is worth noting Vitalograph’s Aerosol Inhalation Monitor AIMTM [4] and the Inhalation Manager [5], [6]. These tools are restricted to a limited number of DPI devices: one medium resistance virtual DPI in the case of AIMTM and five real DPIs (Diskus®, Turbuhaler® at the beginning, then extended with Easi-Breathe®, Novolizer® and Spiromax®) in the case of Inhalation Manager.
An alternative way of assessing patient’s breathing capabilities through different DPIs would be to find statistically significant correlations between relevant breathing parameters through different DPIs and native lung function data. If reasonable, these functions could be established separately for different subgroups of populations upon certain demographic indicators or based on disease types and disease severity classes. A software linked to the outputs of lung function tests using the relationships between device specific and baseline spirometric breathing parameter values for several devices could then instantly predict the ability of a given patient to appropriately inhale through different DPI devices. Such a tool may assist medical practitioners at least in excluding some devices, but hopefully also in choosing the most appropriate device-drug pair. There is only a limited number of studies in the open literature following this approach. The subjects of these studies were patients with different lung diseases (COPD, asthma, neuromuscular disease) using Turbuhaler® [7-9].
Diskus®/Accuhaler® [7-9], [10], Easyhaler® [11] and Aerolizer® [7] DPIs. In these studies the main emphasis was put on finding correlations between different spirometric, demographic and anthropometric parameters, however, with the exception of the work of Kawamatawong et al. [9] and to some extent Seheult et al. [10] the possibility of making predictions related to correct inhaler use of patients who did not participate in the study based on the analysed data was not explored.
The general scope of our work was to measure and analyse baseline spirometric data and device specific breathing parameters of COPD patients for three different commercialized DPIs. We aimed to establish relationships between the two groups of parameters with predictive power regarding inhaler suitability. The special goal of this study was to establish the conditions for exceeding the device-specific minimum flow rate thresholds.
5 Methods
The experimental measurements of the present study were performed at the Pulmonology Department of Petz Aladár County Teaching Hospital (Győr, Hungary) based on the protocol approved by the Regional Science and Ethics Committee (approval number: 76-1-20/2017).
Forty-nine adult patients (21 females and 28 males) with previously diagnosed COPD of different severity degrees (GOLD grade B, C and D) were recruited. Written consent was obtained from all participants. The patients were on medication in the period preceding the measurements (for at least 3 months) taking aerosol drugs emitted by one of the Breezhaler®, Genuair® or Turbuhaler® DPIs. The only exclusion criterion was the capacity of the patients to comply with the instructions. Patient baseline lung function variables were recorded. Table 1 summarizes these data in addition to patient demographics.
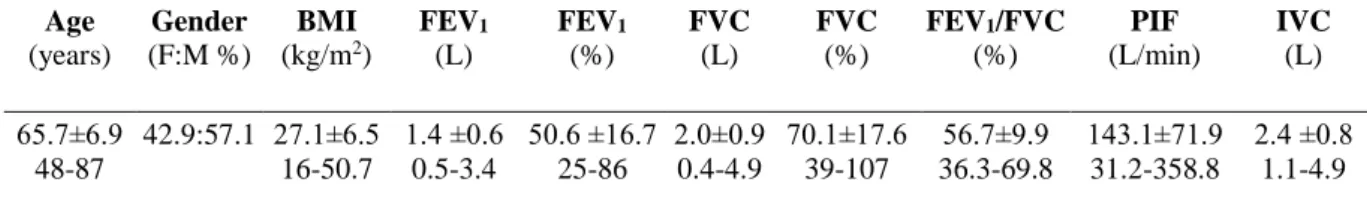
Table 1. Summary of patient demographics and baseline lung function data. Mean values with standard deviations (first row) and ranges (second row) for the population of 49 patients are provided. BMI – body mass index; FEV1 - expiratory volume at the end of the first second of forced exhalation; FVC – forced vital capacity; PIF – peak inhalation flow; IVC – inspiratory vital capacity
Age (years)
Gender (F:M %)
BMI (kg/m2)
FEV1
(L)
FEV1
(%)
FVC (L)
FVC (%)
FEV1/FVC (%)
PIF (L/min)
IVC (L) 65.7±6.9
48-87
42.9:57.1 27.1±6.5 16-50.7
1.4 ±0.6 0.5-3.4
50.6 ±16.7 25-86
2.0±0.9 0.4-4.9
70.1±17.6 39-107
56.7±9.9 36.3-69.8
143.1±71.9 31.2-358.8
2.4 ±0.8 1.1-4.9
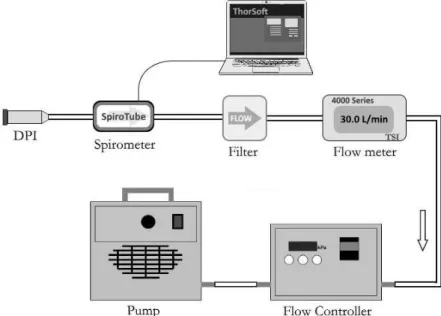
Breathing parameters of the same patients were also documented while they used the above three inhalation devices by Otthon IdegenTM Mobile Handheld Spirometer of Thor Laboratories (Budapest, Hungary), which was connected to the DPIs (between the patient and the inhaler). Patients were instructed on the use of the devices in accordance with the patient information leaflets. The order of the devices used in the inhalation experiments was randomized among the patients. Original inhalation devices were used to ensure realistic airflow resistances. However, the DPIs were emptied from the drugs to make sure that no active substance is inhaled by the patients during the experimental measurements. After inhaling through the devices patients were asked to provide an order among the devices based on their subjective preference and on how easy it was to inhale through them.
The spirometer was validated before the measurements on the patients by the connection of each device to a pump providing constant flow rates of 30, 60, 90, 120 and 150 L/min. The flow may become unstable to some extent after passing through the inhalers depending on the inhaler internal resistance and geometry. This may induce some uncertainty of the measured
6
flow rate. In this work, the degree of flow instability was quantified for each device by recording the flow rate with the spirometer connected to the exit of the devices during 10 s, three times for each of the above flow rates. The shape of the curves was statistically analysed and the fluctuations characterized by the calculation of the relative standard deviations of the flow rate. The experimental setup used for this purpose can be seen in Figure 1.
Figure 1. Experimental setup for the validation of the spirometer
The key breathing parameter predicting the ability of the patient to optimally use the device is peak inspiratory flow through the device (PIFdev). The dose emitted by a DPI, the amount of drug containing particles with aerodynamic diameter smaller than 5 m and implicitly the fraction of dose depositing within the lungs are influenced by this parameter.
Minimum requirements in terms of patient inhalation flow rate have been established in the open literature for each of the studied devices. Based on the work of Haidl et al [12] these thresholds are 50 L/min for Breezhaler®, 40 L/min for Genuair® and 30 L/min for Turbuhaler®. By the same token, it was reported by several investigators [13-14] that between 30 L/min and 60 L/min the inhalation from Turbuhaler® is suboptimal, thus 60 L/min is a second threshold for this DPI. The analysis of the dependence of PIFdev for each selected device on patient demographic data (age, gender), anthropomorphic characteristics (height, weight), disease condition (expiratory volume at the end of the first second of forced exhalation: FEV1, forced vital capacity: FVC, Tiffeneau index: FEV1/FVC, GOLD grades), smoking habits (pack years) and baseline spirometric data characterizing the inhalation (peak inspiratory flow: PIF, inspiratory vital capacity: IVC, inhalation time: tin) was performed by an in-depth statistical evaluation of the inter-relationships. Cross-correlation analysis of the
7
above parameters (except gender, and GOLD grades) in connection with each device was performed. Correlations between different parameters were expressed by Pearson coefficients.
Predictors of PIFdev were found by stepwise multiple regression analysis using a backward elimination technique.
Mean PIFdev values of different patient subgroups upon gender, age, body mass index (BMI) and disease stages (GOLD grades) were analysed by conducting two-sample t-tests.
Two age groups were formed. The cut-off age was 65 years, because most of the developed countries have accepted the chronological age of 65 years as a definition of 'elderly' or older person. By the same token, two groups were formed upon BMI by using a cut-off value of 25 kg/m2. Another meaningful cut-off value would be at 18.5 kg/m2, however, only two patients of this study would be in the lowest BMI group, thus this division was ignored. Two groups were analysed also based on disease severity. The first group (GOLD B) included 26 patients and the second group (GOLD C and D) 23 patients.
All statistical analyses have been performed by the application of OriginPro 2018 (version b9.5.0.193, OriginLab Corporation, Northampton, Massachusetts, USA) and Minitab® (version 18.1, Minitab, Inc., State College, Pennsylvania, USA) software packages. A value of p<0.05 was considered significant throughout the study.
Results
Flow rate uncertainty
As mentioned in the Methods section, the presence of DPIs causes some flow disturbance next to the inhaler exit and inherent uncertainties in the flow rate measurements. Figure 2 (upper panel) depicts an example of the fluctuating flow downstream the inhaler (Turbuhaler®) at 60 L/min pump flow rate. Recording and analysing similar plots for Breezhaler® and Genuair® at 30, 60, 90, 120 and 150 L/min (rounded values) pump flow rates gave us the possibility to compute the relative standard deviations, which are depicted in Figure 2 (middle panel). As the figure demonstrates, the uncertainty is device and flow rate dependent. Higher inhalation flow rates are associated with higher uncertainties, but for the same flow rate the uncertainty is the highest for Genuair®, followed by Turbuhaler® and Breezhaler®. It is worth noting that this uncertainty does not affect all inhalation parameters.
It is relevant only in the determination of peak inspiratory flow (PIFdev), but it does not influence the inhalation time and breath-hold time. The inhaled volume (IV) can be determined as the integral of the flow-rate versus time inhalation curve (the area below the
8
inhalation curve). Since fluctuations are with equal probability up and down of the mean value, the area is not affected by them (see the example in Figure 2, bottom panel).
0.0 0.5 1.0 1.5 2.0 2.5 3.0
0 10 20 30 40 50 60 70 80 90 100 110 120
Flow rate (L/min)
Time (s) Turbuhaler® at 60 L/min
0 20 40 60 80 100 120 140 160
0 20 40 60 80 100
Breezhaler® Genuair® Turbuhaler®
Uncertainty (%)
Flow rate (L/min)
0.0 0.5 1.0 1.5 2.0 2.5
0 10 20 30 40 50 60
Flow rate (L/min)
Time (s) Turbuhaler®
Figure 2. Upper panel: Flow rate through Turbuhaler® measured in vitro at 60 L/min constant pump flow rate (only the first 3 seconds are demonstrated); middle panel: Flow rate uncertainties through Breezhaler®, Genuair® and Turbuhaler® as a function of pump flow rate;
bottom panel: In vivo measured sample inhalation profile through Turbuhaler®
9
Basic statistics of the measured breathing parameter values
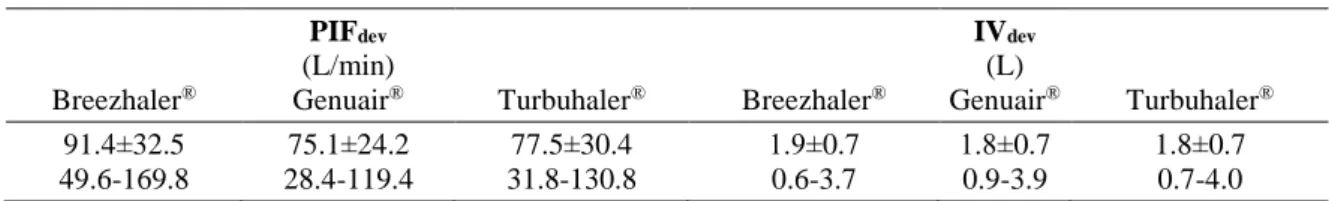
Mean values, standard deviations and ranges of the measured device specific breathing data are presented in Table 2. The mean values of the measured PIFdev were 91.4 L/min, 77.1 L/min and 77.5 L/min for Breezhaler®, Genuair®, and Turbuhaler®, respectively. As the measured values demonstrate, the highest mean peak flow rate was observed for the device with the lowest reported flow resistance (Breezhaler®). At the same time, mean PIFdev through Genuair® was somewhat lower than through Turbuhaler®, though the resistance of Genuair® is slightly lower than that of Turbuhaler®. This suggests that besides flow resistance, other factors may also affect to some extent the usage of DPI inhalers and the resulting peak flow rate (human factors). Based on Table 2 the mean values of the inhaled air volumes through the three devices were quite similar (1.9 L through Breezhaler® and 1.8 L through Genuair® and Turbuhaler®).
The results of the two-sample t-tests on different patient groups are summarized in Table 3.
The statistical analysis revealed that PIFdev values were significantly higher for males than for females for all devices. Although mean PIFdev values were systematically higher for the younger group, the differences were statistically not significant (at p=0.05 level). Similarly, there were no significant differences in mean PIFdev values between BMI groups. There was no significant difference in mean device-specific peak flows between the two patient groups classified upon disease severity, though PIFdev of the more severe COPD group was lower for all devices. Patients with more elevated stage of COPD (GOLD C and D) performed about the same when inhaled through Genuair® and Turbuhaler® (Table 3), while patients from the other group (GOLD B) performed much better through Turbuhaler®, being thus the subgroup responsible for the above mentioned observation (higher mean peak flow rate through the device with slightly lower flow resistance)
Table 2. Summary of measured breathing parameter values through Breezhaler®, Genuair® and Turbuhaler® DPIs. Mean values with standard deviations (first row) and ranges (second row) for the population of 49 patients are provided. PIFdev – peak inspiratory flow while inhaling through the device; IV – volume of air inhaled through the device
Breezhaler®
PIFdev
(L/min)
Genuair® Turbuhaler® Breezhaler®
IVdev
(L)
Genuair® Turbuhaler® 91.4±32.5
49.6-169.8
75.1±24.2 28.4-119.4
77.5±30.4 31.8-130.8
1.9±0.7 0.6-3.7
1.8±0.7 0.9-3.9
1.8±0.7 0.7-4.0
10
Table 3. Results of t-tests on mean inspiratory peak flow rates through Breezhaler®, Genuair® and Turbuhaler® of patients grouped upon gender, age, BMI and GOLD grades. p values are also provided within parentheses. ns – not significant (p>0.05)
Gender (female vs. male)
Age
(<65 years vs. >65 years)
BMI
(< 25 kg/m2 vs. >25 kg/m2)
GOLD (B vs. C+D) mean PIFdev (L/min)
Breezhaler®
78.8; 101.1 (0.02)
98.5; 85.5 (ns)
95.5; 90.5 (ns)
95.0; 86.2 (ns) mean PIFdev (L/min)
Genuair®
65.3; 83.1 (0.04)
78.5; 72.2 (ns)
78.2; 74.7 (ns)
75.4; 72.6 (ns) mean PIFdev (L/min)
Turbuhaler®
66.6; 86.3 (0.01)
83.1; 73.5 (ns)
80.7; 76.9 (ns)
80.7; 72.7 (ns)
Correlation analysis
The results of correlation analysis are summarized in Table 4. As the aim was to find the main predictors of PIFdev, only parameters with significant correlation with PIFdev for at least one of the devices are listed in the table.
Table 4. Pearson correlation coefficients of peak inspiratory flow values through different dry powder inhalers (PIFdev) and standard spirometric peak inspiratory flow (PIF), inhalation time (tin), patient height (h), expiratory volume at the end of the first second of forced expiration (FEV1, in % and L) and forced vital capacity (FVC, in % and L). The corresponding p values are also demonstrated within parentheses. ns – not significant (p>0.05)
PIF (L/min)
tin
(s)
h (m)
FEV1
(L)
FVC (L) PIFdev (L/min)
(Breezhaler®)
0.60 (0.002)
-0.34 (0.02)
0.25 (ns)
0.31 (0.04)
0.36 (0.01) PIFdev (L/min)
(Genuair®)
0.55 (0.001)
-0.32 (0.03)
0.25 (ns)
0.23 (ns)
0.24 (ns) PIFdev (L/min)
Turbuhaler®
0.58 (0.002)
-0.26 (ns)
0.30 (0.04)
0.40 (0.006)
0.39 (0.007)
No significant correlation of PIFdev with patient age and weight, FEV1%, FVC%, FEV1/FVC, IVC and pack years of cigarette could be found for any of the studied devices. Conversely, PIFdev significantly correlated with native PIF for all the three devices. In addition, PIFdev
correlated with tin, FEV1 (expressed in L) and FVC (expressed in L) for Breezhaler® with tin
for Genuair® and with h, FEV1(L) and FVC(L) for Turbuhaler®. According to different classification scales described in De Muth [15] the correlation between spirometric PIF and PIFdev is good/moderate/substantial, while the correlations between PIFdev and tin, h, FVC(L), FEV1(L) (only for some inhalers) are fair/weak/low. To find out the most important predictor(s) of PIFdev for each device a stepwise multiple regression analysis has been performed with PIFdev as the independent variable and the parameters significantly correlating with it (see Table 4). A backward elimination scheme was applied, that is, at each step the independent variable with the highest p value was dropped, until only predictor(s) with
11
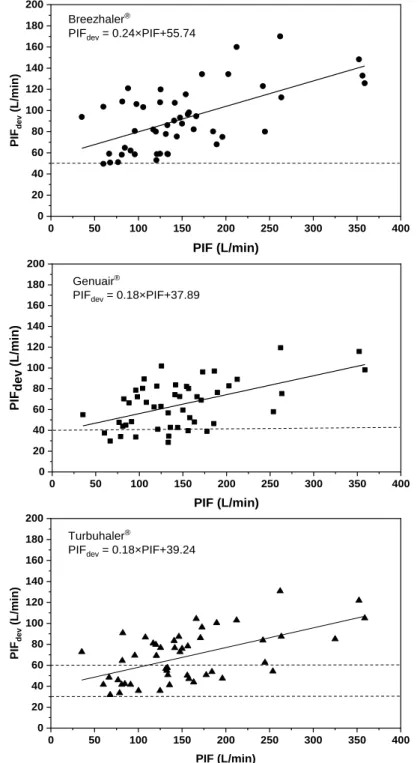
p<0.05 remained. Our analysis has demonstrated that the peak inspiratory flow through a device is best predicted by native peak inspiratory flow, which is measured during standard lung function tests (PIF). All the other independent variables could not be retained if the significance level was set to p=0.05. Figure 3 depicts the relationships between PIFdev and standard spirometric PIF for the three devices.
Figure 3. Dependence of peak inspiratory flow (PIFdev) through Breezhaler® (upper panel, r2=0.36, p=0.002), Genuair® (middle panel, r2=0.30, p=0.001) and Turbuhaler® (lower panel, r2=0.33, p=0.002) on the native spirometric peak inspiratory flow (PIF) based on the statistical analysis of the measurements on 49 COPD patients. Threshold PIFdev values are marked with horizontal dashed lines
0 50 100 150 200 250 300 350 400
0 20 40 60 80 100 120 140 160 180 200
Turbuhaler®
PIFdev = 0.18×PIF+39.24
PIFdev (L/min)
PIF (L/min)
0 50 100 150 200 250 300 350 400
0 20 40 60 80 100 120 140 160 180 200
PIFdev (L/min)
PIF (L/min) Breezhaler®
PIFdev = 0.24×PIF+55.74
0 50 100 150 200 250 300 350 400
0 20 40 60 80 100 120 140 160 180 200
PIFdev (L/min)
PIF (L/min) Genuair®
PIFdev = 0.18×PIF+37.89
12
Based on our measurement results only one patient (out of 49) was unable to generate at least 50 L/min peak flow rate through Breezhaler® (two others only slightly exceeded 50 L/min), 8 individuals failed to reach 40 L/min through Genuair® and all patients had PIFdev
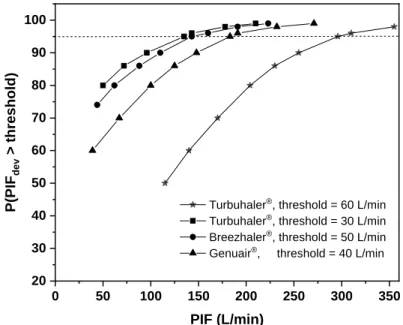
higher than 30 L/min through Turbuhaler®, but 22 subjects did not exceed 60 L/min through this device (see Figure 3). Present regression analysis results can be used also to predict the chances that a patient with known spirometric PIF will exceed the threshold flow rate when she/he inhales through a DPI. Figure 4 demonstrates the probability curves for Breezhaler® (threshold flow rate = 50 L/min), Genuair® (threshold = 40 L/min) and Turbuhaler® (with 30 L/min and 60 L/min thresholds). Based on the statistical results depicted in Figure 4, we can be 95% confident that a patient inhaling through Turbuhaler® will exceed 30 L/min if her/his native PIF reaches 135 L/min. The 60 L/min threshold through the same inhaler requires 295 L/min standard spirometric PIF. Similarly, at 95% confidence level the 50 L/min (Breezhaler®) and 40 L/min (Genuair®) threshold peak flow rates are exceeded if the patient’s native peak flow rate exceeds 143 L/min and 183 L/min, respectively.
0 50 100 150 200 250 300 350
20 30 40 50 60 70 80 90 100
Turbuhaler®, threshold = 60 L/min Turbuhaler®, threshold = 30 L/min Breezhaler®, threshold = 50 L/min Genuair®, threshold = 40 L/min
P(PIFdev > threshold)
PIF (L/min)
Figure 4. Probability of exceeding device specific flow rate thresholds versus native peak inspiratory flow rate for Breezhaler®, Genuair® and Turbuhaler®. For Turbuhaler® both the minimal and optimal thresholds are considered
Patient preferences
At the time of the measurements 40.8 % of the patients under treatment used Breezhaler® (20 patients), 47% Genuair® (23 patients) and 12.2% Turbuhaler® (6 patients). Based on the results of the survey 28 patients stated that Breezhaler® was the easiest to inhale through, 9 individuals opted for Genuair® and 12 subjects mentioned Turbuhaler®. Another important
13
outcome is that 61.2% of the patients (30 individuals) stated that they preferred their current device (they felt that the inhalation through their own device was the easiest), 16.3% (8 patients) placed their actual device on the second place and 22.5% (11 subjects) on the third place.
Discussion
Connections between patient device preferences, inhalation peak flow rates through the devices and device flow resistances
As noted in the Results section, the mean value of PIFdev for the whole study population was the highest for Breezhaler®, the device with the lowest flow resistance. However, mean PIFdev for Turbuhaler® was higher than for Genuair® (77.5 L/min versus 75.1 L/min), though flow resistance of Turbuhaler® is slightly higher than that of Genuair® [16]. It was also shown that this is mostly due to patients from the less severe disease group (GOLD B, see Table 3).
Since the order of the inhalation through the devices was randomly distributed among the patients and there was also sufficient time between inhalations through different devices, the result cannot be a bias due to fatigue. It is interesting that patient’s preferences were in line with the magnitude of the mean inhalation peak flow rate values through the devices:
Breezhaler® the most preferred, followed by Turbuhaler®, then Genuair®, though the difference between the last two was not determinant. Present results suggest that while peak flows through the devices are generally inversely proportional to device resistance, other factors (related mostly to the patients but possibly also to the devices) may also slightly influence the smooth decay of PIFdev with the increase of device resistance.
Relationship between device specific peak flows and age
As presented in the results section, PIFdev failed to significantly correlate with age. This observation may seem to be in contradiction with some results published in the literature.
Malmberg et al. [7], Jarvis et al. [8] and Janssens et al. [11] have found significant negative correlation of the peak flow of COPD patients through DPI devices with age. However, Janssens et al. [7] have demonstrated similar correlation for elderly healthy subjects as well and concluded that decline in PIFdev is due to elevated age regardless to the health status.
Indeed both in the works of Janssens et al. [7] and Jarvis et al. [8] the subjects were much older than is our study (only two patients from our study attained the mean age of 76 years of the subjects in [7]). Separate equations for this age group with age as a predictor besides native PIF could not be deduced in our work because our sample was not representative in the
14
very old category (>75 years), however, this will be an important task in the future. The importance of extending our investigation to higher age range is also highlighted by the fact that subjects from this category are the most likely persons to fail in generating sufficient flow rate. By the inclusion of age as a second significant predictor in the regression equations their predictive power would also increase.
On the predicting power of current results
Based on the results in Figure 4 for each patient characterized by a spirometric PIF value a ranking of the devices can be performed upon the probability of exceeding the threshold flow rate. For instance, if a patient’s spirometric PIF is 140 L/min, then the probability of a satisfactory inhalation flow rate through the device is 88% for Genuair®, 94% for Breezhaler® and 95.5% for Turbuhaler®. There is also a 60% probability that the patient will have over 60 L/min peak flow rate through Turbuhaler®. Unfortunately, the linear regressions in Figure 3 explain only 36% (Breezhaler®), 30% (Genuair®) and 33% (Turbuhaler®) of the variance of PIFdev More data points, especially in the PIF<50 L/min and PIF>200 L/min regions, would enhance the statistical power. In the low PIF region this could be achieved by the inclusion of more subjects with elevated age (older than 75 years). In addition, using equations suggested by physical models or/and considering more predictors could enhance the predicting power of the PIFdev-PIF relationships. Some of these possibilities will be explored in the next paragraphs.
About the physics behind the relationships in Fig. 1
Besides rigorous statistical analysis, it is useful to explore the physical background of the relationship between PIFdev and spirometric PIF for different devices. In order to get insight into the mechanisms behind these relationships one can consider that the pressure drop over the respiratory system is proportional to the flow rate in the laminar flow regime and proportional to the square of the flow rate in the turbulent regime [17]. This observation is in line with the classical Rohrer’s pressure-flow relationship [18]. Since, the resistance of the airways is proportional also to the inverse of the volume [19], considering both the laminar and turbulent parts of the airways the pressure drop can be expressed as
2
0 1 2
Q Q
p k k
V RV V RV
(1),
where p0 is the pressure drop through the airways without any inhaler, Q the flow rate through the airways, RV the residual volume and k1 and k2 constants depending on air
15
properties and airway anatomy. Similarly, considering the resistance of the airways to be connected in series with the resistance of the device the pressure drop developed by the respiratory muscles applied to this system is
2
2
1 2 dev
Q Q
p k k k Q
V RV V RV
(2),
where p is the pressure drop through the airways and the inhaler and kdev the square of device resistance. The last term expresses the pressure-flow relationship through the DPI device deduced by Ower and Pankhurst [20]. Equations (1) and (2) are valid at any moment of the inhalation, thus also for the peaks of the inhalation curves without and with the device (PIF and PIFdev). Obviously, the value of airway volume corresponding to the two peak flows (with device and without it) will be different. Assuming that the patient applies the same forceful inhalation manoeuvre with and without the device, the pressure drop through the airways at peak inspiratory flow without the inhaler equals the pressure drop through the airways and the inhaler at peak flow (pA=pB). Denoting the corresponding airway volumes by V0 and V equations (1) and (2) yield
2 2
dev dev 2
1 2 1 2 dev dev
0 0
PIF PIF PIF PIF
k k k k k PIF
V RV V RV V RV V RV
(3)
The solution of the above second order equation (in PIFdev) is proportional to
2
1 2
1 1 h PIF h PIF
, where h1 and h2 are functions of k1, k2, kdev, VR, V0 and V.
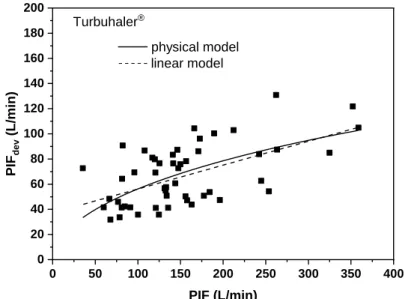
Performing nonlinear fit of the measured PIF values to this expression we get (h1, h2) sets of (66.858, -0.040), (32.967, 0.015) and (33.750, -0.011) for Breezhaler®, Genuair® and Turbuhaler®, respectively. Figure 5 demonstrates the fitted curve for Turbuhaler® (continuous curve) in comparison with the linear fit (dashed line). As it can be seen, the physical model is not very different from the linear model, except below PIF=100 L/min. In this low flow rate region the non-linear fit may be more realistic also because it satisfies the PIFdev(0) = 0 condition, which is not the case for the linear model applied in Figure 3. However, none of the curves can provide predictions outside the interval of the measured PIF values. It is also worth noting however, that purely statistically the physical model is not a better fit of the measured data (standard errors of the two fits are about the same).
16
0 50 100 150 200 250 300 350 400
0 20 40 60 80 100 120 140 160 180 200
physical model linear model
PIFdev (L/min)
PIF (L/min) Turbuhaler®
Figure 5. Comparison of physical and linear models for the prediction of peak flow through
the device (PIFdev) in the case of Turbuhaler®
On the inclusion of native PEF as a predictor of PIFdev
In some studies [9], [11] peak expiratory flow of standard lung function measurements (PEF) was included as a predictor of peak inspiratory flow through the device (PIFdev).
Although intuitively inhalation parameters should be better predictors of PIFdev than expiratory ones, there might be some explanation supporting the inclusion of PEF as well (e.g.
both PIFdev and PEF are measured at maximum effort of more or less the same muscles of the same person). The consideration of PEF is further supported by the significant and relatively good correlation between PEF and PIFdev (Pearson coefficients of 0.34 for Breezhaler®, 0.33 for Genuair® and 0.41 for Turbuhaler®). However, repeating the multiple regression analyses with the inclusion of PEF as one of the independent variables revealed that PEF could not be retained as a predictor of PIFdev for Breezhaler®, Genuair® or Turbuhaler®.
Outlook
Fitting parameters h1 and h2 of the physical model in Figure 5 are functions of device resistance, airway residual volume and airway volume and resistance at peak flow. While device resistance is a constant, airway resistances and volumes could be predictors of PIFdev. However, residual volume and airway resistance were not measured with the handheld spirometer. It would be useful to measure them during future similar works and analyse their correlation with PIFdev.
It was demonstrated by several investigators [21], [22] that besides the peak flow rate (PIFdev) the dose emitted by DPIs, the size distribution of the emitted particles and
17
consequently airway deposition distribution also depend on the inhaled air volume through the device (IVdev) and also on airflow acceleration characterized by the time necessary for the flow rate to reach its maximum (flow rump-up time, tac-dev). In addition, the amount (dose) of drug depositing in different regions of the airways depends on additional breathing parameters, such as the inhalation time (tin-dev) and breath-hold time (tb-h) after the inhalation [23]. Finding the main predictors of these parameters could help us in better predicting airway deposition distributions as criteria for appropriate device choice.
Conclusions
Present study has demonstrated that measuring breathing parameters of COPD patients by standard spirometry and when they inhale through different DPI devices may lead to statistical relationships helping the choice of the appropriate device. Moreover, the predictions on the success of inhalation through a given device can be provided not only for the subjects participating in the study, but practically for any COPD patient whose demographic and standard spirometric data are available and fit in the interval of corresponding data of the study population. It is considered that the most relevant parameter related to the amount of drug emitted by a DPI and to the detachment of drug particles from their carriers is the peak inspiratory flow through the device (PIFdev). Based on the results of the present work, the most important predictor of PIFdev is the baseline peak inspiratory flow (PIF). The linear relationship between the two quantities is supported by physical laws related to the mechanics of breathing, at least in the interval of 100-350 L/min spirometric PIF. To enhance the statistical power of the current results larger populations, especially at the lower end of PIF values, would be needed. In addition, accounting for airway resistance and residual volume could also enhance the predictive power of the established relationships.
Statistically powerful relationships between native spirometric flow parameters and the corresponding quantitites through different DPIs may help the professionals to choose an appropriate device for each patient taking into account the patient’s breathing capabilities. As a result, the dose emitted by the chosen device will be high and the detachment of drug particles from their carriers will be efficient. This may also lead to sufficiently high fraction of particles able to penetrate into the lungs and deposit with high efficiency, reaching the receptors and developing an efficient thrapeutical effect.
18 Acknowledgement
This work has been supported by the KTIA_AIK_12-1-2012-0019 project. The work of ÁF was supported by the Bolyai János Scholarship of the Hungarian Academy of Sciences.
Conflicts of Interest: The authors declare no conflict of interest. None of the authors have shares in any pharmaceutical company. Á.F. and J.V. have received honorarium for presentation from Chiesi Hungary Ltd. A.H. is full time employee of Chiesi Hungary Ltd.
G.G. has received speaker fees from Roche, Astra Zeneca, Boehringer, MSD, BMS, Novartis, Pfizer, Ipsen, Berlin, Chemie, Chiesi, Orion, Mylan. G.G. has been an advisory board member at Roche, Astra Zeneca, Boehringer, MSD, BMS, Novartis, Pfizer, Ipsen, Berlin, Chemie, Chiesi, Orion and Mylan. The funders had no role in the design of the study; in the collection, analyses, or interpretation of data; in the writing of the manuscript, or in the decision to publish the results.
19 References
1. Laube BL, Janssens HM, de Jong FHC, Devadason SG, Dhand R, Diot P, Everard ML, Horvath I, Navalesi P, Voshaar T, Chrystyn H. What the pulmonary specialist should know about the new inhalation therapies. ERS/ISAM Task Force Report. European Respiratory Journal 37: 1308-1331, 2011.
2. Haughney J, Price D, Barnes NC, Virchow JC, Roche N, Chrystyn H. Choosing inhaler devices for people with asthma: Current knowledge and outstanding research needs.
Respiratory Medicine 104: 1237-1245, 2010.
3. Sanders MJ. Guiding Inspiratory Flow: Development of In-Check DIAL G16, a tool for improving inhaler technique. Pulmonary Medicine, Article ID: 1495867, 2017.
4. Sarvis CA, Tice AL, Plake KS. Evaluation of inhaler technique using the Aerosol Inhalation Monitor. Journal of Pharmacy Practice 17: 275-279, 2004.
5. Kamin W, Genz T, Roeder S, Scheuch G, Cloes R, Juenemann R, Trammer T. The Inhalation Manager: A new computer-based device to assess inhalation technique and drug delivery to the patient. Journal of Aerosol Medicine 16:21-29, 2003.
6. Kamin W, Jünemann R. Update Inhalations-Manager – ein computergestütztes Trainingstool für Inhalationspatienten. Pneumologie 69 (S 01), 2015.
7. Janssens W, VandenBrande P, Hardeman E, De Langhe E, Phips T, Troosters T, Decramer M. Inspiratory flow rates at different levels of resistance in elderly COPD patients. European Respiratory Journal 31: 78-83, 2008.
8. Jarvis S, Ind PW, Shiner RJ. Inhaéed therapy in elderly COPD patients; time for re- evaluation? Age and Ageing 36: 213-218, 2007.
9. Kawamatawong T, Khiawwan S, Pornsuriyasak P. Peak inspiratory flow rate measurement by using In-Check DIAL for the different inhaler devices in elderly with obstructive airway diseases. Journal of Asthma and Allergy 10: 17-21, 2017.
10. Seheult JN, Costello S, Tee KC, Bholah T, Al Bannai H, Sulaiman I, Costello RW.
Investigating the relationship between peak inspiratory flow rate and volume of inhalation from DiskusTM inhaler and baseline spirometric parameters: a cross-sectional study.
SpringerPlus 3: 496, 2014.
11. Malmberg LP, Rytila P, Happonen P, Haahtela T. Inspiratory flows through dry powder inhaler in chronic obstructive pulmonary disease: age and gender rather than severity matters.
International Journal of Chronic Obstructive Pulmonary Disease 5: 257-262, 2010.
12. Haidl P, Heindl S, Siemon K, Bernacka M, Cloes RM. Inhalation device requirements for patients’ inhalation maneuvers. Respiratory Medicine 118: 65-75, 2016.
13. Borgström L, Bondesson E, Morén F, Trofast E, Newman SP. Lung deposition of budesonide inhaled via Turbuhaler®: a comparison with terbutaline sulphate in normal subjects. European Respiratory Journal 7: 69-73, 1994.
14. Abdelrahim ME. Emitted dose and lung deposition of inhaled terbutaline from Turbuhaler at different conditions. Respiratory Medicine104: 682-689, 2010.
15. De Muth JE. Basic statistics and pharmaceutical statistical applications. Boca Raton:
Chapman & Hall/CRC, ISBN 9781466596733, Third Edition, 2014.
20
16. Ciciliani A-M, Langguth P, Wachtel H. In vitro dose comparison of Respimat inhaler with dry powder inhalers for COPD maintenance therapy. International Journal of COPD 12:
1565-1577, 2017.
17. Jaeger MJ, Matthys H. Pressure flow characteristics of human airways. In: Airway dynamics, ed. Bouhuys A, Springfield, III: Thomas, 1970.
18. Rohrer F. Der Strömungswiderstand in den menschlichen Atemwegen und Verzweigung des Bronchialsystems auf den Atmungsverlauf in verschiedenen Lungenbezwirken. Pfluger’s Archiv für die gesamte Physiologie 162: 225-299, 1915.
19. Jaffrin M, Kesic P Airway resistance: a fluid mechanical approach. Journal of Applied Physiology 36: 354-361, 1974.
20. Ower E, Pankhurst RC. The measurement of airflow, 5th edition, Ower E Pankhurst, Pergamon Press, 1977.
21. Dorosz A, Penconek A, Moskal A. In vitro study on the aerosol emitted from the DPI inhaler under two unsteady inhalation profiles. Journal of Aerosol Science 101: 104–117, 2016.
22 Buttini F, Brambilla G, Copelli D, Sisti V, Balducci AG, Bettini R, Pasquali I. Effect of flow rate on in vitro aerodynamic performance of NEXThaler® in comparison with Diskus® and Turbohaler® dry powder inhalers. Journal of Aerosol Medicine and Pulmonary Drug Delivery 29: 167–178, 2016.
23. Horváth A, Balásházy I, Tomisa G, Farkas Á. Significance of breath-hold time in dry powder aerosol drug therapy of COPD patients. European Journal of Pharmaceutical Sciences 104: 145-149, 2017.