DOI: 10.1556/066.2020.49.4.1
ISOLATION AND PURIFICATION OF POLYSACCHARIDES FROM LITCHI SEEDS, WITH AN ANALYSIS OF IN VITRO
HYPOGLYCEMIC EFFECT
Y.K. P *, Y.H. H * and R.Q. H **
School of Life Sciences, South China Normal University, Guangzhou 510631, PR China (Received: 20 December 2019; accepted: 11 June 2020)
Polysaccharides from litchi (Litchi chinensis) seeds were isolated and purifi ed using ion exchange column chromatography. Molecular weight distribution of polysaccharides and monosaccharides were detected. Preliminary structural characterisation of polysaccharides was conducted using infrared, nuclear magnetic, and other spectroscopy techniques in combination with methylation analysis. In vitro cell culture experiments were designed to detect the eff ects of polysaccharides on cell growth and cellular glucose consumption. We extracted and analysed three polysaccharides from litchi seed. Monosaccharide composition and infrared spectroscopy detection showed that the skeleton structure of polysaccharides consisted of glucose and mannose. Polysaccharides 1 and 2 are similar and have relatively high glucose content (around 70%); polysaccharide 3 has 39.17% glucose only but is rich in arabinose (about 21.03%). In a certain range of use (50~1000 μg ml–1), polysaccharides 1 and 2 have no signifi cant impacts on cell growth, while polysaccharide 3 can promote proliferation to some extent. All three polysaccharides can promote in vitro cellular glucose consumption, especially polysaccharide 3, which shows the strongest promotion, a signifi cant dose eff ect, and synergistic eff ect with insulin. The above results highlight important roles of litchi seed polysaccharides in promoting cell growth and validate litchi seed polysaccharides as potential drugs for hypoglycaemia.
Keywords: litchi seed, polysaccharide, in vitro cell experiment, hypoglycaemic eff ect
As a member of the family Sapindaceae, Litchi chinensis Sonn. is one of the high-yielding fruits in China. It is sweet, juicy, and popular among consumers. Processing of litchi generates agricultural waste, which up to now has been discarded (Z et al., 2019).However, litchi seeds are used in traditional Chinese medicine for exhausting qi, dispelling cold, and relieving pain. Research reports indicate that litchi seeds have anti-infl ammatory (Q et al., 2015), anti- tumour (C et al., 2017), anti-oxidation (W et al., 2011), and other pharmacological activities. Their chemical components mainly consist of fl avonoids (W et al., 2019), tannins (L et al., 2009), terpenes (L et al., 2009), etc. Polysaccharides are also among the important functional substances in litchi seeds. Studies associated with polysaccharides of litchi seeds are only limited to extraction (S & B , 2010) and antioxidant (C et al., 2011) and antibacterial activities (Q et al., 2015) of crude polysaccharides. And in the fi eld of exploiting new diabetes drugs in recent years, the hypoglycaemic activities of plant polysaccharides are always a research hotspot (P et al., 2014).
In this study, crude polysaccharides extracted from litchi seeds were isolated and purifi ed. Monosaccharide compositions and in vitro hypoglycaemic eff ects of 3 polysaccharides were analysed. This study provides experimental evidences for the exploitation and utilisation of litchi seeds as a new hypoglycaemic drug.
* Y.K. P andY.H. H contributed equally to the work
** To whom correspondence should be addressed.
Phone: +86 20 13925120692; fax: +86 20 85211372; e-mail: qiangdoctor@126.com
1. Materials and methods
1.1. Materials and reagents
Mature seeds of the plant Litchi chinensis (Sapindaceae) were identifi ed by Guangdong Academy of Agricultural Sciences. Cell strain: human hepatoma Cell HepG2 was obtained from Guangzhou Editgene Technology Co., Ltd. DEAE-Sepharose fast fl ow anion exchange chromatography resin, American GE, and Glucose kit, Shanghai Runcheng Biotechnology Co., Ltd., were used in the experiments.
1.2. Experimental methods
1.2.1. Extraction and purifi cation of litchi seed polysaccharides.
Dried litchi seeds were crushed into powder, the screened powder was evenly mixed with water (60 ℃) at a ratio of 1:10 (g ml–1). Ultrasonic extraction was performed for 3 times (20 min) and the solution was concentrated under reduced pressure. Four times ethanol of 95%
was added to the concentrated solution. After the deproteinisation treatment by H2O2, decolourisation method (Y et al., 2016), and Sevag method (H et al., 2011), DEAE- Sepharose fast fl ow ion exchange column chromatography (IEC) was used for separation and purifi cation (D et al., 1956). Three polysaccharides were obtained by collecting the same peak position, dialysis, concentration, and freeze-drying.
1.2.2. Detection of molecular weight distribution. Gel permeation chromatography (GPC) was adopted to detect the molecular weight (H et al., 2011) using Waters 2410 diff erential refraction detector. A series of dextran solutions with diff erent molecular weights were prepared as standards. The molecular weight of the sample was calculated according to the corresponding elution volume.
1.2.3. Detection of monosaccharide composition. Polysaccharides were hydrolysed with 4 M trifl uoroacetic acid (TFA, 5 ml) in sealed tube at 100 °C for 2 h. The excess acid was evaporated in a water bath at 40 °C; upon the completion of hydrolysis, it was co- distilled with MeOH. HPAEC-PAD method was used to determine monosaccharide content.
HPAEC-PAD on the Dionex ICS-2500 system was used for the analysis of hydrolysates by ion chromatography (L et al., 1985). Standard ribose, rhamnose, arabinose, xylose, mannose, glucose, and galactose were used as standards, and treated and detected by the above steps.
1.2.4. Infrared spectrum detection. Two micrograms of polysaccharide sample was weighed, evenly mixed, and ground with dried potassium bromide in a mortar. The mixture was then pressed into a sheet by a tableting machine and scanned with Fourier transform infrared spectrometer in the wavelength range of 400–4000 cm–1 (Y et al., 2010).
1.2.5. Methylation analysis. The three polysaccharide samples were treated with 90%
formic acid (3 ml) in sealed tubes at 100 °C for 10 h (H , 1964). Upon the removal of formic acid, 4 M TFA was used for heating under the above-mentioned conditions. The hydrolysates were condensed to dry state. The acetylation product samples were determined by Shimadzu GCMS-QP 2010 gas chromatography-mass spectrometry with a constant volume of 10 ml.
1.2.6. Nuclear magnetic analysis. 50 mg sample was accurately weighted and dissolved in 500 μl deuterium substitute water, then transferred to the nuclear magnetic tube for spectral measurement.
1.2.7. In vitro cytotoxicity and glucose consumption analysis. Three polysaccharides were prepared in diff erent concentrations, 50, 100, 250, 500, 750, and 1000 μg ml–1, with 5 μg ml–1 rosiglitazone, a commonly used hypoglycaemic drug, as a positive control for treatment of cells for 24 h (no insulin treatment and insulin treatment). Glucose concentration and cell activity were determined by glucose kit (glucose oxidase method) and methylene blue method (F et al., 2009).
1.3. Data processing
The software Origin 9.0 was used to draw the curve of ion exchange chromatography gradient elution and SPSS 19.0 was used for statistical analysis of in vitro cell experiment results. The results were expressed as mean ± standard deviation (SD).
2. Results and discussion
2.1. Purifi cation of polysaccharides
As shown in Figure 1, three polysaccharides were mainly obtained by DEAE-Sepharose fast fl ow IEC in the 0, 0.1, 0.2, and 0.3 mol l–1 NaCl elution sections, and were named polysaccharide 1, polysaccharide 2, and polysaccharide 3, respectively. Polysaccharide 1 was eluted with pure water, and is a neutral polysaccharide. Polysaccharide 2 and 3 are weak acidic polysaccharides (W et al., 2017).
0 20 40 60 80 100 120 140 160
0.0 0.5 1.0 1.5 2.0 2.5 3.0 3.5 4.0
Number of test tube
OD490nm
1 2 3
0.0 0.2 0.4 0.6 0.8 1.0
NaCl concentration, mol l–1
Fig.1. Gradient elution curve for litchi seed polysaccharides obtained by IEC
2.2. Molecular weight of purifi ed polysaccharides
The results indicate that molecular weights of polysaccharides 1 and 3 are nearly equal, and are slightly higher than that of polysaccharide 2. The molecular weight dispersion coeffi cients (Mw/Mn) of the three polysaccharides are all close to 1, indicating that the molecular weight distribution is narrow and the molecular weight homogeneity is good (Table 1).
Table 1. Results of molecular weight distribution of purifi ed polysaccharides Component Number-average molecular
weight (Mn) (Da)
Weight-average molecular weight (Mw) (Da)
Mw/Mn
1 5.93×10⁴ 7.19×10⁴ 1.21
2 6.66×10³ 7.78×10³ 1.17
3 6.64×10⁴ 7.46×10⁴ 1.12
2.3. Monosaccharide composition of purifi ed polysaccharides
Seven monosaccharides are listed in Table 2. The contrastive analysis showed that glucose content is the highest in polysaccharides 1, 2, and 3 followed by mannose content. However, compared to polysaccharides 1 and 2, the glucose content in polysaccharide 3 is relatively low, but the contents of arabinose and galactose are both higher.
Table 2. Monosaccharide composition of purifi ed polysaccharides
Component Mole percent (%)
Ribose (Rib)
Rhamnose (Rha)
Arabinose (Ara)
Xylose (Xyl)
Mannose (Man)
Glucose (Glu)
Galactose (Gal)
1 0.25 0.68 1.72 0.08 21.71 73.04 2.52
2 1.01 0.43 0.34 0.5 21.27 75.49 0.95
3 0.67 0.79 21.03 0.99 23.88 39.17 13.47
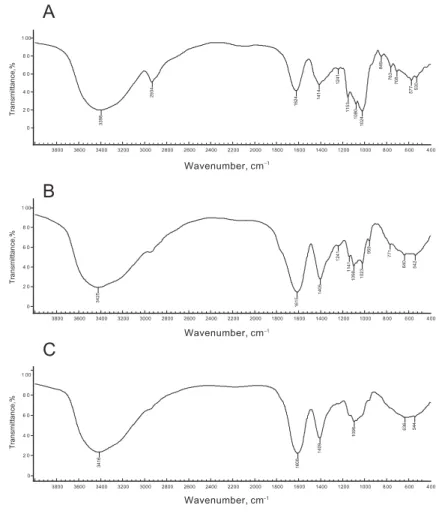
2.4. Infrared spectrum detection of polysaccharides
Infrared spectrum was used to detect the structural features of the three polysaccharides, including ring structure, hemiacetal hydroxyl structure and substituent type. The detection results of the three polysaccharides are shown in fi gure 2A, 2B, and 2C.
For polysaccharide 1, the telescopic vibration absorption peaks of -OH and C-H groups occur at 3398 cm–1 and 2934 cm–1, respectively, the bending vibration absorption peak of -OH occurs at 1624 cm–1 and the deformation absorption peak of =CH2 at 1414 cm–1. The absorption peak of C-O appears at 1153 cm–1, and the characteristic absorption peak of C-O-C at 1080 cm–1 and 1024 cm–1, indicating that polysaccharide 1 is also in the form of pyranose.
The characteristic absorption peak of α-glycoside bond appearing at 849 cm–1 indicates that polysaccharide 1 has α-glycoside bond (S et al., 2007) (Figure 2A).
In Figure 2B, the telescopic vibration absorption peak of -OH occurs at 3425 cm–1, the bending vibration absorption peak of -OH at 1615 cm–1, and the deformation absorption peak of =CH2 at 1405 cm–1. The absorption peak of C-O appears at 1141 cm–1, and the characteristic absorption peaks of C-O-C at 1098 cm–1 and 1023 cm–1, indicating that polysaccharide 2 is in the form of pyranose.
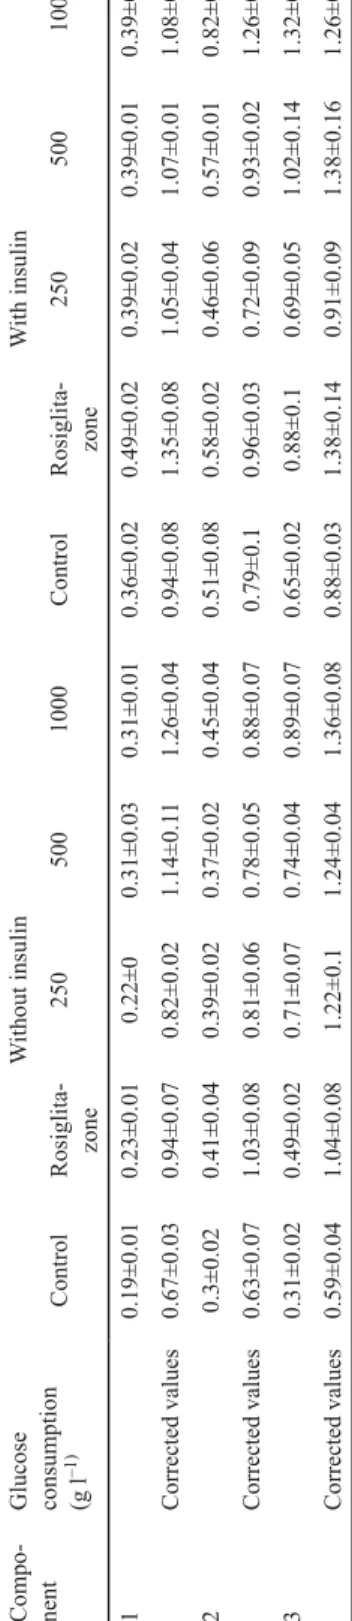
Table 3. In vitro hypoglycaemic test of the polysaccharide 1 Compo- nentGlucose consumption (g l–1)
Without insulinWith insulin ControlRosiglita- zone2505001000ControlRosiglita- zone2505001000 10.19±0.010.23±0.010.22±00.31±0.030.31±0.010.36±0.020.49±0.020.39±0.020.39±0.010.39±0.03 Corrected values0.67±0.030.94±0.070.82±0.021.14±0.111.26±0.040.94±0.081.35±0.081.05±0.041.07±0.011.08±0.09 20.3±0.020.41±0.040.39±0.020.37±0.020.45±0.040.51±0.080.58±0.020.46±0.060.57±0.010.82±0.04 Corrected values 0.63±0.071.03±0.080.81±0.060.78±0.050.88±0.070.79±0.10.96±0.030.72±0.090.93±0.021.26±0.06 30.31±0.020.49±0.020.71±0.070.74±0.040.89±0.070.65±0.020.88±0.10.69±0.051.02±0.141.32±0.09 Corrected values 0.59±0.041.04±0.081.22±0.11.24±0.041.36±0.080.88±0.031.38±0.140.91±0.091.38±0.161.26±0.06
In Figure 2C for polysaccharide 3, the telescopic vibration absorption peak of -OH occurs at 3416 cm–1, the bending vibration absorption peak of -OH at 1608 cm–1, and the deformation absorption peak of = CH2 at 1409 cm–1. The characteristic absorption peak of C-O-C at 1096 cm–1 indicates that polysaccharide 3 is also in the form of pyranose.
–1
–1
–1
Fig. 2. Infrared spectrogram of polysaccharides from litchi seeds A: polysaccharide 1; B: polysaccharide 2; C: polysaccharide 3
2.5. Methylation and nuclear magnetism
As shown in Figure 3A, B, and C, the carbon spectrum analysis of polysaccharide 1, 2, and 3 at 13C NMR (126 MHz, D2O) indicates that the nuclear magnetic carbon spectrum signal is mainly concentrated in 60–120 PPM.
As shown in Figure 3A, the heterocarbon regions of major heterocarbon signal peaks δ101, 97, and 93 are mainly concentrated in δ93~110. However, 78.95, 78.74, 78.16, 77.90, and 77.72 have already migrated to the low fi eld. According to the results of methylation, the C4 of 00..→4)-Glcp-(1→ or the C3 and C4 of Rha may also be the C4 of galactose (Z et al., 2013).
As shown in Figure 3B, the heterocarbon region of major heterocarbon signal peak δ101.92 is mainly concentrated in δ93~110. However, δ82.08, 79.84, 78.51, 77.57, and 77.17 have already migrated to the lower fi eld, indicating the probable replacement of C2, 3, and 4.
As shown in Figure 3C, the heterocarbon regions of major heterocarbon signal peaks δ100.89 and 109.49 are mainly concentrated in δ93~110. δ79.91, 79.85, 79.47, 79.08, 78.52, 78.16, and 77.75 have already migrated to the lower fi eld, indicating the replacement of glycoside bonds C2, C3, and C4. According to the results of methylation, it may be the C3/
C4 of →3, 4)-Rhap-(1→, the C4 of →4)-Glcp-(1→, the C3 of →3)-Galp-(1→ and the C3 of
→3,6)-Galp-(1→) (W et al., 2014).
Fig. 3. Carbon spectrogram of polysaccharides
A: polysaccharide 1; B: polysaccharide 2; C: polysaccharide 3
2.6. Eff ects on cell growth
As shown in Figure 4, polysaccharides 1 and 2 had no eff ect on cell growth, which maintained the activity at around 100%; but for polysaccharide 3, the pro-proliferation eff ect on cells was increasing with the increase of concentration, also this eff ect appeared at 250 μg ml–1 and even reached up to 151 ± 3.1% at 1000 μg ml–1. The result indicates that polysaccharides 1 and 2 have no eff ects on cell growth, while polysaccharide 3 has a growth promoting eff ect on cells.
0 20 40 60 80 100 120 140 160
250 500 750 1000
凞Cell activity%
0 50 100
250 750 1000
500
50 100 50 100 250 500 750 1000
Component 1 Component 2 Component 3
The polysaccharide concentrations, ȝg ml–1 Fig. 4. Eff ects of three polysaccharides on cell activity
2.7. Hypoglycemic test
Under the treatment without insulin, polysaccharide 1 could eff ectively promote glucose consumption and showed dosage eff ect after activity correction. While having been treated by insulin, polysaccharide 1 showed no signifi cant synergistic eff ect with insulin. Compared with rosiglitazone (a commonly used hypoglycaemic drug, 5 μg ml–1 and without insulin), the 500 μg ml–1 polysaccharide 1 had better eff ect on promoting cellular glucose consumption (Table 1).
Under the treatment without insulin, polysaccharide 2 could also promote glucose consumption, but the dosage eff ect was not signifi cant. While having been treated by insulin, polysaccharide 2 had synergistic eff ect with insulin at high concentration. Compared with 5 μg ml–1 rosiglitazone, with or without insulin, the cellular glucose consumption was higher than that of under treatment with 5 μg ml–1 rosiglitazone only at high concentration of the polysaccharide 2 (1000 μg ml–1).
At the lack of insulin, polysaccharide 3 can promote glucose consumption, and at high concentration the dosage eff ect is signifi cant. While insulin treated, polysaccharide 3 and insulin have synergistic eff ect, which can promote glucose consumption and show signifi cant
dosage eff ect. Compared with 5 μg ml–1 rosiglitazone, with or without insulin, the cellular glucose consumption are higher than polysaccharide 3 (250 μg ml–1) at low concentration, indicating that the 250 μg ml–1 polysaccharide 3 had better eff ect of promoting cellular glucose consumption than the 5 μg ml–1 rosiglitazone.
3. Conclusions
In this study, a total of 3 polysaccharides from litchi seeds were isolated and purifi ed using the decolourisation and deproteinisation methods. The eff ects on cell growth and hypoglycaemic activity of each polysaccharide were detected based on in vitro cell experiments. The results showed that polysaccharides 1 and 2 have no distinct eff ect on cell growth, while polysaccharide 3 has some pro-proliferation eff ect with the increase of polysaccharide concentration, and below 1000 μg ml–1 the cell activity can reach up to 151±3.1%. In addition, all three polysaccharides can promote the eff ect of glucose consumption. Compared with 5 μg ml–1 rosiglitazone, 500 μg ml–1 polysaccharide 1, 1000 μg ml–1 polysaccharide 2, and 250 μg ml–1 polysaccharide 3 promote cellular glucose consumption better, especially the 250 μg ml–1 polysaccharide 3, which also has signifi cant dosage eff ect and synergistic eff ect with insulin.
Experimental results indicated that, in the same plant, the polysaccharides with diff erent monosaccharides had quite diff erent eff ects on cell growth and metabolism. Therefore, the selective acquisition of phytochemicals and the exploiting and utilisation of plant polysaccharides as new hypoglycaemic drugs have great research prospects. In the next study, we intend to use selected diabetes model mice to explore the eff ects of the polysaccharide 3 on blood glucose, superoxide dismutase (SOD), malondialdehyde (MDA), and liver glycogen in diabetic mice, and to continue the study on the in vivo hypoglycaemic eff ect and mechanism of polysaccharides from litchi seeds.
*
The research was supported by Guangzhou Science and Technology Program key projects (201707010372);
Guangdong Forestry Science and Technology Innovation Project (2016KJCX008); and Zhanjiang City Science and Technology Development Special Fund Competitive Distribution Project 2018A01016.
References
C , Y.Y., L , H.Y. G , A.P. (2011): Ultrasound-assisted extraction of polysaccharides from litchi (Litchi chinensis Sonn.) seed by response surface methodology and their structural characteristics. Innov. Food Sci.
Emerg., 12, 305–309.
C , Y.C., C , C.H., T , Y.T., L , C.C., C , J.C., … H , C.P. (2017): Litchi seed extract inhibits epidermal growth factor receptor signaling and growth of two non-small cell lung carcinoma cells. BMC Complem. Altern. Med., 17(1), 16.
D , M., G , K.A., H , J.K., R , P.A. S , F. (1956): Colorimetric method for determination of sugars and related substances. Anal. Chem., 28, 350–356.
F , D.L., S , J. L , R.H. (2009): A modifi ed methylene blue assay for accurate cell counting. J. Funct.
Foods, 1, 109–118.
H , S. (1964): A rapid premethylation of glycolipid, and polysaccharide catalyzed by methylsulfinyl carbanion in dimethyl sulfoxide. J. Biochem., 55, 205–208.
H , X.Q., H , Y.Y., D , Q.F., S , L-Y., Y , F. Y , R.M. (2011): Structure characterization and antioxidant activity of a novel polysaccharide isolated from pulp tissues of Litchi chinensis. J. Agr. Food Chem., 59, 11548–11552.
L , J. (1985): Simultaneous gas-liquid chromatographic determination of aldonic acids and aldoses. Anal.
Chem., 57, 346–348.
L , X., Y , M.Y., J , N., X , X.Y., Z , J. Z , L.Y. (2009): Eff ects of Auricularia polytricha polysaccharide on mouse macrophage cytokine and iNOS gene expression. Mycosystema, 28, 435–439.
P , S.V., O , R.G., G , V.V., K , D.S., M , P.A., … O , Y.S. (2014):
Pectic polysaccharides of the fresh plum Prunus domestica L. isolated with a simulated gastric fl uid and their anti-infl ammatory and antioxidant activities. Food Chem., 143, 106–113.
Q , S.J., H , H., H , J.Y., W , Q.Y. W , Q.Y. (2015): Lychee (Litchi chinensis Sonn.) seed water extract as potential antioxidant and anti-obese natural additive in meat products. Food Control, 50, 195–201.
S , Y., S , J.C., Y , F.M. H , Q.H. (2007): Purifi cation and identifi cation of polysaccharide derived from Chlorella pyrenoidosa. Food Chem., 103, 101–105.
S , L.J. B , P.H. (2010): The absolute confi guration of methyl dihydrosterculate: an unusual phyto-fatty acid isolated from the seed oil of Litchi chinensis. Tetrahedron-Asymmetr., 15, 401–403.
W , L.J., L , G.D., M , Z.J. L , X.M. (2011): Chemical constituents with antioxidant activities from litchi (Litchi chinensis Sonn.) seeds. Food Chem., 126, 1081–1087.
W , M., Y , X.B., Z , J.W., L , C.J. Z , W. (2017): Structural characterization and macrophage immunomodulatory activity of a novel polysaccharide from Smilax glabra Roxb. Carbohyd. Polym., 156, 390–402.
W , L.R., W , D., J , Y.M., P , K.N., L , S., … Y , B. (2014): Identifi cation of fl avonoids in litchi (Litchi chinensis Sonn.) leaf and evaluation of anticancer activities. J. Funct. Foods, 6, 555–563.
W , J., X , Y., L , X., C , M., Z , B., …. W , S. (2019): Isolation and structural characterization of a non-competitive α-glucosidase inhibitory polysaccharide from the seeds of Litchi chinensis Sonn. Int. J. Biol.
Macromol., 154, 1105–1115.
Y , B., P , K.N. J , Y.M. (2016): Structure identifi cation of a polysaccharide purifi ed from litchi (Litchi chinensis Sonn.) pulp. Carbohyd. Polym., 137, 570–575.
Y , F., Y , R.M., Y , Y., S , J.R., D , Q.F... S , L.Y. (2010): Structure characterization and antioxidant activity of a novel polysaccharide isolated from Ginkgo biloba. Int. J. Biol. Macromol., 46, 436–
439.
Z , Q.Q., J , Y.M., L , S., W , L.R., W , D., .... Y , B. (2013): Structural identifi cation of (1→6)--d-glucan, a key responsible for the health benefi ts of longan, and evaluation of anticancer activity.
Biomacromolecules, 14, 1999–2003.
Z , X.R., W , H., S , J., Y , B., D , X.W. J , Y.M. (2019): Pericarp and seed of litchi and longan fruits: Constituent, extraction, bioactive activity, and potential utilization. J. Zhejiang Univ. Sc. B, 20, 503–
512.