Bank Domestic Outstandings in Central- Eastern-European Countries
between 2008 and 2018
SÁNDOR BOZSIK, Ph.D. PROF. ING. VLADIMIR GAZDA, Ph.D.
ASSOCIATE PROFESSOR PROFESSOR
UNIVERSITY OF MISKOLC TECHNICAL UNIVERSITY OF KOSICE e-mail: pzbozsi@uni-miskolc.hu e-mail: vladimir.gazda@tuke.sk
SUMMARY
The economic crisis that broke out in the most developed part of the world in 2008 seriously affected the Central-Eastern- European bank systems. This was no wonder, because these economies were closely linked to the developed countries.
Firstly, the Central-Eastern-European banks were mostly owned by large Western-European banks, and the management of these subsidiaries became tougher due to the asset management problems of their mother banks. The current paper examines the deleveraging of bank systems of this area during the crisis and thereafter. A special northern-southern division can be observed among the Central-Eastern-European banking systems, where the border is unfortunately at the northern border of Hungary. During the crisis, the amount of bank outstandings was mostly determined by the economic growth, the starting state of loan-deposit ratio, as well as the uncertainty of sovereign Credit Defalut Spread. In the after- crisis period the change in outstandings is especially dependent on the non-performing loan ratio and the change in loan- deposit ratio. Hungary is an “off-line” country for all strong correlated variable pairs, so the decrease in domestic outstandings may have country-specific reasons in addition to the general theoretical variables.
Keywords: Deleverage, Central-European banking system, financial crisis Journal of Economic Literature (JEL) codes: E51, G21
DOI: http://dx.doi.org/10.18096/TMP.2018.02.02
I NTRODUCTION
The CEE economies were influenced to different degrees by the financial crisis that broke out in 2008. The local fragile bank systems were the very first victims of the crisis, since most of the local banks were owned by large Western-European financial institutions. The portfolio deterioration of the mother banks made the management of the local subsidiaries harder (Tressel, 2010). From 2011 the local banks were no longer supported by the financing sources of their owner, moreover some mother banks began to withdraw deposits from their Eastern-European branches to meet the consolidation requirements prescribed by their home countries. Secondly, most of the related countries suffered from the consequences of easy or predator lending, so the asset quality worsened severely.
Thirdly, the sphere of potential debtors decreased due to the economic crisis that followed the financial crisis. The fourth potential reason fordecreased outstanding loans was the intervention of state economic policy. The majority of Central-Eastern-European states introduced sectorial taxes
on financial institutions and strengthened the supervisory rules by the recommendation of Basel III. (Tressel, 2010)
Despite facing the same situation, the financial crisis affected the Central-Eastern-European countries in different manners. This study is devoted to exploring the explanatory factors of the banks’ asset deleverage.
L ITERATURE R EVIEW
Deleveraging is related to capital leverage. Capital leverage refers to the structure of financing, namely the ratio between equity and liabilities. It has several measurements; in our case capital leverage means the total ratio of assets to shareholders’ equity ratio (Burke, 2015).
Deleveraging means that the enterprises change their leverage in each phase of an economic cycle. During recovery and overheating, when the profitability is high, and the companies need loans to finance their investments, the leverage increases. During recession the profitability of companies decreases and their aim is to decrease their fixed revenues costs. Since interest is such a fixed expense,
the companies strive to repay their loans and decrease their leverage in order to minimise the interest expenses.
Kiss & Szilágyi write that, “We are talking about deleverage if due to the changing economic circumstances the actors of the economy judge that their leverage is exaggerated, and they make economic decisions to build down their debt by readjusting their asset structure, so deleverage is a synonym for debt repayment” (Kiss &
Szilágyi 2014: 955). According to the authors the deleveraging process proceeds in the following pattern in the case of banks: The erupting financial crisis (huge amount of bad loans) increases the leverage of banks, since the losses can be written off from the equity. Since the capital increase has severe limitations during the circumstances of a crisis (no profit, high aversion to risky investments), the leverage can be restated only by decreasing the outstanding and loans.
On the micro level deleverage means that the enterprises are forced to decrease their expenses due to the fall in their incomes, thus they minimise their debt level to decrease the interest expenses. Secondly, their working capital needs are decreasing due to lower sales and their investment opportunities are worsening, which decreases both their long- and short-term loan demand.
On the macro level the banks withdraw their outstandings. The stock of non-performing loan increases, which decreases the equity of banks. The lowering equity level forces the banks to decrease lending to meet the capital adequacy directives. In addition, the risk-bearing ability of banks becomes lower because of the deteriorating asset quality, so they turn to less risky investments (like state securities) against the more risky banks. (De Bond, 2002).
The above procyclical behaviour of banks was one of the most important lessons from the economic crisis that started in 2007 (Kovács 2014). Whereas the monetary authorities and the governments strived to increase the aggregate demand through deficit increase and lowering the prime rate, the behaviour of the financial sector deepened the crisis. The bank system began a credit crunch in answer to the worsening quality of outstanding and disappearing liquidity in financial markets, and by doing that it decreased the aggregate demand.
Before the financial crisis the behaviour of bank systems was just the opposite. The financial institutions increased the volume of outstandings, disregarding the bearing risk, which (especially in the real estate market) led to the creation of asset price bubbles (Kovács 2014).
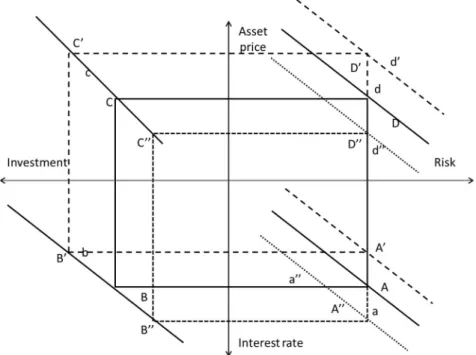
Let us look at how the lending boom leads theoretically to create asset price bubbles and how the bursting of bubbles leads to withdrawal of banks’ lending activity. The assumptions of this model (Acharya & Naqvi, 2011) are the following (see also Figure 1):
1. The riskier an investment idea, the higher the interest rate of the loan – line a.
2. The higher the lending rate, the lower quantity of investments made – line b.
3. The lower the quantity of investments, the lower the price of invested assets – line c.
4. The bigger the risk of an asset, the lower its price – line d.
Figure 1 provides an explanation. The solid line of this chart represents the equilibrium among the asset price (real estate price), the risk, the interest rate and the level of investments.
Source: Acahrya &Naqvi, 2011
Figure 1. Creation of asset bubbles
Now let us see how the asset bubbles are created. The banks underestimate the expected risk of their loans, and therefore line a shifts to rightward and upward, and the lending rate falls (from A to A′), and they give larger loans for investments, so the size of investment increases from B to B′. The increasing demand beats up the asset prices, so the risky assets become overvalued and the price-risk axis shifts from line d to line d′. The asset bubble is established, denoted by the dotted square.
The burst asset bubble leads the prices down from D′
to D″. The decreasing prices throw back the demand for investment from C′ to C″, the worsening loan portfolio leads to higher real loan rates from B′ to B″. The risk aversion of banks increases, so they finance the same risk for a higher lending rate (from A′ to A″).
Consequently the risk bearing attitude of banks is high during overheating while the real lending rates are low, which leads to increasing investments and increasing asset prices. During recession the process is precisely reversed.
The higher risk version leads to decreasing prices, decreasing investments and high real rates.
The process is self-generating in both ways. Human psychology stands behind both, according to behavioural finance theory. During overheating exaggerated self- confidence rules, just as during recession panic explains human behaviour (De Bondt 2012).
A study by Takáts and Upper deals with the sensitivity of banks’ loan stock toeconomic cycles (Takáts & Upper 2013). They examined 39 economic crises where the creation of the bubbles advanced the eruption of the crisis.
They found that recovery from the crisis does not hinder the deleveraging (the decrease in lending). They found no correlation between the economic growth two years after the crisis and the change in loan stock/GDP ratio. They conclude that the economic recovery depends on the indebtedness of the country and the real rate of interest by their examination.
Deleveraging is natural in an economic recession.
However, its size matters, and by considering this the literature differentiates between “good” and “bad”
deleverage (Bologna et al. 2014). In good deleverage the bank just simply adjusts to the changing economic circumstances to avoid bankruptcy. Thus, as the loan requests of potential debtors decrease, the bank repays its lenders, especially its external, foreign sources, so its capital adequacy improves, although its profitability decreases. The bank makes its credit terms stringent to crowd out the risky debtors, but it remains available to solvent debtors.
We talk about bad deleverageif the fall in loan stock is the consequence of rising bad loan stock. In this case the fall of loan stock does not improve the capital adequacy, since the lowering equity base is caused by the loss from bad lending. Thus, the bank is forced to dramatically withdraw its outstandings to meet the regulatory directives, even if it has to refuse to lend to its good
customers. This phenomenon is often calledcredit crunch.
The credit crunch further deepens the recession and consequently further worsens the level of bad loans. An vicious circle can be established that can be solved only by the state (through consolidating the bank through purchasing the banks’ bad loans). However if the state’s solvency is also weak, only the international financial institutions can help.
T HE C ONSEQUENCES OF THE
E CONOMIC C RISIS IN E UROPE
Paradoxically the credit crunch that originated in the USA caused the largest recession and deleverage in Europe. This has basically two reasons.
The first is that the European banks suffered meaningful losses in their direct and indirect American investments. The fertilisation effect was examined by an IMF study (Cerutti & Claessens 2014). It stated that the supply side factors (namely, the factors depending on banks) played a bigger role in deleverage than the decrease of loan demand. The banks strengthened their credit terms due to the fertilisation effect. If the bank or its mother bank had large losses in the American outstanding, then the bank held in (or was forced to hold in) its outstandings in the home market. The fertilisation effect was deepened by the bank’s dependency on external sources, since the crisis froze the operation of interbank financial markets, thus causing a liquidity crisis for banks with a high loan/deposit ratio. (Angelides 2011)
This fertilisation effect was examined by the World Bank’s experts in an analysis of the deleverage of Central- Eastern-European banks (Feyen et al. 2014). The larger the dependency of these banks on external sources, the bigger the deleverage to repay these external sources. The share of foreign equity played no explanatory role in deleveraging; it didn’t matter whether the bank was in foreign or in domestic hands, the banks decreased the lending if the loans were financed from foreign sources.
A second factor was that in some countries problems emerged related to the sovereign debt (Southern-European countries, Hungary). Since they did not receive financing sources from the markets, they were forced to turn to international institutions, which linked their loan to meaningful austerity measures. Sothese states could not help their economies to recover, and the economic policy further deepened the crisis. Naturally the problems with sovereign debt had a disadvantageous relation to the financing cost of the domestic banks, thus the deleveraging was extremely serious in those countries where there were problems with the state debt (Vause et al. 2012).
The mechanism of the European economic crisis and deleverage is described in Figure 2 (Bornhorst & Arranz, 2013).
Source: Bornhorst &Arranz 2013
Figure 2. Linkage between deleverages Figure 2 shows the vicious circle of recession. The
bursting of the mortgage market bubble decreases the value of mortgage, which forces the bank to withdraw loans in every overdebted sector. The decrease in lending decreases residential investments and also decreases the income of companies producing commodities (especially the income of the contruction industry and automobile industry). These companies decline their production, which leads to cost reduction programs, laying off staff and lower levels of investment. This decreases the income of the households, which leads to a further decrease in the aggregate demand. The widespread recession is perceived by the banks, because their loan portfolio worsens further.
The lending losses and the emerging risk force them to make their credit terms more severe, which negatively effects the declining residential and commercial investments. (Cerutti 2014)
The above situation becomes even more serious if the state was heavily indebted before the crisis. The recession decreases the state’s revenue, and its expenses increase to soften the social effect of recession. However, a larger deficit is not an option due to the lack of finance. So the state increases taxes, decreases public spending and sells public property (privatisation) at a very low price (deep in recession). This further deepens the crisis.
The linkage between the sovereign debt rating of Central-Eastern-European countries and bank deleveraging appears in the study of Benczúr and Kónya (2015). They found that the larger the increase in sovereign debt Credit Defalut Spreads (later CDS), the larger the drop in foreign deposits during the crisis.
The domestic loan stock significantly decreased in the countries of European Union during the crisis (Schoenmaker & Peek 2014). This decline was especially meaningful in the peripheral countries (in Eastern and Southern Europe, as well as in Ireland). Examining the countries’ banks, they stated that the outstandings decline was larger in the case of banks consolidated by the state than in the case of banks with normal capital adequacy.
Deleveraging was especially the consequence of lowering equity level, which forced the bank to decrease its lending to meet the requirements of strengthening bank regulation.
Deleveraging was examined by one of the World Bank’s studies from the aspect of tightening credit terms (Feyen et al. 2012). It concluded that the banks operating in emerging markets (especially in Eastern Europe) tightened their credit terms due to the crisis; however, the capital adequacy was the highest here (thanks to the mother banks’ support) So the decrease in outstandings was not caused by the lack of capital but by other factors of the economic situation (recession, high level of non- performing loans, the cash-flow hunger of mother banks and the high loan-to-deposit ratio).
Finally a comprehensive study of VOXEDU listed the triggering factors for deleverage in the European Union (Feyen et al. 2013). The study differentiates three factor groups of European deleverage –financial, regulational and economic political factors. The study provides an overview of the effect of market conditions on financial factors. Tightening inter-bank market conditions, the worsening rating of debtors, problems of foreign currency nominated loans and withdrawal of foreign sources were listed. Similar conclusions can be found in (Gróf 2016)
The regulatory factors relate to the gradual introduction of the new Basel-III agreement. The capital adequacy requirements began to tighten and encouraged the banks to follow less procyclical behaviour. A new aspect is the recognition of liquidity risk and new liquidity indicators.
These strive to encourage the banks to limit their outstanding in the medium term.
The study mentions among the economic political reasons that the economic recession was linked with austerity packages (tax raises, public expense cuts) in several countries facing high public debt. This deepens the recession and decreases the number of lendable private debtors. The recession limits the income-generating ability of banks and hinders the quick write-off of bad loans.
The banks have another alternative to invest their money: they can buy state securities. The collapse of domestic outstandings can be compensated by a portfolio rearrangement towards the less risky treasury bonds. (Gróf 201)
This paper examines the effect of the financial crisis on the overall outstanding debt (both private and state) in Central and Eastern Europe and examines the speed of general recovery after the crisis.
T HE A IM OF R ESEARCH AND THE
A PPLIED M ETHODOLOGY
The aim of current paper is to examine deleverage in the eastern part of the European Union (among the former socialist countries). Firstly we examine how the deleverage is related to the Central-Eastern-European (CEE) countries and how quick has the recovery been since 2013 according to the newest available statistics.
Secondly we distinguished which country’s bank system was characterised by “good” or “bad”
deleveraging. Due to the lack of data, the examination was carried out on the whole banking system of the countries based on the data of the World Bank, European Central Bank and the European Statistical Office, rather than on individual banks.
After separating the “bad” and “good” deleverage we surveyed whether there are any sign of domestic outstandings increasing after the deepest point of the crisis (since 2012) and how the influencing factors of deleverage behaved during that period.
The annual change in corporate and household loan was considered as the indicator of deleverage. This was the dependent variable. So the total outstanding of the bank sector was decreased by the amount of public lending and the amount of foreign lending. The reason for this is that the primary goal of public lending is not to earn profit, but to ensure the required liquidity and capital adequacy. That is why the public outstanding (which means mainly the purchase of government securities) does not react to the shape of economic cycle in the same way as the private outstanding.
Foreign loans – considering the fact that the examined region is poor in capital – are not typical outstanding of the region’s banks, and here we cannot separate whether the foreign income holder is private or public, which wasn’t crucial in this analysis.
Results in the literature suggest that it would be worthwhile to examine the role of four factors in the case of Central-and-Eastern-European bank systems. These are the following:
1. Fertilise effect from developed (WesternEuropean) bank systems
2. Non-performing loan stock 3. Current state of the economic cycle 4. Country risk
Four explaining variables were created to separate these four factors.
The fertilise effect is strong in a given state if the foreign liabilities have a significant stake in the total bank’s liabilities. If the mother bank encounters trouble, it tries to get more cash inflow, so it tries to reclaim its foreign outstanding. In several cases the consolidation contracts made between the mother bank and its state also prescribe the liquidation of foreign investments. Due to the lack of proper data we approached the exposure of liabilities from the mother bank using the corporate and household loan-to-deposit ratio at the end of 2008. Before the crisis, the banks of the examined region had taken on significant foreign liabilities to finance the lending boom, and their loan to deposit ratio significantly increased.
H1: The higher the loan-to-deposit ratio, the larger the extent of the decrease in domestic outstandings during the crisis.
The decreasing quality of te loan portfolio was measured by the change in the non-performing loan percentage between 2008 and 2012. Generally the quality of loan portfolio was the worst in 2012 in the examined country group.
H2: The larger the quality decrease in the loan portfolio, the greater the fall in domestic outstandings.
The depth of the economic crisis may have a significant effect on the size of domestic outstandings, because the base of potential solvent customers was decreasing. In recession a well managed company keeps its working capital level low and makes no unnecessary investments, and so its financing needs decrease. The size of the economic crisis was measured by the difference between the 2008 and 2012 real GDP. I chose this long period because the economic crisis followed a “W” shape in most of the countries, with two recession depths (in 2009 and in 2012). The recovery started in 2013.
H3: The larger the fall in GDP, the larger the deleverage.
The uncertainty of country risk was measured by the standard deviation of sovereign debt of the related country between the end of 2007 and 2012.
H4: The higher the volatility of CDS spread, the larger the decrease in domestic outstandings.
The examined countries can be found in the Eastern part of the European Union, among the group of member states that joined the EuropeanUnion in 2004 or later:
Bulgaria, the three Baltic states - Lithuania, Estonia and Latvia, Croatia, Czech Republic, Hungary, Poland, Romania, Slovakia and Slovenia.
The data came from three sources. The GDP was downloaded from the Eurostat website, the non- performing loan ratio came from the World Bank’s database and the source of loan and deposit stock was the database of the European Central Bank (ECB). The historical CDS spreads are available at the website of DataGrapple. In the case of Croatia and Latvia the ECB database contains no data, while in the case of Slovenia the CDS spreads are not available.
The statistical analysis was made by SPSS 22.0. Due to the lack of data there were 8-11 cases, so a scatter plot was used to expose the linkage between each of the
independent variables and the dependent variable. The stronger is the linkage, the better the plots fit onto a line or curve. The research was made both the during- and the post-crisis periods.
R ESULTS OF THE R ESEARCH
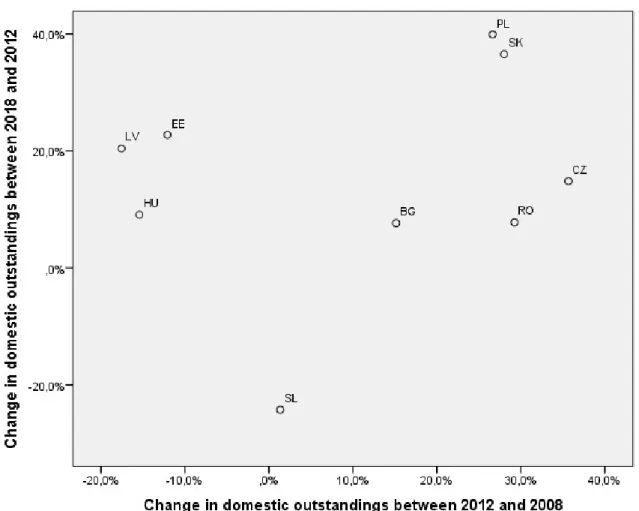
Firstlythe size of deleverage is ranked by using a scatter plot chart (Figure 3) where the horizontal axis demonstrates the change in domestic outstandings during the crisis and the vertical axis presents the post-crisis change in domestic outstandings. The farther a country from the lower left-hand corner of the chart, the smaller the degree of deleverage (if there even was a leverage.) The countries were ranked in descending order by their distance from the lower left-hand corner.
Source: ECB, own work
Figure 3. Change of domestic outstandings during and after the crisis
In crisis After crisis Source: ECB, own work
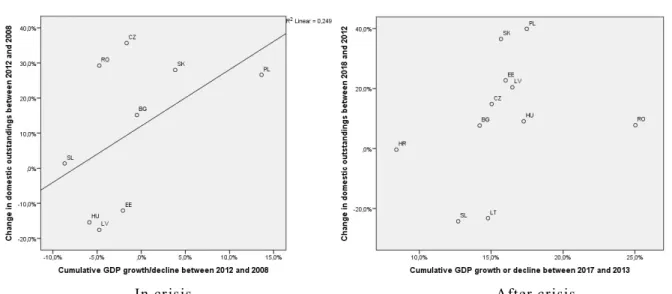
Figure 4-5. Relationship between domestic outstandings and GDP From the chart it can be seen that the largest fall in
domestic loans was suffered by Slovenia both during and after the crisis. The decrease was not significant before the crisis, but the drop has increased since 2012. The Baltic countries and Hungary (upper left-hand corner) also suffered a sharp decline during the crisis, but the size of recovery reached the regional average. Romania, Bulgaria and the Czech Republic indicate very moderate increases in domestic lending in both periods in euro terms. In Slovakia and in Poland the size of domestic lending did not reflect the crisis; both periods brought a significant increase in domestic outstandings. Based on this result the following clusters were formed related to the deleveraging (based on the distance from the lower left-hand corner).
1. Poland, Slovakia – dynamic increase
2. Estonia, Latvia, Hungary – strong exposure to the crisis
3. Bulgaria, Romania – moderate increase 4. Slovenia – decaying outstanding
Lithuania and Croatia weren’t ranked by available data and therefore are not represented in the figure.
In the Central-Eastern-European countries the linkage between the domestic outstandings and the GDP during and after the crisis is shown by Figures 4 and 5.
It can be seen in Figure 4 that during the crisis the deleverage is clearly explained by the change in GDP. The explanation power is 25%, measured by R2. The larger the fall in GDP, the more significant the drop in domestic outstandings. However, the Baltic States and Hungary suffered a bigger drop in lending than the GDP decline. In the “above the line” countries (Slovenia, Romania and the Czech Republic) the drop in domestic lending was not as large as the fall in GDP.
However, the GDP does not explain so clearly the situation after the crisis (Figure 5). Between 2013 and 2018 Romania and Hungary earned the biggest growth, but the expansion in lending was not impressive. The countries with expanding domestic loans did not display significantly better economic growth.
One explanation for this phenomenon can be “bad”
deleveraging. If the bank system has too many bad loans, the increase in domestic outstandings may be postponed due to the high perceived risk.
In crisis After crisis Source: ECB, World Bank, own work
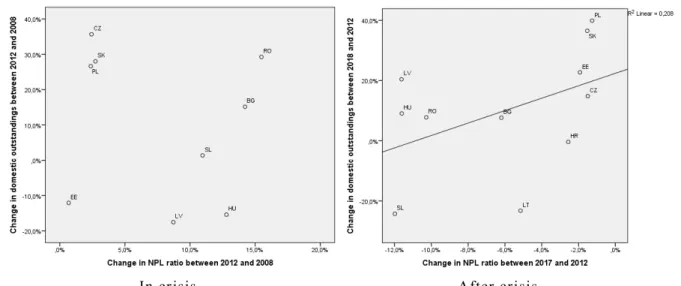
Figure 6-7. Relationship of domestic outstandings and bad loans The bad loan ratio shown in Figure 6 explains the
deleverage against the GDP change better in the post-crisis period than during the crisis. After the crisis, the biggest drop in loan quality occurred in Slovenia, Lithuania and Hungary and the deleveraging was the most significant in these countries.
On the other side, Poland and Slovakia had no problem with the quality of assets; consequently, the banks’ lending could rapidly expand. The increase was less intensive in the case of the Czech Republik and Estonia.
The differences may come from the various changes of loan-to-deposit ratio (Figure 7). After the crisis the banks strived to bring their loan-to-deposit ratio close to 1, since the inter-bank money market was frozen, and some regional banks could expect no help from their mother banks. The explanitory power of loan-to-deposit ratio remains after the crisis. During the crisis I used the opening balance of loan-to-deposit ratio (Figure 8), while in the post-crisis period I used the change of loan-to-deposit ratio (Figure 9). After the crisis, the lack of domestic deposits may have constrained the increase in private lending.
In crisis After crisis
Source: ECB, own work
Figure 8-9. Relationship between domestic outstandings and the loan-to-deposit ratio
In crisis After crisis Source: ECB, DataGrapple, own work
Figure 10-11. Relationship between domestic outstandings and standard deviation of CDS spread It can be seenin Figure 8 that the dependence on
domestic deposits explains well the change in domestic lending. In 2008 the domestic outstandings significantly decreased in the net lending countries. Where the bank system had a significant domestic deposit base (the Visegrad countries except for Hungary) the amount of domestic outstandings increased against the crisis.
Although Hungary is an “under-the-line” country, the loan stock decreased more than could be explained by the loan- to-deposit ratio.
After the crisis, the outstandings increase if the deposits increase and vice versa. If the deposits decrease, the lending decreases regardless of the state of economy.
The linkage is much stronger than in the crisis period.
Where the deposits grow, the banks utilise the situation and increase their lendings.
Finally. let us look at the effect of sovereign debt risk on the stock of CEE domestic outstandings. The sovereign risk is considered to be zero in the case of Estonia since its public indebtedness is extremely low; there is no listed CDS spread on Estonian public debt.
From Figure 9 it can be seen that the uncertainty of sovereign risk spread moderately affects the level of outstandings. The linkage is almost negligible. It appears that domestic outstandings are not sensitive to the volatility of macroeconomic risks.
It is important to note that there is a strong linkage between the non-performing loan ratio and the risk of sovereign debt ranking. A correlation matrix of the available independent variables revealed a not significant but medium-strong correlation (0.8) between these two variables during the crisis. In the post-crisis period, however, this linkage disappeared.
C ONCLUSIONS
The following conclusions can be drawn from studying the figures and data:
1. The change in domestic outstanding was determined by the loan-to-deposit ratio, the GDP and the bad loan ratio in this order. The CDS spread has no explanatory power. However, the weight of the explanation variables are different in the crisis and the post-crisis period. The GDP has stronger explanatory power in the crisis, but the NPL and loan-to-deposit ratio are better in the post-crisis period.
2. Hungary was one of the two countries (near Slovencia), where the deleverage was the most serious. This may be the consequence of two factors. Firstly, the Hungarian bank system has got an accumulated drawback situation; all of the bank specific explaining factors (loan-to-deposit ratio, GDP growth, non- performing loan, and risk of sovereign debt) have poor figures during and after the crisis. The only exception was the post-crisis economic growth, where the performance of Hungary was fairly good between 2013 and 2015. The second reason may be that the Hungarian bank sector was burdened by several special levies (sectorial bank tax introduced firstly in the region with heavy tax rates, consolidation of foreign currency nominated mortgage loans, transaction tax, etc.) These levies limited the profit generating ability of Hungarian banks and also limited the quick write- off of accumulated bad loans.
REFERENCES
ACHARYA V. – NAQVI H. (2011): Bank Liquidity and Bubbles: Why central banks should lean against liquidity.
Loyola University conference on Bubbles and Macroprudential Regulation (2011 április)
ANGELIDES P. et al. (2011): Final Report of the National Commission on the Causes of the Financial and Economic Crisis in the United States http://fcic.law.stanford.edu/report/
Bank of England (2012): Funding for Lending Scheme
BENCZÚR P. – KÓNYA I. (2015): Interest Premium, Sudden Stop, and Adjustment in a Small Open Economy. Magyar Tudományos Akadémia Közgazdaság- és Regionális Kutatóközpont Műhelytanulmányok MT-DP – 2015/5 2015 január, ISBN: 978-615-5447-63-1
BOLOGNA et al (2014): EU Bank deleveraging. Questioni di Economia e Finanza 2014 szeptember No 235
BORNHORST F. - ARRANZ M. R. (2013): The perils of private-sector deleveraging in the Eurozone. 13 November 2013 http://voxeu.org/article/private-deleveraging-eurozone
CERUTTI E.O – CLAESSENS S., (2014): The Great Cross-Border Bank Deleveraging: Supply Constraints and Intra- Group Frictions. IMF Working Paper 2014/180 2014. szeptember p. 24 https://doi.org/10.5089/9781451843057.001 DataGrapple database: https://www.datagrapple.com/
European Central Bank Statistical Data Warehouse http://sdw.ecb.europa.eu/
Eurostat Database http://ec.europa.eu/eurostat/data/database
FEYEN E. & DEL MAZO I. G. (2013): European bank deleveraging and global credit conditions 2013. május 12 http://voxeu.org/article/european-bank-deleveraging-and-global-credit-conditions
FEYEN E. – KIBUUKA K. – ÖTKER-ROBE I., (2012): European Bank Deleveraging: Implications for Emerging Market Countries. Economic Premise, 79, 7-14 https://doi.org/10.1057/9781137342102_1
FEYEN E. - LETLIER R. - LOVE I. – MAIMBO S. M. – ROCHA R., (2014): The Impact of Funding Models and Foreign Bank Ownership on Bank Credit Growth Is Central and Eastern Europe Different? World Bank Policy Research Working Paper 6783, Februrary 2014 p. 57 https://doi.org/10.1596/1813-9450-6783
GRÓF P., (2016): Gazdasági válság és szigorodó szabályozás: Változások a magyar bankszektor likviditásmenedzsmentjében 2007 és 2014 között. Pénzügy-Számvitel-Statisztika Füzetek 2015 Miskolci Egyetemi Kiadó 2016 page 32-43l
http://fac.comtech.depaul.edu/wdebondt/Publications/Bubble.pdf
KISS Á. – SZILÁGYI K., (2014): Miért más ez a válság, mint a többi? Közgazdasági szemle, LXI. évf., 2014. September (949–974. o.)
KOVÁCS L. (2011): A magyar bankrendszer helyzete és kihívásai, Magyar Pénzügyi Almanach 2011-2012, XXI.
Volume, pp. 90-96., ISSN 2063-188X https://doi.org/10.18414/ksz.2018.12.1225
KOVÁCS L. (2014): Hitelintézeti konszolidáció és adóskonszolidáció, Magyar Pénzügyi Almanach 2014-2015, XXIV.
volume, pp. 62-67., ISSN 2063-188X https://doi.org/10.21637/gt.2016.3.02.
SCHOENMAKER D. – PEEK T. (2014): The State of the Banking Sector in Europe. OECD Economics Department Working Papers, No. 1102, OECD Publishing. http://dx.doi.org/10.1787/5k3ttg7n4r32-en
TAKÁTS E. – UPPER C. (2013): Credit and growth after financial crises. BIS Working Papers 2013 July No. 416 TRESSEL T- (2010): Financial Contagion through Bank Deleveraging: Stylized Facts and Simulations Applied to the
Financial Crisis. IMF Working Paper 10/236 https://doi.org/10.5089/9781455209361.001
VAUSE N. – VON PETER G., DREHMAN M., SUSHKO V.: European bank funding and deleveraging. BIS Quarterly Review, 2012. March p. 12 https://doi.org/10.2139/ssrn.2575635
Word Bank Database http://data.worldbank.org/indicator/FR.INR.LEND