Regional Center for Energy Policy Research Regional Center for Energy Policy Research Regional Center for Energy Policy Research Regional Center for Energy Policy Research
Corvinus University of Budapest Corvinus University of BudapestCorvinus University of Budapest Corvinus University of Budapest
Statistical Analysis of the Performance Data of Central and Eastern European Water
Utilities
Client:
The World Bank IBNET Program
Prepared by:
Regional Center for Energy Policy Research (REKK) at the Corvinus University of Budapest
Mailing Address: 1093 Budapest, Fővám tér 8.
Office: 1092 Budapest, Közraktár utca 4-6, 707. szoba Phone: (1) 482-7070 Fax: (1) 482-7037
e-mail: rekk@uni-corvinus.hu Date: January 2009
Authors:
Márta Bisztray *, András Kis *, Balázs Muraközy **, Gábor Ungvári *
* Corvinus University of Budapest, Regional Centre for Energy Policy Research, Water Economics Unit
** Institute of Economics, Hungarian Academy of Sciences
Table of Contents Table of Contents Table of Contents Table of Contents
1. Introduction...4
2. Literature Review ...5
3. Data Used ...7
4. Statistical Results ...16
4.1. Descriptive Statistics...16
4.2. The Regression Analysis...20
4.3. Regression Results for the Water Service ...23
4.4. Regression Results for the Wastewater Service...27
5. Summary ...30
6. Literature...31
1.
1. 1.
1. Introduction Introduction Introduction Introduction
The Regional Center for Energy Policy Research (REKK) of the Corvinus University of Budapest in Hungary has been commissioned by the World Bank to collect performance data from water and wastewater utilities in Hungary, assist in collection and verification of data from specific Central European countries, and statistically analyze the generated database. These tasks were carried out by the Water Economics Unit within REKK. The present paper provides a summary of the process and results of the statistical analysis.
Under traditional benchmarking programs it is frequently assumed that a more attractive indicator value, such as a lower unit cost, is a reflection of more efficient operation. There is, however, a lot of evidence (see Section 2 on literature) suggesting that performance is driven by i) operating efficiency as well as ii) external operating conditions. As an example, a utility which serves a densely populated city from a shallow water base on flat terrain is likely to have much lower costs than the neighboring utility which pumps water from wells in the valley to sparsely populated villages in the mountains.
The purpose of our statistical analysis was to see if the impact of operating conditions on the unit cost of service can be determined in case of Central and Eastern European (CEE) water utilities. In other words, to what extent, if any, do key operating characteristics contribute to differences in the value of the cost of service at the surveyed utilities. Two analyses were conducted, one focusing on the unit cost of water service, the other dealing with the unit cost of wastewater service.
2.
2. 2.
2. Literature Review Literature Review Literature Review Literature Review
There are a number of research papers in international literature, where the cost functions of water and sewerage utilities are estimated using regression methods. In this part of our report we provide a review of the most important findings relevant to our purposes.
Primarily, we looked at the factors which influence the unit costs of water services. In most cases the examined explanatory factors have a lot in common.
How the size of the utility affects unit cost, and in particular, the existence of economies of scale (decreasing unit costs by increasing supplied quantity) and the related intervals of size is widely discussed. Here we can mention the paper of Garcia and Thomas (2001), who examined these questions among others on French data. They found significant economies of scale up to a certain point - as long as a water district consists of not more than five communities -, and therefore suggested that communities should merge into water districts. Aubert and Reynaud (2005) found a similar result. As a result of their examination of data from Wisconsin water utilities they claim that the smallest service providers, with less than 5000 customers, could gain in terms of unit costs if they extended their service size. Gradually vanishing economies of scale could be reported from Japanese and Italian data as well (Mizutani-Urakami (2001) and Fabbri-Fraquelly (2000) respectively). Existing research strongly suggests that the unit cost of water services depends on the size of the utility, therefore it is logical to include this factor in our statistical analysis. Size can be measured through the quantity of supplied water, the size of the service area or the number of consumers, as it can be seen in the papers.
The other often examined feature of the industry is returns to density, usually handled together with economies of scale, and again, established as an important variable.
Economies of density shows how unit costs decrease if supplied quantity is kept constant but the supplied area is smaller, or in other words, if utilities supply in a more densely inhabited area. Therefore we decided to include indicators of density in our regression analysis.
The various estimates of cost functions also include prices of inputs and cost of capital. As the latter is not easy to measure, such proxy variables can be used as capacity or network length.
Based on the classification of Mizutani and Urakami further factors can be grouped as follows.
It is frequently emphasized in the corresponding literature that in a cost estimation exercise the quality of supplied water needs to be controlled for. In essence, it is important to include such variables as type of water source or ratio of water taken from other suppliers. Since the
source of water is related to the required water treatment processes and pumping costs, it obviously has an influence on overall unit costs.
Another group can be referred to as network properties. This includes pipe length, age of the distribution system, ratio of network loss or network density (served population per unit of network length). For the last one population density in the service area or density of connections can also be used as an approximation. The number of settlements supplied can be a useful component of a regression analysis, especially if examined together with other features of the network or the size of the utility.
Finally properties of the supplied consumers also influence costs. These can be measured by the size of average supplied quantity per connection or the ratio of residential to non- residential consumption (Aubert – Reynaud (2005), Haug (2007), Garcia-Thomas (2001), Mizutani-Urakami (2001)).
Some other studies pay attention to the impact of private vs. public operation, price regulatory schemes, and institutional factors (e.g. corruption) on the unit cost of water services (Berg, 2006)
Lastly, Ofwat (www.ofwat.gov.uk), the water authority of the United Kingdom lists the explanatory factors of water supply costs as the following: resource characteristics, population or economic growth, density of connections, turnover of occupation, the
“quality gap” between raw and treated water, topography, impact of regional factor markets, asset condition, customer mix, and standards of service. Besides these, the size of the utility, the degree of water treatment, the type of water sources, and the extent of pumping needed are emphasized as cost influencing factors.
Our hypotheses were shaped partly by findings of past surveys, and partly by the availability of data within the IBNET database. We tested over two dozens of cost models, and the results of selected models are presented in Section 4.
3.
3. 3.
3. Data Used Data Used Data Used Data Used
CEE water utility performance data has been systematically collected by the World Bank for about a decade now. For a few countries collected data covers the period 1995 to 2007, while most countries have data for a 3-5 year period sometime after 2000. We used data starting from 1997, since data was sporadic in the years before. The total number of surveyed companies is 637. Since not all companies have been surveyed in all years, the annual sample size is lower, as depicted in Figure 1 below. Data for Russia is missing for 2002 that is the reason for the lower sample size in that year.
Figure 1 Figure 1 Figure 1
Figure 1 The Number of Surveyed Companies The Number of Surveyed Companies The Number of Surveyed Companies The Number of Surveyed Companies
After the annual submission of surveyed data by the country consultants, data is verified by the IBNET experts, and flawed data is either corrected or rejected from the database.
From the raw data indicators are computed and filled into a database of indicators, which can be searched through the IBNET website (www.ib-net.org). This database of indicators has been used for our statistical analysis.
The distribution of the 2005 values of those indicators which were used in the presented cost models (Section 4) is depicted below. While the database contains more recent data as well, data from the largest number of countries and companies was collected in 2005.
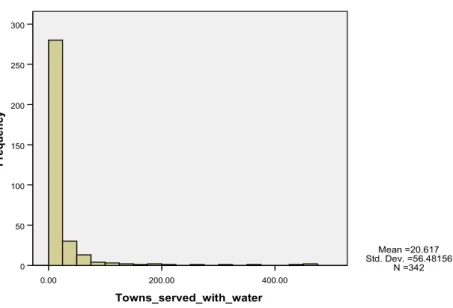
Most utilities serve multiple towns, the average being 20.6. A large service area, on the one hand, may lower the average unit cost as a manifestation of economies of scale. It may, however, also elicit higher costs if it consists of lots of small, distant settlements.
Figure 2 describes the distribution of the sample based on the number of towns served
0 50 100 150 200 250 300 350 400 450
1997 1998 1999 2000 2001 2002 2003 2004 2005 2006 2007
with water. The distribution of the number of towns served with sewage would look very similar graphically.
Figure 2 Figure 2 Figure 2
Figure 2 Number of Towns Served with Water among Surveyed Companies in 2005 Number of Towns Served with Water among Surveyed Companies in 2005 Number of Towns Served with Water among Surveyed Companies in 2005 Number of Towns Served with Water among Surveyed Companies in 2005
400.00 200.00
0.00
Towns_served_with_water
300
250
200
150
100
50
0
Frequency
Mean =20.617 Std. Dev. =56.48156
N =342
Towns_served_with_water
Most of the surveyed companies serve less than half million inhabitants, with over half of all utilities providing water to less than 300.000 people, which is considered by several studies as being below the threshold of the optimal size from the perspective of efficient operation. As shown by Figure 3 and Figure 4, there are only a handful of companies serving over 1 million inhabitants, and just a few over 1.5 million – these are mostly utilities operating in metropolitan areas such as Moscow or Budapest. Population served with sewage would show an analogous distribution.
Figure 3 Figure 3 Figure 3
Figure 3 Population Served with Water among Surveyed Companies Population Served with Water among Surveyed Companies Population Served with Water among Surveyed Companies Population Served with Water among Surveyed Companies in 2005 in 2005 in 2005 in 2005 (thousand inhabitants)
(thousand inhabitants) (thousand inhabitants) (thousand inhabitants)
10000.00 8000.00
6000.00 4000.00
2000.00 0.00
Population_served_water
300
200
100
0
Frequency
Mean =237.5931 Std. Dev. =544.64759
N =384
Population_served_water
Figure 4 Figure 4 Figure 4
Figure 4 Population Served with Water among Surveyed Companies with Population Served with Water among Surveyed Companies with Population Served with Water among Surveyed Companies with Population Served with Water among Surveyed Companies with Population below 1 million in 2005 (thousand inhabitants)
Population below 1 million in 2005 (thousand inhabitants) Population below 1 million in 2005 (thousand inhabitants) Population below 1 million in 2005 (thousand inhabitants)
1000,00 800,00
600,00 400,00
200,00 0,00
Population_served_water_under_1M
150
100
50
0
Frequency
Mean = 170,8885 Std. Dev. = 212,34082 N = 370
Population_served_water_under_1M
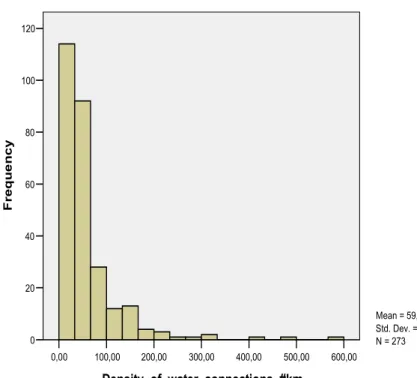
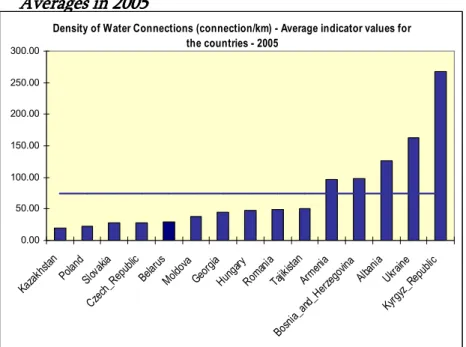
The density of water connections (Figure 5) is the number of connections per km of water network. In general, the denser a network, i.e. the higher the indicator value is, the less
costly it is to serve the area. The wastewater network on average has a higher density (Figure 7) than water network, most likely because more densely populated towns have a higher sewer penetration than sparsely populated villages. Average national figures of these two indicators are in Figure 6 and Figure 8. Interestingly, low income countries appear on both ends of the scale, while there is less variation among higher income countries. Network density seems to have little relation to the level of economic development, while it is influenced more heavily by factors such as geographical circumstances, types of housing (individual houses vs. blocks of apartments), and service penetration (only in big cities, or also in smaller settlements).
Figure 5 Figure 5 Figure 5
Figure 5 Density of Water Connections among Surveyed Companies in 2005 Density of Water Connections among Surveyed Companies in 2005 Density of Water Connections among Surveyed Companies in 2005 Density of Water Connections among Surveyed Companies in 2005
600,00 500,00 400,00 300,00 200,00 100,00 0,00
Density_of_water_connections_#km
120
100
80
60
40
20
0
Frequency
Mean = 59,5494 Std. Dev. = 67,98904 N = 273
Density_of_water_connections_#km
Figure 6 Figure 6 Figure 6
Figure 6 Density of Density of Density of Density of Water Connections among Surveyed Companies, Country Water Connections among Surveyed Companies, Country Water Connections among Surveyed Companies, Country Water Connections among Surveyed Companies, Country Averages in 2005
Averages in 2005 Averages in 2005 Averages in 2005
Figure 7 Figure 7 Figure 7
Figure 7 Density of Wastewater Connections among Surveyed Companies in 2005 Density of Wastewater Connections among Surveyed Companies in 2005 Density of Wastewater Connections among Surveyed Companies in 2005 Density of Wastewater Connections among Surveyed Companies in 2005
800,00 600,00
400,00 200,00
0,00
Density_of_sewer_connections_#km
140
120
100
80
60
40
20
0
Frequency
Mean = 74,8808 Std. Dev. = 88,43127 N = 240
Density_of_sewer_connections_#km
Density of Water Connections (connection/km) - Average indicator values for the countries - 2005
0.00 50.00 100.00 150.00 200.00 250.00 300.00
Kazakhstan Poland
Slovakia Czech_Republic
Belarus Moldova
Georgia Hungary
Romania Tajikistan
Armenia
Bosnia_and_Herzegovina Albania
Ukraine
Kyrgyz_Republic
Figure 8
Figure 8 Figure 8
Figure 8 Density of Wastewater Connections among Surveyed Companies, Country Density of Wastewater Connections among Surveyed Companies, Country Density of Wastewater Connections among Surveyed Companies, Country Density of Wastewater Connections among Surveyed Companies, Country Averages in 2005
Averages in 2005 Averages in 2005 Averages in 2005
Non-revenue water is the difference between produced and sold water. The actual technical loss, which more directly corresponds to cost efficiency, also takes account of water use which is not paid for (e.g. fire department, flushing of the sewer, illegal consumption), but lacking such data, we simply used non-revenue water as a percent of all produced water. Higher levels of non-revenue water signal higher average cost per m3 of sold water, since more water needs to be produced and transported to some distance at a cost to achieve a certain level of delivered water. In modern, well maintained water networks non-revenue water is generally less than 20% - in some countries values below 10% are considered as desirable. Among sampled companies the mean figure is 34%, while only 30% of them have a value below 20%, and at 22% of the companies more than half of all produced water is non-revenue water.
Density of Sewer Connections (connection/km) - Average indicator values for the countries - 2005
0.00 50.00 100.00 150.00 200.00 250.00 300.00
Kazakhstan Poland
Slovakia Belarus Czech_Republic
Moldova Tajikistan
Romania Hungary
Kyrgyz_Republic Georgia
Bosnia_and_Herzegovina Armenia
Albania Ukraine
Figure 9
Figure 9 Figure 9
Figure 9 Non Revenue Water among Surveyed Companies in 2005 (%) Non Revenue Water among Surveyed Companies in 2005 (%) Non Revenue Water among Surveyed Companies in 2005 (%) Non Revenue Water among Surveyed Companies in 2005 (%)
1,00 0,80
0,60 0,40
0,20 0,00
Non_Revenue_Water
60
50
40
30
20
10
0
Frequency
Mean = 0,3419 Std. Dev. = 0,2134 N = 346
Non_Revenue_Water
Figure 10 shows the country average values of non-revenue water. Since non-revenue water is a good proxy for the general condition of the water network, it can be assumed to be related to economic development. In this respect, the only real surprise is the position of Belarus with a value of 15% - suggesting that Belarus is either an exception to the rule, or there is a problem with data reliability.
Figure 10 Figure 10 Figure 10
Figure 10 Non Revenue Water among Surveyed Companies, Country Averages in Non Revenue Water among Surveyed Companies, Country Averages in Non Revenue Water among Surveyed Companies, Country Averages in Non Revenue Water among Surveyed Companies, Country Averages in 2005 (%)
2005 (%) 2005 (%) 2005 (%)
Residential water consumption is a specific measure of economies of scale. Since the majority of costs, usually between 50% and 80%, at water utilities are fixed costs, delivering more water at some additional variable cost will reduce the average cost of service. Therefore higher consumption, measured here as higher residential consumption per person, indicates lower unit costs.
Non Revenue Water (%) - Average indicator values for the countries - 2005
0%
10%
20%
30%
40%
50%
60%
70%
80%
90%
Belarus Poland Czech_Republic
Hungary Russia
Slovakia Kazakhstan
Ukraine Georgia
Romania Moldova
Tajikistan Kyrgyz_Republic Bosnia_and_Herzegovina
Albania Armenia
Figure 11 Figure 11 Figure 11
Figure 11 Residential Water Consumption among Surveyed Companies in 2005 Residential Water Consumption among Surveyed Companies in 2005 Residential Water Consumption among Surveyed Companies in 2005 Residential Water Consumption among Surveyed Companies in 2005 (liter/person/day)
(liter/person/day) (liter/person/day) (liter/person/day)
1500,00 1200,00 900,00
600,00 300,00 0,00
Residential_Consumption_lpersonday
140
120
100
80
60
40
20
0
Frequency
Mean = 152,8687 Std. Dev. = 121,94519 N = 356
Residential_Consumption_lpersonday
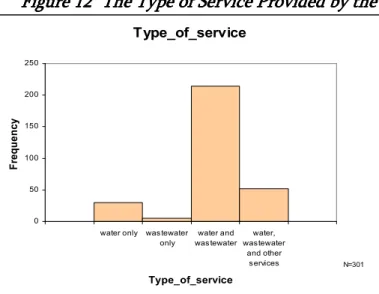
Some of the past studies discuss how economies of scope, derived from providing more than one service, exist in the water utility sector. Figure 12 reviews the distribution of the sampled companies based on the services they provide. Most companies deliver both services, a little more than 10% of all companies provide only water service, and only a handful of utilities are pure wastewater companies.
Figure 12 Figure 12 Figure 12
Figure 12 The Type of Service Provided by the Surveyed Companies, 2005 The Type of Service Provided by the Surveyed Companies, 2005 The Type of Service Provided by the Surveyed Companies, 2005 The Type of Service Provided by the Surveyed Companies, 2005
Type_of_service
0 50 100 150 200 250
water only was tewater only
water and was tewater
water, wastewater
and other services
Type_of_service
Frequency
N=301
4.
4. 4.
4. Statistical Results Statistical Results Statistical Results Statistical Results
4.1.
4.1. 4.1.
4.1. Descriptive Statistics Descriptive Statistics Descriptive Statistics Descriptive Statistics
The data reveal very significant differences across countries in terms of unit costs. Figure 13 and Figure 14 show the distribution of the log unit cost of water service in 2003-2004 for different countries in the database. We included all observations from these two years to make the data comparable across countries. Also, using data from two rather than one year doubles the number of observations, while not reducing comparability significantly.
As the figures show the (natural) logarithm of unit costs, the differences between countries are very large. There is at least a 3-fold difference between the typical Central European firm and the typical firm from the former Soviet Union. Countries at the same level of development, however, cluster close to each other: the Czech Republic and Hungary, for example, can be characterized by similar cost distributions. Similarly, the distribution of water service unit cost is very similar in Russia, Ukraine and Kazakhstan.
The figures also suggest, however that while between-country differences dominate, unit costs are also widely distributed within the same country. These observations suggest that both macro (country-level) and micro (firm-level) determinants play an important role in determining the firm-level unit cost.
Figure 13 Figure 13 Figure 13
Figure 13 Di Di Di Distribution of Log Unit Cost in Central European Countries, 2003 stribution of Log Unit Cost in Central European Countries, 2003 stribution of Log Unit Cost in Central European Countries, 2003----2004 stribution of Log Unit Cost in Central European Countries, 2003 2004 2004 2004
Figure 14 Figure 14 Figure 14
Figure 14 Distribution of Log Unit Cost in Former Soviet Union Countries, 2003 Distribution of Log Unit Cost in Former Soviet Union Countries, 2003 Distribution of Log Unit Cost in Former Soviet Union Countries, 2003 Distribution of Log Unit Cost in Former Soviet Union Countries, 2003---- 2004 2004
2004 2004
To illustrate the relationship between economic development and unit values further, Figure 15 shows the unconditional relationship between log unit operating costs and GNI per capita calculated at Purchasing Power Parity for all countries and all years. The figure shows a very strong positive relationship between national income and unit cost. The
Figure 15 Figure 15 Figure 15
Figure 15 The Relationship between Country Price Level and Operating Costs, All The Relationship between Country Price Level and Operating Costs, All The Relationship between Country Price Level and Operating Costs, All The Relationship between Country Price Level and Operating Costs, All Ob Ob
Ob Observations servations servations servations
As another indication of the variation of unit costs among and within countries, Table 1 shows the number of observations and the most important descriptive statistics for the dependent variables.
Table 1 Table 1 Table 1
Table 1 The Unit Cost The Unit Cost The Unit Cost The Unit Cost of Water and Wastewater Services of Water and Wastewater Services of Water and Wastewater Services of Water and Wastewater Services
Log water unit cost Log wastewater unit cost
country Observations mean
standard
deviation mean
standard deviation
Albania 45 -0.309 0.442 -2.263 0.834
Armenia 13 -1.418 0.901 -3.245 1.161
Belarus 65 -1.569 0.617 -4.618 1.794
Bosnia and Herzegovina 36 0.085 0.656 -1.342 0.847
Croatia 59 -1.100 1.354 -2.015 1.232
Czech Republic 85 -0.166 0.368 -1.486 0.521
Georgia 119 -2.408 1.091 -3.829 1.149
Hungary 186 -0.274 1.217 -0.786 0.907
Kazakhstan 129 -1.473 0.651 -2.584 0.804
Kyrgyz Republic 29 -2.037 0.543 -3.084 1.295
Moldova 180 -0.195 0.551 -0.880 0.685
Poland 163 -0.161 0.385 -0.739 0.499
Romania 189 -0.857 0.680 -2.456 0.733
Russia 241 -1.285 0.538 -2.149 0.604
Ukraine 152 -1.544 0.512 -2.058 0.727
4.2.
4.2. 4.2.
4.2. The Regression Analysis The Regression Analysis The Regression Analysis The Regression Analysis
To model the most important determinants behind the unit cost of water and wastewater services, we apply regression models. Our specification is the following:
,
which affect uniformly the level of unit costs for all firms in all countries in the sample, are taken up by the year dummy variables.
The error term of the regression is a combination of two effects. is the firm-fixed effect. It represents all unobserved firm-level characteristics, which do not change in time. Consequently, the specification assumes that the unobserved attributes of each firm (the quality of its management, the specificities of its location, its inherited assets, etc) can be summarized as a firm-level constant, which is additively related to other variables.
is the idiosyncratic shock, representing the cost shock of firm in year . We use heteroskedasticity-consistent standard errors to allow for unknown form of heteroskedasticity (any distribution of ) in all regressions. We assume that these shocks are uncorrelated across firms and also that they are not serially correlated across years.
Unobserved firm-level heterogeneity may lead to serious problems, if is correlated with the explanatory variables. In this case, the estimated parameters can be biased, as we cannot separate the effect of the explanatory variable from firm-level heterogeneity. If, for example, firms in urbanized areas are more likely to have better managers (as better managers want to work in cities), and variables measuring urbanization, for example network density, will be correlated. As a consequence these variables will take up the effect of good management. In this example, we can expect a negative correlation between and network density, and, as a consequence, the coefficient of density can be biased downward.
Our dataset consists of observations of the same firm from different years. This panel structure of the data makes it possible to solve the problem of firm-level unobserved heterogeneity. By differentiating the equation (or rather by using the fixed effect transformation), the s can be eliminated from the equation. As is a constant, it can be calculated from average performance of the firm over the years. If one transforms the equation, by subtracting the average values of the variables from all explanatory variables and the dependent variables (fixed effects transformation), one can get rid of the , and estimate the true coefficients.
To see the robustness of the results, we estimate our model in 5 different ways. The main difference between these methods is the source of variation used for estimating the parameters. Variables vary across countries, across firms, and within one firm in different time periods. In the simplest case, we can use all three sources of variation to identify the parameters.
Then, we may worry, that countries are very different from each other, and these differences are not satisfactorily described by the small set of variables we use in our model. Also, for example, national income can be correlated with a large number of
institutional variables, which affects firm-level accounting costs. This may lead to a biased coefficient estimate of national income. In this case, we may choose not to use across- country variation to identify our parameters. For this, one can include country dummies (country fixed effects), which take up the average cost level in each country. As a consequence, parameters will be identified only from the variation across firms in the same country and across time. This specification assumes that the effect of the explanatory variables is the same in each country, but the level of unit cost can differ across countries.
In such a model it is harder to identify the effect of variables which hardly vary within a country.
Third, as was mentioned before, firm-level unobserved heterogeneity can also be a problem. If the variables are not able to fully describe the differences across firms, firm- level fixed effects should be included into the model. In this case we only identify the parameters from the way the dependent variable changes as the explanatory variables vary in different years for the same firm. As a consequence, we omit the across-country and across-firm variation, and only use within-firm variation. It is only possible to identify the effect of time varying variables in a fixed effect specification.
• OLS: The Ordinary Least Squares is the benchmark estimate. While we control for year fixed effects with year dummies, country or firm-level heterogeneity is not corrected. As a
consequence, we identify the coefficient of the variables from all kinds of variation present in the sample.
• Country fixed effects: In this specification we also include a full set of country dummy variables to control for unobserved differences between countries.
• Country-year fixed effects: Another concern can be that different macroeconomic shocks took place in different countries in the same year. The Russian crisis, for example, may have affected quite differently Russia than the Central European countries. To check whether the results change importantly because of this, we include the full set of interactions of country and year dummies.
• Country fixed effects and firm random effects: Our final concern is that, as it was suggested, unobserved firm-level heterogeneity can affect our results. One solution for this is the
4.3.
4.3. 4.3.
4.3. Regression Resu Regression Resu Regression Resu Regression Results for the Water Service lts for the Water Service lts for the Water Service lts for the Water Service
Table 2 and Table 3 show our results when the dependent variable is the log unit cost of water service. We present the results separately for the full sample and for the region excluding the former Soviet Union, as there are important differences between those countries and Central Europe.
Log GNI per capita is significantly positive, especially in case of the sample without the former Soviet Union, suggesting that water service in more developed countries is more expensive. As we control for the price level of the country, this effect is the direct effect of economic development rather than the indirect effect taking place through higher prices as a consequence of the Balassa-Samuelson effect. More advanced regions differ in terms of the required quality of water service, which may lead to higher costs. Moreover, the results also suggests that price level has no significant effect when country heterogeneity is treated with country fixed effects.
The results also suggest that economies of scale are present. The effect of the number of residents served is always significant. Its effect varies between -0.7 and -0.9 in most specifications, suggesting that 10 percent increase in the population served leads to 7 to 9 percent reduction in unit water cost.
The regressions also provide evidence for the hypothesis that firms providing both water and wastewater services operate with somewhat smaller unit costs.
Density of water connections has a positive coefficient for Central European economies if firm level heterogeneity is not taken into account. This shows that firms operating in denser areas, probably in cities, face higher unit costs. This can also be related to other unobservable attributes of the firms, which are correlated with the urbanization level of the area. If one controls for this firm level heterogeneity, the firm fixed effects specification provides evidence for economies of scale in this respect. If a firm starts to serve more dense areas, its unit costs may decrease.
Non-revenue water is an important determinant of the unit cost of water service. 10 percent increase in non-revenue water leads to 3 percent increase in the unit cost of water provision, when one controls for unobserved firm heterogeneity.
The variable of private involvement is only significant in some specifications. This, however, can be a consequence of the fact that this variable does not vary substantially within countries, privately operated utilities are relatively scarce.
The strongest and most robust explanatory variable is the water consumption per capita variable. If a firm serves an area with 10 percent higher per capita water consumption, its
unit costs decrease by about 8 percent. This firm-level variable reflects strong economies of scale. It can be strongly correlated with urbanization and income level of the service area, which is not taken up by the country-level GNI variable, which does not vary across firms.
All in all, these regression models have a very large explanatory power, above 70%. In other words, more than 70% of the cost variation in our sample can be explained by the variables included in our analysis.
Table 2 Table 2 Table 2
Table 2 Results for the Log Unit Cost of Water Service for All Surveyed Results for the Log Unit Cost of Water Service for All Surveyed Results for the Log Unit Cost of Water Service for All Surveyed Results for the Log Unit Cost of Water Service for All Surveyed Countries
Countries Countries Countries
(1) (2) (3) (4) (5)
VARIABLES OLS
country fixed effect
country-year fixed effect
country fixed effect, firm
random effect
firm fixed effect Log GNI per capita, ppp,
1000 international dollar 0.7156*** -0.1645 1.1590*** -0.1222 -0.1218 (0.0446) (0.2988) (0.1831) (0.1589) (0.2323)
Log Price level 0.5076*** 0.1119 0.0000 0.0827 0.1010
(0.0945) (0.2357) (0.0000) (0.1211) (0.1646) Log Population served –
water -0.8062*** -0.5967*** -0.5803*** -0.7325*** -0.7431***
(0.0346) (0.0395) (0.0412) (0.0422) (0.0775) Both water and
wastewater -0.1322* -0.0107 -0.0083 0.2038 0.2241
(0.0756) (0.0833) (0.0803) (0.1459) (0.2082) Density of water
connections 0.0003 -0.0000 -0.0001 -0.0003 -0.0009
(0.0003) (0.0004) (0.0004) (0.0005) (0.0010) Non Revenue Water
(percent) 0.8303*** 0.4833*** 0.4792*** 0.3229*** 0.3213**
(0.0991) (0.0923) (0.0915) (0.1015) (0.1599) Private sector
involvement 0.0128 0.0200* 0.0163 -0.0265 -0.0471
(0.0127) (0.0112) (0.0108) (0.0173) (0.0351) Towns served with water 0.0006* 0.0004 0.0004 0.0007 0.0010**
(0.0004) (0.0004) (0.0004) (0.0004) (0.0004) Log water consumption
per capita -0.7551*** -0.5830*** -0.5644*** -0.7902*** -0.8418***
(0.0386) (0.0404) (0.0423) (0.0397) (0.0650)
Constant -1.6011*** 0.8965 -0.3118 2.4450** 1.6166
(0.6094) (1.5027) (0.2794) (0.9609) (1.1769)
Observations 1268 1268 1268 1268 1268
R-squared 0.693 0.788 0.797 0.761 0.763
Note: A full set of time dummies is included in all regressions. Robust standard errors in parenthesis.
Table 3 Table 3 Table 3
Table 3 Results Results Results Results for the Log Unit Cost of Water Service for Central European for the Log Unit Cost of Water Service for Central European for the Log Unit Cost of Water Service for Central European for the Log Unit Cost of Water Service for Central European Countries
Countries Countries Countries
(6) (7) (8) (9) (10)
Without the former Soviet Union
OLS
country fixed effect
country-year fixed effect
country fixed effect, firm
random effect
firm fixed effect Log GNI per capita, ppp,
1000 international dollar 0.8650*** 0.3679 0.8702*** 0.6168** 0.6033*
(0.0976) (0.7699) (0.0717) (0.2945) (0.3592)
Log Price level 0.2924** -0.5369 0.0000 -0.1380 -0.1337
(0.1426) (0.7004) (0.0000) (0.2335) (0.2208) Log Population served -
water -0.6801*** -0.6921*** -0.7134*** -0.8256*** -0.9110***
(0.0607) (0.0588) (0.0613) (0.0530) (0.1119) Both water and
wastewater -0.3362*** -0.2632*** -0.2576*** -0.0633 0.0066
(0.0861) (0.0924) (0.0934) (0.0656) (0.0788) Density of water
connections 0.0019*** 0.0012*** 0.0012*** -0.0002 -0.0016**
(0.0003) (0.0004) (0.0004) (0.0006) (0.0007) Non Revenue Water
(percent) 0.6257*** 0.6000*** 0.5785*** 0.2710** 0.2435*
(0.1179) (0.1212) (0.1194) (0.1100) (0.1361) Private sector
involvement -0.0022 0.0169* 0.0180* -0.0298* -0.0397
(0.0098) (0.0095) (0.0094) (0.0169) (0.0314)
Towns served with water -0.0000 0.0001 0.0001 0.0003 0.0005
(0.0003) (0.0003) (0.0004) (0.0004) (0.0004) Log water consumption
per capita -0.6769*** -0.7156*** -0.7353*** -0.8019*** -0.8173***
4.4. 4.4. 4.4.
4.4. Regression Results for the Wastewater Service Regression Results for the Wastewater Service Regression Results for the Wastewater Service Regression Results for the Wastewater Service
Table 4 and Table 5 show our results when the dependent variable is the log unit cost of wastewater service. Like in the case of water services, we present the results separately for the full sample and for the region excluding the former Soviet Union, as there are important differences between those countries and Central Europe.
From the macro variables the GNI per capita seems to be an important determinant of unit cost in Central Europe, but not in former Soviet countries. Higher quality and environmental requirements are likely to be more important in higher income countries.
Price level, on the other hand, does not seem to matter when country- and year fixed effects are included.
Economies of scale seem to be present in a number of dimensions. First, wastewater discharge per capita is a very important determinant of wastewater unit costs. The coefficient of this variable is very robust, and its value is between -0.6 and -0.5 in most specifications. 10 percent increase in per capita wastewater discharge is related to 5-6 percent lower cost on average. Second, the density of sewer connections also has a cost- reducing impact. This variable is also significant in economic terms. As the standard deviation of this variable is just above 100, a one-standard-deviation increase of density of sewer connections leads to a decrease of about 20 percent in the unit cost of wastewater service. Third, the larger the population served by the firm, the lower is the unit cost. If a firm serves 10 percent more people, its unit cost decreases with 2.3 percent. This effect is significant, but lower than for water services. Fourth, the evidence suggests that firms providing both water and wastewater service operate with a lower level of unit costs. This effect is only significant in Central Europe, however. The effect is quite large, and similar to what has been found for water service: about 30 percent. Note, that only the first effect is robust to the fixed effects specification. This is not surprising because the within-firm variation of the other variables is small.
Finally, the results suggest that firms with private involvement are more productive when providing wastewater service. The unit cost of such firms is about 5 percent lower than that of state-owned firms.
Table 4 Table 4 Table 4
Table 4 Results for the Log Unit Cost of Wastewater Service for All Surve Results for the Log Unit Cost of Wastewater Service for All Surve Results for the Log Unit Cost of Wastewater Service for All Surve Results for the Log Unit Cost of Wastewater Service for All Surveyed yed yed yed Countries
Countries Countries Countries
(1) (2) (3) (4) (5)
VARIABLES OLS
country fixed effect
country-year fixed effect
country fixed effect, firm
random effect
firm fixed effect Log GNI per capita, ppp,
1000 international dollar 0.5575*** -0.6265 0.3900 -0.1590 -0.1379 (0.0768) (0.4874) (0.3226) (0.2595) (0.3822)
Log Price level 0.7702*** 0.4102 0.0000 0.0900 0.0629
(0.2093) (0.3787) (0.0000) (0.1709) (0.2163) Log Population served -
wastewater -0.2017*** -0.1143*** -0.1239*** -0.0973*** -0.0764 (0.0300) (0.0239) (0.0253) (0.0372) (0.0864)
Both water and wastewater 0.1970 0.0663 0.0899 0.3131 0.3816
(0.2411) (0.1868) (0.1930) (0.2188) (0.2811) Density of sewer
connections -0.0014*** -0.0021*** -0.0021*** -0.0014*** -0.0007 (0.0004) (0.0003) (0.0003) (0.0003) (0.0006) Private sector involvement -0.1021*** -0.0330* -0.0414** 0.0098 0.0269
(0.0254) (0.0186) (0.0183) (0.0292) (0.0469) Towns served with
wastewater -0.0002 0.0013*** 0.0011*** 0.0002 -0.0006
(0.0005) (0.0003) (0.0004) (0.0005) (0.0009) Log residential wastewater
discharge -1.0322*** -0.6447*** -0.6210*** -0.5835*** -0.5932***
(0.0593) (0.0532) (0.0530) (0.0669) (0.1002)
Constant -1.9933 -0.5842 1.0436 0.6372 0.0419
(1.3405) (2.2663) (0.7231) (1.3774) (1.5453)
Table 5 Table 5 Table 5
Table 5 Results for the Log Unit Cost of Wastewater Service for Central Results for the Log Unit Cost of Wastewater Service for Central Results for the Log Unit Cost of Wastewater Service for Central Results for the Log Unit Cost of Wastewater Service for Central European Countries
European Countries European Countries European Countries
(6) (7) (8) (9) (10)
Without the former Soviet Union
OLS
country fixed effect
country-year fixed effect
country fixed effect, firm
random effect
firm fixed effect Log GNI per capita, ppp,
1000 international dollar 0.6544*** 2.0256** 1.5936*** 1.5339*** 1.9120**
(0.1710) (0.8991) (0.0972) (0.2629) (0.8745)
Log Price level 1.9783*** -0.5976 0.0000 0.0420 -0.8374
(0.2325) (0.8191) (0.0000) (0.3383) (0.5478) Log Population served -
wastewater -0.2472*** -0.2324*** -0.2364*** -0.0716 0.0532
(0.0372) (0.0458) (0.0467) (0.0585) (0.1021) Both water and wastewater -0.4474** -0.2951** -0.2836* -0.1837* -0.1256 (0.1742) (0.1472) (0.1506) (0.1097) (0.1137) Density of sewer
connections -0.0026*** -0.0023*** -0.0023*** -0.0009** 0.0005 (0.0004) (0.0003) (0.0004) (0.0004) (0.0007) Private sector involvement -0.1022*** -0.0507*** -0.0535*** -0.0174 0.0149
(0.0222) (0.0196) (0.0197) (0.0289) (0.0361) Towns served with
wastewater -0.0002 0.0007** 0.0006* 0.0000 0.0003
(0.0004) (0.0003) (0.0003) (0.0004) (0.0004) Log residential wastewater
discharge -0.5744*** -0.4228*** -0.4162*** -0.5658*** -0.5301***
(0.0829) (0.0675) (0.0694) (0.0755) (0.1290)
Constant -11.0126*** 0.4516 -1.8545*** -2.2301 1.5952
(1.3209) (6.0700) (0.4380) (1.8085) (3.3274)
Observations 631 631 631 631 631
R-squared 0.724 0.792 0.800 0.772 0.781
Note: A full set of time dummies is included in all regressions. Robust standard errors in parenthesis.
5.
5. 5.
5. Summary Summary Summary Summary
From the perspective of benchmarking processes, direct comparison of the performance indicators of water and wastewater utilities is of limited merit, since, in addition to internal efficiency, operating conditions also greatly influence actual performance.
Numerous past studies found that specific operating attributes, such as size and network density, substantially impact the unit costs of service provision. Within the present project we tested many of these assumptions on the Central and Eastern European water utility database of IBNET, using multiple variable regression analysis.
In case of water service we arrived at the following main conclusions:
• Countries with higher GDP per capita experience higher water service costs, most probably because of advanced quality of the service – the differing price level of the countries has been controlled for.
• Economies of scale are clearly present, larger companies, and also utilities where consumption per capita is higher, on average experience lower unit costs.
• The density of water connections may decrease the cost level, but this relationship is not as clear-cut as we expected.
• The condition of the infrastructure, measured for our purposes by the level of non- revenue water, noticeably affects the cost level. The higher the ratio of non- revenue water, the higher the unit costs of the utility.
The conclusions for wastewater services are mainly related to economies of scale. There are multiple variables suggesting that large size is an important factor of below average unit costs. Economies of scope are also present – firms with both water and wastewater service can operate at a lower cost than single service utilities.
A key message of our exercise is that the usefulness of benchmarking programs can be improved through the application of advanced statistical techniques. The explanatory power of most of our cost models is above 70%, i.e. well over two-third of the variation in
6.
6. 6.
6. Literature Literature Literature Literature
S. Berg: Empirical Studies of the Water Sector. Prepared by PURC Benchmarking Task Force. 2006.
C. Aubert – A. Reynaud: The Impact of Regulation on Cost Efficiency: An Empirical Analysis of Wisconsin Water Utilities. (Journal of Productivity Analysis, 23, 383–409, 2005)
P. Haug: Local Government Control and Efficiency of the Water Industry: An Empirical Analysis of Water Suppliers in East Germany (Halle, Institute for Economic Research, 2007)
S. Garcia - A. Thomas: The Structure of Municipal Water Supply Costs: Application to a Panel of French Local Communities (Journal of Productivity Analysis, 16, 5–29, 2001) F. Mizutani – T. Urakami : Identifying network density and scale economies for Japanese water supply organizations (Papers in Regional Science, 80, 211–230, 2001)
P. Fabbri – G. Fraquelly : Costs and Structure of Technology in the Italian Water Industry (Empirica 27: 65–82, 2000)