E-CONOM
Online tudományos folyóirat I Online Scientific Journal
Főszerkesztő I Editor-in-Chief
KOLOSZÁR László
Kiadja I Publisher
Soproni Egyetem Kiadó I University of Sopron Press
A szerkesztőség címe I Address
9400 Sopron, Erzsébet u. 9., Hungary e-conom@uni-sopron.hu
A kiadó címe I Publisher’s Address
9400 Sopron, Bajcsy-Zs. u. 4., Hungary
Szerkesztőbizottság I Editorial Board
CZEGLÉDY Tamás HOSCHEK Mónika JANKÓ Ferenc SZÓKA Károly
Tanácsadó Testület | Advisory Board
BÁGER Gusztáv BLAHÓ András FÁBIÁN Attila FARKAS Péter GILÁNYI Zsolt KOVÁCS Árpád LIGETI Zsombor POGÁTSA Zoltán SZÉKELY Csaba
Technikai szerkesztő I Technical Editor
TAKÁCS Eszter
A szerkesztőség munkatársa I Editorial Assistant
PATYI Balázs
ISSN 2063-644X
DOI: 10.17836/EC.2018.1.066
GROSSMANN, DAVID1
Testing the impact of higher capital Requirements on unlisted German banks for a short-term investment period
Higher capital requirements of Basel III are criticized for increasing the cost of capital for banks. Against this backdrop, Admati et al. (2013) argue that higher equity ratios are not expensive because the required return on equity will decrease. Previous studies have empirically tested this argument, but focused only on listed banks.
We expand the debate with the examination of 78 unlisted banks in Germany. The empirical model of Miles et al. (2012) is applied to test the impact of higher capital requirements on the cost of capital. We find that bank’s funding costs increase insignificantly for unlisted German banks for a short-term investment horizon.
Keywords: Bank Capital Requirements, Capital Structure, Cost of Capital, Modigliani/Miller, WACC JEL Codes: G21, G28, G32
A magasabb tőkeszükséglet rövid távú befektetési időszakra vonatkozó vizsgálata a nem listázott német bankok esetében
A Basel III magasabb tőkeszükséglete sokak által kritizált, mert megnöveli a bankok tőkeköltségét. Ezzel szem- ben, Admati et al. (2013) azt állítják, hogy a magasabb tőkearányok nem költségesebbek, mivel a szükséges sa- játtőke-arányos megtérülés csökkenni fog. Korábbi tanulmányok empirikusan tesztelték ezt az állítást, de csak a listázott (tőzsdén elérhető) bankokra fókuszáltak. Mi kibővítettük ezt a vizsgálatot 78 nem listázott németországi bankkal. Miles et al. (2012) empirikus modelljét alkalmaztuk, hogy teszteljük a magasabb tőkeszükségletnek a tőkeköltségre gyakorolt hatását. Azt a következtetést vontuk le, hogy a bankok finanszírozási költségei elenyésző mértékben növekedtek a rövid távú befektetési időszakban.
Kulcsszavak: banki tőkeszükséglet, tőkeszerkezet, tőkeköltség, Modigliani–Miller, WACC JEL-kódok: G21, G28, G32
Introduction
As a consequence of the financial crisis, the Basel Committee on Banking Supervision (BCBS, 2011) set higher capital requirements to strengthen the global banking system. How- ever, higher capital levels are criticized to significantly increase the cost of capital for banks, which will raise credits rates and jeopardizes the economic growth. To name a few: Cosimano and Hakura (2011) predict that higher funding costs will reduce loan growth by 1.3 percent in the long run. Elliot et al. (2012) assess the impact of higher capital ratios on lending rates, which will rise up to 28 basis points. Elliot (2013) claims that higher bank capital would lead to significant economic costs, a reduced lending, and shifts to less regulated sectors. Against this backdrop, Admati et al. (2013) argue that more equity is not socially expensive and that higher capital levels will lead to a better lending performance. Admati et al. (2013) motivate their theoretical argumentation with the use of the Modigliani and Miller (M/M) propositions that lower levels of leverage will decrease the risk premium on equity. The empirical applica- tion is provided by Miles et al. (2012), who use the method of the weighted average cost of
1 PhD-student at Andrássy University Budapest, Hungary (david.grossmann@mail.de).
I am grateful to Martina Eckardt, Giovanni Millo, Stefan Okruch, Peter Scholz, Aline Taenzer, Ursula Wal- ther, participants of the Claussen-Simon Graduate Centre at HSBA, and session participants of the 2016
“Merton H. Miller” doctoral seminar of the European Financial Management Association for helpful com- ments and discussions. The paper benefited from the comments and remarks of two anonymous referees. I would also like to thank Goetz Greve, the Claussen-Simon Foundation, and the Association of Friends &
Sponsors of the HSBA.
67
capital (WACC) to illustrate the impacts of higher capital requirements on the funding costs of listed banks in the UK. On this basis, other studies focus on listed banks in the USA, Eu- rope, and Switzerland.
However, the majority of banks of the largest economy in Europe and unlisted banks, in general, have not been taken into account. This leads to the question: do higher capital re- quirements significantly increase the funding costs for unlisted German banks? We choose to cover Germany because the financial sector belongs to the largest in Europe in regard to the relation of assets to GDP and the number of banks (ECB, 2015). On this basis, the focus is on unlisted banks because they represent the majority in Germany. We expand the existing litera- ture surrounding Admati et al. (2013) and Miles et al. (2012) on the impact of higher capital requirements, for its applicability on unlisted German banks. The focus is solely on the cost of capital. Social costs and long-term benefits are not considered. The methodical approach is based on Miles et al. (2012). Since the focus is on unlisted banks, a proxy-model based on Grossmann and Scholz (2017) is used for the return on equity. Contrary to Grossmann and Scholz (2017) and to gain new insights on banks, a short-term investment period is assumed and 13 percent of the returns are substituted with the average return of the time series to con- sider the expectations of investors for a minimum return. The proxy-model regresses bank’s leverage on the realized return on equity and finds a positive relationship. The regression out- come can mirror the risk preferences of equity investors. Pooled ordinary least squares, fixed effects, and random effects regression models are estimated. The coefficients are applied to compute the return on equity for the WACC. We find that capital structure is partly irrelevant for German banks and that a potential doubling of equity would only slightly increase bank’s funding costs.
Do the Modigliani and Miller propositions apply to banks?
In short, the M/M propositions assume that the cost of capital are independent of a company’s capital structure.2 On this basis, Admati et al. (2015) split the M/M propositions into two cat- egories. One, the “irrelevance result” that the costs of capital are irrelevant. Two, the “analyti- cal effect” of the M/M propositions that higher ratios of leverage will increase the risk premi- um on equity due to a higher risk of insolvency. If leverage decreases, the risk premium on equity is reduced. The difference between the two categories can be seen through diverse funding strategies of banks. The “irrelevance result” might not work entirely for banks with high shares of deposit funding because liquidity benefits can offset the M/M propositions.
However, the “analytical effect” is not affected because the liquidity of deposits depends on bank’s solvency, not on going bankrupt. Both categories apply even more for banks with higher shares of wholesale funding (cf. Admati et al., 2015). For more reason why the M/M propositions apply to banks see Miller (1995), Admati et al. (2013), and Pfleiderer (2015).
Based on Admati et al. (2013), an empirical test to examine the impacts of higher capi- tal requirements on bank’s overall cost of capital is provided by Miles et al. (2012). Miles et al. (2012) find that the cost of capital increases up to 18 basis points for the six largest banks in the UK. They present a relative portion, the so-called M/M offset, which describes to what extent the WACC is independent if the funding structure changes. With an M/M offset of 100%, the WACC would not rise and the irrelevance of capital structure as defined by M/M would fully apply (Miles et al., 2012). Further studies by the European Central Bank (ECB, 2011), Junge and Kugler (2012), Toader (2015), Clark et al. (2015), Cline (2015), and Gross- mann and Scholz (2017) refer to the framework of Miles et al. (2012). The M/M offsets are presented in Table 1.
2 For more information about the M/M propositions see “Methodology and Proxy-Model” below.
Table 1: Comparative Studies
Study Region Period No. Banks M/M Offset
Miles et al. UK 1997–2010 6 45-90%
ECB G-SIB 1995–2011 54 41-73%
Junge and Kugler CH 1999–2010 5 36-55%
Toader Europe 1997–2012 85 42%
Clark et al. USA 1996–2012 200 41-100%
Cline USA 2001–2013 51 60%
Grossmann and Scholz Europe 2000–2013 115 49-61%
Notes: Studies that refer to the empirical method of Miles et al. (2012). The M/M offset describes to what proportion the WACC is independent of the capital structure.
Source: Own work.
The general approach of this paper is based on Grossmann and Scholz (2017). In contrast to the comparative studies and, particularly, Grossmann and Scholz (2017), the focus is on a sample of 78 unlisted German banks from 2004–2013 and a short-term investment horizon with an alternative handling of realized negative returns as suggested by Cline (2015).
Data
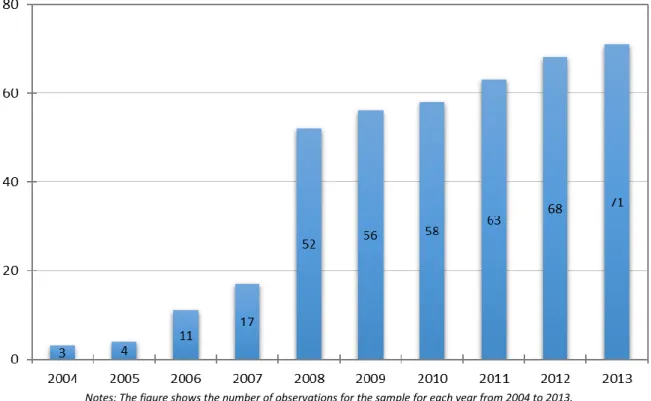
The Bankscope data for a sample of German banks is supplemented with data from published regulatory disclosure reports. The initial selection for the top 100 banks in Germany is based on the total assets size at the end of 2013. The unbalanced dataset includes yearly observa- tions from 2004–2013, but does not include bank observations for every year as displayed in Figure 1.
Notes: The figure shows the number of observations for the sample for each year from 2004 to 2013.
Figure 1: Yearly Observations
Source: Own calculations based on data of the Bankscope-database.
69
For the purpose of this study, 15 listed banks are dropped from the sample. Bank/year observations with missing data for the utilized variables are not considered. If 50% of the shares of a bank are overtaken by another German competitor, the data point is not considered in order to avoid duplications. The sample includes the German Savings Bank and Giro Asso- ciation and the Cooperative Financial Network as additional bank-proxies with a total of 11 observations. The data of the sample is not trimmed or winsorized to consider possible outli- ers. However, one data point is dropped from the final dataset because it does not show a sys- tematic effect due to a massive withdrawal of the fund for general banking risks following
§340g German Commercial Law.
The final sample includes 78 unlisted German banks with 403 observations for both the dependent and the independent variables.
Methodology and Proxy-Model
The cornerstone of the model is the capital structure theory of Franco Modigliani and Merton H. Miller. M/M predict that the capital structure is irrelevant for the cost of capital. If leverage decreases, the required return on equity will drop because less leverage makes the bank less risky. The costs for an increased amount of equity and a reduced amount of debt, taxes ne- glected, will be offset due to the reduced risk premium. The cost of capital will stay un- changed (Modigliani and Miller, 1958). The practical use of the M/M methodology on banks is based on Miles et al. (2012) and the comparative studies. The WACC can be calculated as follows:
(1)
where is the amount of Tier 1 capital, is the total assets, is the amount of debt, is the equity ratio, and is the debt ratio. The return on equity is and the interest rate on debt is .3
The comparative studies focus on listed banks and use the Capital Asset Pricing Model (CAPM) with market betas to calculate the expected return on equity. The bank sample is dom- inated by unlisted banks as they represent the financial sector in Germany. Only one percent of all German banks that reported to the Deutsche Bundesbank (2015b) are listed at the end of 2013. To calculate the return on equity for unlisted banks, peer group betas could be used.
However, peer group betas would only be based on a few listed German banks with a much higher market capitalization. The comparability would be biased. Against this background, a proxy-model based on Grossmann and Scholz (2017) is used to calculate the return on equity.
The proxy-model is based on historical data and does not calculate the expected future return.
Nonetheless, the coefficients of the model are seen as an equity investor’s risk preferences. The proxy-model uses log regressions for the variables and is regressed as follows:
(2) where = 1 to N is the bank and = 1 to T considers the year. With as the constant, as the leverage coefficient, for time effects, and as the error term.
The independent variable is leverage, which is calculated as total on-balance sheet as- sets divided by Tier 1 capital. The dependent variable is the net return on Tier 1 capital. Due to changes in the definition of regulatory bank equity, the comparability during the timeframe might be biased. The observed timeframe for the dataset also consists of negative returns that
3 For more information about the methodology see also Grossmann and Scholz (2017).
occur in about 12.9 percent of the observations. The losses appear with a high share of ap- proximately 75 percent during the financial crisis between the years 2007 and 2011. The in- terpretation of negative returns as a proxy for the expected return is challenging because the logarithm of negative numbers is not quantifiable. In contrast to Grossmann and Scholz (2017), we follow the suggestion provided by Cline (2015) to substitute negative returns for a minimum expected return. The substitution of negative returns does not reflect the actual risk- iness of equity with positive and negative returns. However, investors would not invest if the bank is expected to generate negative returns. This assumption seems to hold at least for a short-term investment horizon. Two options are used to handle negative returns. One, the av- erage return for the time series of the net return on Tier 1 capital is used for years with losses.
This option will be used for the calculations presented in table 3. Two, the negative returns are substituted with a five-year Treasury bond plus a risk spread of 100 basis points as sug- gested by Cline (2015). In our case, a German treasury bond is chosen. A five year period is taken into account because it can be seen as the minimum maturity for capital to be accepted as equity.4 The return of a German treasury bond is measured from annual yields at the end of December. The data is collected from the Deutsche Bundesbank (2015) and the yields are de- rived from the term structure of interest rates on listed federal securities with annual coupon payments. The risk spread used by Cline (2015) is based on the credit default swap spread for G-SIB in the fourth quarter of 2012.
Overall, the substitution of negative observations provides a minimum expected return for investors with a short-term investment horizon. This temporary assumption holds if a longer-term investment period is not pursued. However, it should be considered that the un- derlying assumptions also reflect the limitations of the findings and that a nonexistent stock exchange listing may create difficulties for short-term investments.
Findings
The descriptive statistics for the variables of the sample are presented in Table 2. It can be seen that the average leverage of the sample is 23.75 with an average net return of 2.57%.
Outliers are included. If the most negative outlier, one bank with a loss that exceeds Tier 1 capital, is not considered, the average return of the sample would rise to 2.95%. If all banks with a leverage above 33.33 (i.e. an equity ratio below 3%) are not considered, the average leverage would drop to 22.14. Both variables are non-normal distributed as Jarque-Bera tests can be rejected.
Table 2: Descriptive Statistics
Variable Mean Median St. Dev. Min. Max. 1st Quant. 3rd Quant.
Net Return 0.026 0.028 0.125 -1.507 0.346 0.013 0.057
Leverage 23.75 19.47 12.46 7.49 78.54 14.39 29.68
Notes: The net return is calculated as net return divided by Tier 1 capital. Leverage is calculated as total assets divided by Tier 1 capital. All variables display 403 observations.
Source: Own calculations based on data of the Bankscope-database.
Based on the procedure of the comparative studies, ordinary least squares (OLS), fixed effects (FE), and random effects (RE) regression models are estimated to calculate the rela- tionship between the return on bank’s equity and leverage. The OLS minimizes the sum of squared residuals, but does not account for unobserved effects. The FE and RE models con- sider unobserved effects. The bank-specific unobserved effects in the FE model can be corre- lated with the independent variables. For the RE model, it is assumed that the unobserved ef-
4 See for example the criteria for inclusion in Additional Tier 1 capital (BCBS, 2011).
71
fects are not correlated with the independent variables. The coefficients will be used to calcu- late the WACC. Table 3 reports the regression models with and without time effects.
Table 3: Regression Models
OLS FE RE
Time Effects No Yes No Yes No Yes
Coefficient 0.320*** 0.227* 0.459*** 0.946*** 0.393*** 0.481**
Std. Error 0.110 0.119 0.443 0.557 0.257 0.291
Constant -4.441*** -3.796*** -4.954 -7.051 -4.729*** -5.348***
F-Test 0.000 0.000 0.000 0.000 0.000 0.000
Observations 403 403 403 403 403 403
Notes: The dependent variable is the net return on bank’s equity. The coefficient for the independent variable is leverage. All variables are logarithmized. Time effects are not shown. The FE model does not report a constant. Therefore, the average of the fixed effects is displayed as the constant. A Breusch-Pagan test indicates heteroscedasticity. FE and RE models cannot re- ject the null for a Breusch-Godfrey/Wooldridge test for serial correlation. Robust standard errors are shown for the FE and RE models.
* p<0.01, ** p<0.05, *** p<0.001.
Source: Own calculations based on data of the Bankscope-database.
Statistically, significant links between the net return on bank’s equity and leverage, with or without annual time dummies, can be found for all models. All models reject the null hy- potheses of the Breusch-Pagan test, which indicates heteroscedasticity. Serial correlation is found for the OLS model. The FE and RE models reject the null hypotheses of a Breusch- Godfrey/Wooldridge test for serial correlation. The FE models do not report a constant.
Therefore, the average of the fixed effects of the banks is used. To allow for heteroscedastici- ty and serial correlation, robust covariance matrix estimators are chosen for the FE and RE regression models (cf. Croissant and Millo, 2008).5
Statistical tests are used for the regression models to select an appropriate model for the WACC calculation. Firstly, the FE models are chosen over the OLS models because the null hypotheses for the F-test are rejected. Secondly, the RE models are chosen over the OLS models because the null hypotheses of a Lagrange Multiplier Test are rejected. Thirdly, both FE models are chosen over the RE models because the null hypotheses of a Hausman test are rejected. Given the described assumptions, the results are comparable to the comparative stud- ies. The estimations of the coefficients for leverage for FE log-models are 0.692 (Miles et al., 2012), 0.554 (Junge and Kugler, 2012), and 0.902 (Clark et al., 2015).
Testing the Impact of Higher Capital Requirements
To answer the question if higher capital requirements significantly increase the funding costs for unlisted German banks, a simple approach is used. Two exemplary ratios of leverage are used to calculate the WACC of formula (1). The results are compared to identify the impact of higher equity ratios. At first, a leverage of 30 is calculated (cf. Miles et al., 2012). In a sec- ond step, a potential doubling of equity is assumed. The leverage of 30 is cut in half. Two models, with and without year effects, as presented in Table 4, are calculated. For the equity part of the WACC, the estimated constant and leverage coefficients of the proxy-model are inserted in the following formula (cf. Grossmann–Scholz, 2017).
(3)
5 If negative returns of the time series are substituted for a German treasury bond plus a risk spread (cf. Cline, 2015), the coefficients of leverage would account for the OLS 0.330*** (0.205* with time effects), FE 0.572** (0.921***), and for the RE 0.438*** (0.444***).
We assume that the outcome reflects the risk preferences of investors. Exemplary, this can be seen for model 1 as the return on equity of 3.36% with a leverage of 30 decreases to 2.45% once equity is doubled. Model 2 displays a lower return on equity of 2.16%, which will drop to 1.12% with a leverage of 15. The results are based on actual realized returns during and after the financial crisis and are comparable to the descriptive statistic for the sample.
Furthermore, the exemplary results seem to be in line with the German banking market as a whole as a study by Bain & Company shows. The analysis of 2,000 banks estimates that the return on Tier 1 capital after taxes has averaged 1.6% per year during the years 2011 and 2013 (Sinn and Schmundt, 2014). Hence, the proxy-model with the underlying assumptions seems to produce realistic and market-compliant results.
For the debt part of the WACC, we follow Junge and Kugler (2012) who use a constant rate of debt of 1%. A constant debt rate is chosen because debt can be seen as risk-free regard- ing deposit insurances, liability systems, and implicit state guarantees. Compared to overall market conditions, the debt rate seems to be realistic. At the end of 2011, the yield on a five- year German treasury bond was less than 100 basis points (Deutsche Bundesbank, 2015). The assumption of a constant risk-free debt rate is critical because it does not reflect reality. How- ever, to compare the results to the comparative studies, the assumption is used as well. Future research could concentrate on the relation between debt rates and leverage.
Table 4: Cost of Capital and M/M Offset
Fixed Effects Models WACC (30) WACC (15) M/M Offset
Model 1 - Time Effects 1.079% 1.096% 77%
Model 2 - No Time Effects 1.039% 1.008% ≥ 100%
Notes: The calculations of the WACC are based on formula (1) for a leverage of 30 and 15. The estimates of the return on equi- ty are based on formula (2) and (3). The constants and coefficients are withdrawn from table 3 for the fixed effects regression models. The models differ in the use of year effects. The interest rate for debt is based on Junge and Kugler (2012). The M/M offset describes to what extent the WACC is independent once the funding structure changes.
Source: Own calculations based on data of the Bankscope-database.
The WACC for model 1, based on a leverage of 30 and a debt rate of 1%, accounts for 1.079% (i.e. 1/30 ∙ 3.36 + 29/30 ∙ 1). If leverage is cut in half, the WACC rises by 2 basis points to 1.096% (i.e. 1/15 ∙ 2.45 + 14/15 ∙ 1). Under the assumption that the M/M effect does not exist, the return on equity would not decrease even if leverage is lowered to 15. In that case, the WACC would account for 1.157%, an increase of 8 basis points (i.e. 1/15 ∙ 3.36 + 1/14 ∙ 1). If the M/M effect does not exist, the WACC would rise by 23% (2 bps./8 bps.). The reciprocal value describes the M/M offset which is 77%.6 Surprisingly, the WACC is lower in model 2. The result is not as expected. In theory, the WACC will stay unchanged because the cost for a higher amount of equity is offset due to a reduced return on equity. Consequently, an M/M offset greater than 100% should be capped because lower WACC’s would violate the M/M propositions. The reasons for the results could be the assumption about the debt rate or the chosen timeframe. The regression coefficients for leverage increase after time dummies are added to account for trends or changes over time. The majority of observations of the sample includes the timeframe after the start of the financial crisis. Future research could con- centrate on the time before the financial crisis if sufficient data on Tier 1 capital for unlisted German banks are available.
6 If 13 percent of the returns are substituted with a German treasury bond plus a risk spread (cf. Cline, 2015), the M/M offset would account for 91% to ≥ 100%.
73
Conclusion
Do higher capital ratios increase the cost of capital for unlisted German banks? Yes, but the effect is rather small. Based on the FE regressions, the M/M offsets are estimated to be be- tween 77% and 100% for a sample of unlisted German banks. The “analytical effect” of the M/M proposition (cf. Admati et al., 2013) seems to hold. The results support the comparative studies that higher capital requirements do not significantly increase the cost of capital. In comparison to Grossmann and Scholz (2017), who pursue a longer-term investment period, the M/M offsets for unlisted banks are higher. This is certainly due to the underlying assump- tions to handle negative returns as suggested by Cline (2015) and the selection of the sample.
However, longer-term effects, such as the variation of the funding structure in time or the ad- justment of business activities, might also have an additional impact on the longer-term cost of capital. Short-term investors strive for a high return on capital, which depends on the as- sumed risk. Overall, for a short-term investment period, the cost of capital seems to be partly irrelevant.
The practical application of the findings is that economic and prudential goals can be achieved simultaneously. Higher equity ratios do not increase the funding costs a lot, but can reduce the riskiness of banks. If the cost of capital can nearly stay the same, banks will have no need to take on higher risks or to increase lending rates.
References
Admati, A. – DeMarzo, P. – Hellwig, M. – Pfleiderer, P. (2013): Fallacies, Irrelevant Facts, and Myths in the Discussion of Capital Regulation: Why Bank Equity is Not Socially Expensive. Rock Center for Corporate Governance, Working Paper Series, No. 161.
DOI: http://dx.doi.org/10.2139/ssrn.2349739
Admati, A. – Hellwig, M. (2015): The Parade of the Bankers’ New Clothes Continues: 31. Flawed Claims Debunked. Stanford Graduate School of Business, Working Paper, No. 3032 DOI: http://dx.doi.org/10.2139/ssrn.2292229.
Bankscope-Database, Bureau van Dijk Electronic Publishing (2015): Hanauer Landstraße. 60314 Frankfurt am Main, Germany, pp. 175–179.
Basel Committee on Banking Supervision (2011): Basel III: A global regulatory framework for more resilient banks and banking systems, December 2010 (rev June 2011). Zurich: Bank for In- ternational Settlements.
Clark, B. – Jones, J. – Malmquist, D. (2015): Leverage and the Weighted-Average Cost of Capital for U.S. Banks. Working Paper, [online] Available at:
http://papers.ssrn.com/sol3/papers.cfm?abstract_id=2491278 (Accessed 18.10.2015) DOI: http://dx.doi.org/10.2139/ssrn.2491278
Cline, W. (2015): Testing the Modigliani-Miller Theorem of Capital Structure Irrelevance for Banks.
Peterson Institute for International Economics Working Paper Series, No. 8.
DOI: http://dx.doi.org/10.2139/ssrn.2594025
Cosimano, T. – Hakura, D. (2011): Bank Behaviour in Response to Basel III: A Cross-Country Analy- sis. IMF Working Paper, No. 119. DOI: http://dx.doi.org/10.5089/9781455262427.001 Croissant, Y. – Millo, G. (2008): Panel Data Econometrics in R: The plm Package. Journal of Statisti-
cal Software, Vol. 27(2).
Deutsche Bundesbank (2015): Time Series BBK01.WT3404 for a five year German Treasury bond.
Deutsche Bundesbank, [online] Available at:
http://www.bundesbank.de/Navigation/DE/Statistiken/Zeitreihen_Datenbanken/
Makrooekonomische_Zeitreihen/its_details_value_node.html?tsId=BBK01.WT 3404&dateSelect=2013 (Accessed 04.05.2015)
Deutsche Bundesbank, 2015b. Banking statistics June 2015, Statistical Supplements to the Monthly Report. Frankfurt am Main: Deutsche Bundesbank.
Elliot, D. – Salloy, S. – Oliveira Santos, A. (2012): Assessing the Cost of Financial Regulation. IMF Working Paper, No. 223. DOI: http://dx.doi.org/10.5089/9781475510836.001
Elliot, D. (2013): Higher Bank Capital Requirements Would Come at a Price. Working Paper, [online]
Available at:
https://www.brookings.edu/research/ higher- bank-capital-requirements-would-come-at-a- price/ (Accessed 16.09.2016)
European Central Bank (2011): Common Equity Capital, Banks‘ Riskiness and Required Return on Equity. Financial Stability Report, December, pp. 125–131.
European Central Bank, 2015. Report on financial structures, October 2015. Frankfurt am Main:
ECB.
Grossmann, D. – Scholz, P. (2017): Bank Regulation − One Size Does Not Fit All, Journal of Applied Finance and Banking, Vol. 7(5), pp. 1–27.
Junge, G., Kugler, P., 2012. Quantifying the impact of higher capital requirements on the Swiss econ- omy. Swiss Journal of Economics and Statistics, Vol. 149 (3), pp. 313–356.
DOI: http://dx.doi.org/10.1007/BF03399394
Miles, D. – Yang, J. – Marcheggiano, G. (2012): Optimal Bank Capital. The Economic Journal, Vol.
123, pp. 1–37. DOI: http://dx.doi.org/10.1111/j.1468-0297.2012.02521.x
Miller, M., (1995): Do the M & M propositions apply to banks?. Journal of Banking and Finance, Vol. 19, pp. 483-489. DOI: http://dx.doi.org/10.1016/0378-4266(94)00134-o
Modigliani, F. – Miller, M. (1958): The Cost of Capital, Corporation Finance and the Theory of In- vestment. The American Economic Review, Vol. 48(3), pp. 261–297.
Pfleiderer, P. (2015): On the Relevancy of Modigliani and Miller to Banking: A Parable and Some Observations (Revised). Working Paper, [online] Available at:
http://citeseerx.ist.psu.edu/viewdoc/download?doi=10.1.1.366.2601&rep=rep1&type=pdf (Accessed 16.09.2016)
Sinn, W. – Schmundt, W. (2014): Deutschlands Banken 2014: Jäger des verlorenen Schatzes. Bain &
Company.
Toader, O. (2015): Estimating the Impact of Higher Capital Requirements on the Cost of Eq- uity: An Empirical Study of European Banks. International Economics and Eco- nomic Policy, Vol. 12(3), pp. 411–436.
DOI: http://dx.doi.org/10.1007/s10368-014-0303-x