PAPER • OPEN ACCESS
Two- and three-pion Lévy femtoscopy with PHENIX
To cite this article: Máté Csanád and PHENIX Collaboration 2018 J. Phys.: Conf. Ser. 1070 012026
View the article online for updates and enhancements.
This content was downloaded from IP address 157.181.178.79 on 18/09/2019 at 15:01
1234567890 ‘’“”
34th Winter Workshop on Nuclear Dynamics IOP Publishing
IOP Conf. Series: Journal of Physics: Conf. Series 1070 (2018) 012026 doi :10.1088/1742-6596/1070/1/012026
Two- and three-pion L´ evy femtoscopy with PHENIX
M´at´e Csan´ad (for the PHENIX Collaboration)
E¨otv¨os Lor´and University, P´azm´any P. s. 1/a, H-1117 Budapest, Hungary E-mail: csanad@elte.hu
Abstract. The last decades of high energy physics revealed, that in ultra-relativistic ion-ion collisions, a strongly interacting quark gluon plasma (sQGP) is created. Varying the collision energy allows for the investigation of the phase diagram of QCD matter. The nature of the quark-hadron transition can be studied via femtoscopy, as the investigation of momentum correlations in heavy ion reactions reveals the space-time structure of the hadron production of the sQGP. Going beyond the Gaussian assumption the shape of this source may be described by L´evy distributions. In this paper we report on recent femtoscopic measurements of PHENIX, utilizing L´evy sources.
1. Introduction
Pioneering interferometry discoveries were made by R. Hanbury Brown as he investigated correlations of intensity fluctuations with radio telescopes [1] at the Jordell Bank Observatory, where he was able to measure the angular diameter of two strong radiofrequency sources.
Constructing two tabletop experiments [2, 3], Hanbury Brown and R. Q. Twiss prove that these correlations are also observable in the optical spectrum. Subsequently, the angular diameter of Sirius was measured [4], utilizing this technique. These results can be regarded [5] as the extension of the work by A. A. Michelson and F. G. Pease [6], originally suggested by H. L.
Fizeau and Michelson [5]. Brown and collaborators, building an optical interferometer [7] at the Narrabi Observatory, were able to measure the angular diameter of multiple stars [8, 9].
Nowadays, this technique can be applied to study the two dimensional structure of distant astrophysical objects [10].
These phenomena were interpreted in the language of quantum optics by R. J. Glauber [11–
13], and observed in high energy physics independently by G. Goldhaber and collaborators in proton-antiproton collisions [14, 15]. These Hanbury Brown and Twiss (HBT) correlations have an important role in high energy physics, as they can be utilized to understand the femtometer scale space-time structure of the particle emitting source. Hence this field is often called femtoscopy [16]. The basic working principle of femtoscopy is, that if we define the probability density of particle creation at space-time pointxand momentumpasS(r, p) (a.k.a. the source), then the momentum correlation function,C(q, K) (whereqis the pair momentum difference and K is the average momentum of the pair) can be measured and (assuming thermal emission, lack of final state interactions, etc., see e.g. Ref. [17] for details) is related to the source as
C2(q, K) = 1 +
S(q, K)e S(0, K)e
2
, (1)
2
where S(q, Ke ) =R
S(x, K)eiqxd4x is the Fourier transformed of the source. It is worth noting that if we introduce the spatial correlation function as
D(x, K) = Z
S(r+x/2, K)S(r−x/2, K)d4r. (2) then the correlation function can be expressed as
C2(q, K) = 1 + D(q, K)e
D(0, K)e , (3)
where again D(q, K) =e R
D(x, K)eiqxd4x is the Fourier transformed of the spatial correlation function. Note that in this case, no absolute value is taken, hence no sign or phase information is lost. Hence, momentum correlations measure the source, or more directly, the spatial correlation function.
The geometry of the source was often assumed to be Gaussian. However, the expansion of the medium and the corresponding increase of the mean free path suggests the onset of anomalous diffusion [18, 19]. This leads to L´evy distributions, which in turn result in stretched exponential type of momentum correlation functions:
C2(q, K) = 1 + exp
−|qR(K)|α(K)
, (4)
where q is the momentum difference, R is the K dependent source size (or its length of homogeneity), andαis the L´evy-stability exponent, resulting from the anomalous diffusion, and probably also depending onK. Theαparameter is interesting also because it may be connected to the critical exponentη, appearing in the power-law exponent of the spatial correlation function at the critical point [20]. Recently, L´evy sources have been utilized [17, 21–24] to describe the particle emitting source. In present paper we report on the recent L´evy femtoscopy results of the PHENIX experiment.
Before we move on to the data analysis and the results, let us mention one important point.
The above equations imply, that at zero relative momentum, the correlation function reaches a value of 2, i.e. C2(0, K) = 2. Experimentally, the low-q region is usually inaccessible due to two-track resolution limitations. Hence one can only extrapolate to measureC2(0, K), the zero momentum intercept of the two-particle correlation function. It turns out, that this value is not 2, but has to be described by
q→0limC2(q, K) = 1 +λ(K), (5)
where λ is the (K dependent) intercept parameter or correlation function strength. This observation can be easily understood in terms of the core-halo picture [25, 26], where the source has two components: a hydrodynamically behaving fireball-type core, surrounded by a halo of the decay products of long lived resonances. In the core-halo picture, it turns out (as detailed e.g. in Ref. [17]) that
λ=fc2, fc= Ncore
Ncore+Nhalo, (6)
where N... denotes the number of pions produced in a given component of the source. Henceλ carries indirect information on the number of long-lived resonances decaying to pions, with an important example being the η0 meson, as discussed in detail in Refs. [17, 27–29].
1234567890 ‘’“”
34th Winter Workshop on Nuclear Dynamics IOP Publishing
IOP Conf. Series: Journal of Physics: Conf. Series 1070 (2018) 012026 doi :10.1088/1742-6596/1070/1/012026
West
South Side View
Beam View PHENIX Detector 2010
North East
MuTr
MuID RxNP MuID
HBD HBD
PbSc PbSc
PbSc PbSc
PbSc PbGl
PbSc PbGl
TOF-E
PC1 PC1
PC3 PC2
Central Magnet Central Magnet
North Muon Magnet South Muon Magnet
TECPC3
BBC MPC BB
RICH RICH
DC DC
ZDC North ZDC South
Aerogel
TOF-W 7.9 m = 26 ft
10.9 m = 36 ft
18.5 m = 60 ft
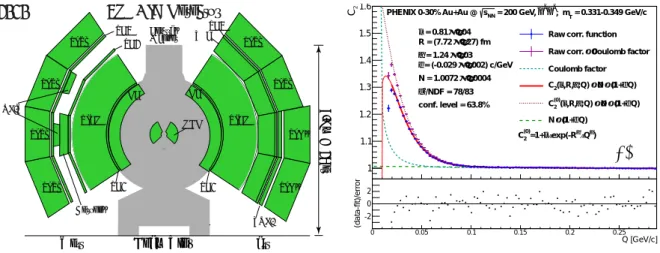
Figure 1. The 2010 PHENIX detector setup.
k [GeV/c]
0 0.05 0.1 0.15 0.2 0.25
2C
1 1.1 1.2 1.3 1.4 1.5 1.6
Raw corr. function Coulomb factor
× Raw corr.
Coulomb factor ε Q)
× (1+
× N α;Q) λ,R, 2( C
ε Q)
× (1+
× N α;Q) λ,R, 2( C(0)
ε Q)
× (1+
N
= 0.331-0.349 GeV/c , mT
π−
π− = 200 GeV, sNN PHENIX 0-30% Au+Au @
0.04
± = 0.81 λ
0.27) fm
± R = (7.72
0.03
± = 1.24 α
0.002) c/GeV
± = (-0.029 ε
0.0004
± N = 1.0072
/NDF = 78/83 χ2
conf. level = 63.8%
α)
⋅ Q exp(-Rα
⋅ λ
2=1+
C(0)
Q [GeV/c]
0 0.05 0.1 0.15 0.2 0.25
(data-fit)/error
0 -2 2
(a)
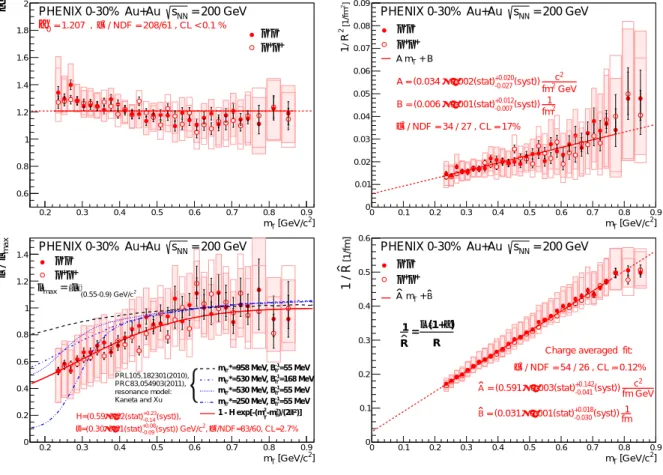
Figure 2. Example correlation function.
2. Two-pion femtoscopy in 200 GeV Au+Au collisions
The PHENIX experiment [30] recorded collisions of various nuclei, ranging from protons and deuterons to gold and uranium, at center of mass per nucleon energies (√
sN N) ranging from 7.7 to 200 GeV. This allows to study the QCD phase diagram. In this paper, we discuss the analysis of 0–30% √
sN N = 200 GeV Au+Au collisions recorded in the 2010 data taking period. The setup of the experiment during this period is shown in Fig. 1. In our correlation measurements we applied particle identification via time of flight data from the PbSc and TOF detectors. In addition to track matching cuts, we applied pair cuts to reduce the effect of track merging and splitting, as detailed in Refs. [17, 21–24].
We measured pair momentum difference distributions in the longitudinally comoving system (LCMS) of each pair, for particles belonging to the same event, as a function ofQ, the magnitude of the LCMS momentum difference three-vector. These distributions are usually called actual pair distributions, and are denoted by A2(Q, K). To investigate only effects which arise from the pair coming from the same event, we created the same number of mixed events (with the same multiplicity distribution). Taking a given actual event, we constructed a similar mixed events by selecting the same number of particles from a large pool of similar background events, making sure all particles are from different events. This resulted in the so-called background pair distribution, B2(Q, K). The correlation function was then calculated as
C2(Q, K) = A2(Q, K)
B2(Q, K), (7)
separately for positive and negative charges. The q-dependence was investigated in 31 bins of pair transverse mass, related to average pair momentum K as
mT = q
m2+KT2, (8)
whereKT is the pair average transverse momentum. The resulting 62 correlation functions were fitted assuming L´evy sources, as well as taking into account the Coulomb interaction, as detailed in Ref. [17]. An example fit is shown in Fig. 2. We then investigated the main fit parameters.
The fit parametersλ,Randαare shown in Fig. 3, as a function of pairmT. We may observe that α is approximately constant (within systematic uncertainties), and takes an average value of 1.2, being far from the Gaussian assumption ofα = 2. We also observe, that despite being far
4
1234567890 ‘’“”
34th Winter Workshop on Nuclear Dynamics IOP Publishing
IOP Conf. Series: Journal of Physics: Conf. Series 1070 (2018) 012026 doi :10.1088/1742-6596/1070/1/012026
2] [GeV/c mT
0.2 0.3 0.4 0.5 0.6 0.7 0.8 0.9
α
0.6 0.8 1 1.2 1.4 1.6 1.8
2 PHENIX 0-30% Au+Au sNN = 200 GeV / NDF = 208/61 , CL < 0.1 % χ2
= 1.207 ,
α0 -
π π-
π+
π+
2] [GeV/c mT
0 0.1 0.2 0.3 0.4 0.5 0.6 0.7 0.8 0.9
]2 [1/fm2R / 1
0 0.01 0.02 0.03 0.04 0.05 0.06 0.07 0.08
0.09 PHENIX 0-30% Au+Au sNN = 200 GeV
2 GeV fm
c2
(syst))
-0.027 +0.020
0.002(stat)
± A = (0.034
fm2
(syst)) 1
-0.007 +0.012
0.001(stat)
± B = (0.006
/ NDF = 34 / 27 , CL = 17%
χ2 T + B A m
π-
π-
π+
π+
2] [GeV/c mT
0.2 0.3 0.4 0.5 0.6 0.7 0.8 0.9
maxλ / λ
0 0.2 0.4 0.6 0.8 1 1.2
1.4 PHENIX 0-30% Au+Au sNN = 200 GeV
(syst)),
-0.14 +0.23
0.02(stat)
± H=(0.59
/NDF=83/60, CL=2.7%
χ2 2, (syst)) GeV/c
-0.09 +0.08
0.01(stat)
±
=(0.30 σ
=55 MeV
-1 η'
*=958 MeV, B
η'
m
=168 MeV
-1 η'
*=530 MeV, B
η'
m
=55 MeV
-1 η'
*=530 MeV, B
η'
m
=55 MeV
-1 η'
*=250 MeV, B
η'
m
)]
σ2 2)/(2 -mπ 2
1 - H exp[-(mT
PRL105,182301(2010), PRC83,054903(2011), resonance model:
Kaneta and Xu (0.55-0.9) GeV/c2
〉 λ
〈
max = λ
π-
π-
π+
π+
2] [GeV/c mT
0 0.1 0.2 0.3 0.4 0.5 0.6 0.7 0.8 0.9
[1/fm]R1 /
0 0.1 0.2 0.3 0.4 0.5
0.6 PHENIX 0-30% Au+Au sNN = 200 GeV
fm GeV c2
(syst))
-0.041 +0.142
0.003(stat)
± = (0.591 A
fm (syst)) 1
-0.030 +0.018
0.001(stat)
± = (0.031 B
/ NDF = 54 / 26 , CL = 0.12%
χ2
+ B mT
A
Charge averaged fit:
R α)
⋅(1+
= λ R
1 π-
π-
π+
π+
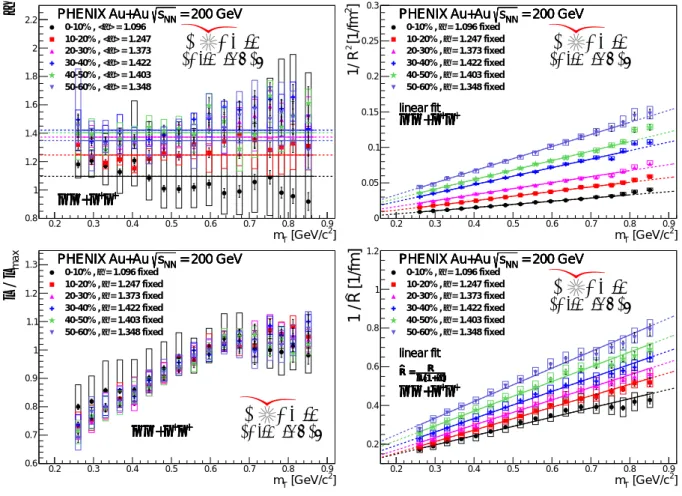
Figure 3. L´evy parametersα,R(shown as 1/R2) andλ(shown normalized asλ/λmax), as well as the new scaling parameter Rb versus pairmT show in the top left, top right, bottom left and bottom right panels, respectively. Statistical uncertainties are shown as bars, systematic ones with boxes.
from the hydrodynamic limit of Gaussian distributions, the hydro prediction of 1/R2 'AmT+B still holds.
The measured correlation function strengthλis shown after a normalization by λmax=hλim
T = 0.55−0.9 GeV/c2. (9)
This clearly indicates a decrease at small mT, which may be explained by the larger fraction of low momentum pions coming from resonance decays. Our measurement is in particular not incompatible with predictions [29] based on a reducedη0 mass, see details in Ref. [17].
We also show, that a new, empirically found scaling parameter Rb= R
λ(1 +α) (10)
may be defined. This exhibits a clear linear scaling with mT, and it also has much decreased statistical uncertainties.
While for the other parameters, approximate scalings may be observed (α is constant inmT, 1/R2 is linear in mT, λ/λmax follows a unity minus a Gaussian type of mT dependence), the scaling of 1/Rb is strikingly better than the others.
1234567890 ‘’“”
34th Winter Workshop on Nuclear Dynamics IOP Publishing
IOP Conf. Series: Journal of Physics: Conf. Series 1070 (2018) 012026 doi :10.1088/1742-6596/1070/1/012026
2] [GeV/c mT
0.2 0.3 0.4 0.5 0.6 0.7 0.8 0.9
α
0.8 1 1.2 1.4 1.6 1.8 2
2.2 PHENIX Au+Au sNN = 200 GeV
π+
π+ -+ π π-
= 200 GeV sNN
PHENIX Au+Au
π+
π+ -+ π π-
= 200 GeV sNN
PHENIX Au+Au
π+
π+ -+ π π-
= 200 GeV sNN
PHENIX Au+Au
π+
π+ -+ π π-
= 200 GeV sNN
PHENIX Au+Au
π+
π+ -+ π π-
> = 1.096 α 0-10% , <
> = 1.247 α 10-20% , <
> = 1.373 α 20-30% , <
> = 1.422 α 30-40% , <
> = 1.403 α 40-50% , <
> = 1.348 α 50-60% , <
PH ENIX
preliminary
2] [GeV/c mT
0.2 0.3 0.4 0.5 0.6 0.7 0.8 0.9
]2 [1/fm2 / R1
0 0.05 0.1 0.15 0.2 0.25
0.3 PHENIX Au+Au sNN = 200 GeV
π+
π+ -+ π π- linear fit
= 200 GeV sNN
PHENIX Au+Au
π+
π+ -+ π π- linear fit
= 200 GeV sNN
PHENIX Au+Au
π+
π+ -+ π π- linear fit
= 200 GeV sNN
PHENIX Au+Au
π+
π+ -+ π π- linear fit
= 200 GeV sNN
PHENIX Au+Au
π+
π+ -+ π π- linear fit
= 1.096 fixed α
0-10% ,
= 1.247 fixed α
10-20% ,
= 1.373 fixed α
20-30% ,
= 1.422 fixed α
30-40% ,
= 1.403 fixed α
40-50% ,
= 1.348 fixed α
50-60% ,
PH ENIX
preliminary
2] [GeV/c mT
0.2 0.3 0.4 0.5 0.6 0.7 0.8 0.9
maxλ / λ
0.6 0.7 0.8 0.9 1 1.1 1.2
1.3 PHENIX Au+Au sNN = 200 GeV
π+
π+ -+ π π-
= 200 GeV sNN
PHENIX Au+Au
π+
π+ -+ π π-
= 200 GeV sNN
PHENIX Au+Au
π+
π+ -+ π π-
= 200 GeV sNN
PHENIX Au+Au
π+
π+ -+ π π-
= 200 GeV sNN
PHENIX Au+Au
π+
π+ -+ π π- = 1.096 fixed α
0-10% ,
= 1.247 fixed α
10-20% ,
= 1.373 fixed α
20-30% ,
= 1.422 fixed α
30-40% ,
= 1.403 fixed α
40-50% ,
= 1.348 fixed α
50-60% ,
PH ENIX
preliminary
2] [GeV/c mT
0.2 0.3 0.4 0.5 0.6 0.7 0.8 0.9
[1/fm]R1 /
0.2 0.4 0.6 0.8 1 1.2
α)
⋅(1+
λ R = R
= 200 GeV sNN
PHENIX Au+Au
π+
π+ -+ π π- linear fit
α)
⋅(1+
λ R = R
= 200 GeV sNN
PHENIX Au+Au
π+
π+ -+ π π- linear fit
α)
⋅(1+
λ R = R
= 200 GeV sNN
PHENIX Au+Au
π+
π+ -+ π π- linear fit
α)
⋅(1+
λ R = R
= 200 GeV sNN
PHENIX Au+Au
π+
π+ -+ π π- linear fit
α)
⋅(1+
λ R = R
= 200 GeV sNN
PHENIX Au+Au
π+
π+ -+ π π- linear fit
α)
⋅(1+
λ R = R
= 1.096 fixed α
0-10% ,
= 1.247 fixed α
10-20% ,
= 1.373 fixed α
20-30% ,
= 1.422 fixed α
30-40% ,
= 1.403 fixed α
40-50% ,
= 1.348 fixed α
50-60% ,
PH ENIX
preliminary
Figure 4. L´evy HBT fit parameters for various centralities in 200 GeV Au+Au collisions.
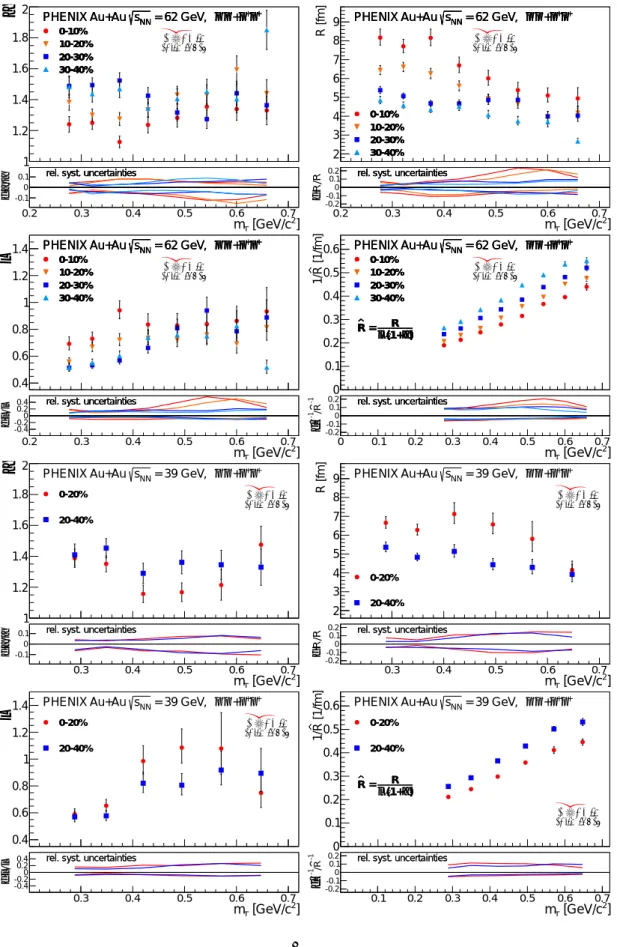
3. Centrality and collision energy dependence
We investigated the L´evy HBT correlation functions also at different collision energies, from
√sN N = 39 to 200 GeV, and for various centralities. At 200 GeV, we defined six centrality classes from 0–10% to 50–60%, at 62 GeV four classes (from 0–10% to 30–40%) and two classes at 39 GeV (0–20% and 20–40%). After performing all the fits to all the measured correlation functions, we extracted the mT-dependence of the fit parameters. For the 200 GeV analysis, we used 18 mT bins, 8 bins at 62 GeV and 6 bins at 39 GeV. The extracted fit parameters (as a function of mT) are shown in Figs. 4-5. At each energy, we observe an approximately mT
independent α value. To investigate themT dependence of the parameters, we performed fits with α fixed to its average value in the given centrality bin. This resulted in the clear trends shown in Fig. 4: in each centrality, 1/R2 and 1/Rb scale linearly with mT, and a “hole” of similar magnitude is observed for λ/λmax. At the lower energies (shown in Fig. 5), we observe qualitatively similar trends, but statistics prevents us from drawing more definitive conclusions.
In both case, the most clear trend is observable for the scaling variable R, which is apparentlyb the less prone to statistical fluctuations of the correlation function and the fit.
4. Three-pion correlations
As mentioned above, the λ intercept parameter of the two-pion momentum correlations may be related to the fraction of pions coming from the decays of long lived resonances. If so, the possible enhancement ofη0 production may be connected to it. An important cross-check of this
6
α
1 1.2 1.4 1.6 1.8 2
0-10%
10-20%
20-30%
30-40%
π+
π+ -+ π π-
= 62 GeV, sNN
PHENIX Au+Au 0-10%
10-20%
20-30%
30-40%
π+
π+ -+ π π-
= 62 GeV, sNN
PHENIX Au+Au 0-10%
10-20%
20-30%
30-40%
π+
π+ -+ π π-
= 62 GeV, sNN
PHENIX Au+Au 0-10%
10-20%
20-30%
30-40%
2] [GeV/c mT
0.2 0.3 0.4 0.5 0.6 0.7
α/αδ -0.1
0
0.1 rel. syst. uncertaintiesrel. syst. uncertaintiesrel. syst. uncertaintiesrel. syst. uncertainties
PH ENIX preliminary
R [fm]
2 3 4 5 6 7 8 9
0-10%
10-20%
20-30%
30-40%
π+
π+ -+ π π-
= 62 GeV, sNN
PHENIX Au+Au
0-10%
10-20%
20-30%
30-40%
π+
π+ -+ π π-
= 62 GeV, sNN
PHENIX Au+Au
0-10%
10-20%
20-30%
30-40%
π+
π+ -+ π π-
= 62 GeV, sNN
PHENIX Au+Au
0-10%
10-20%
20-30%
30-40%
2] [GeV/c mT
0.2 0.3 0.4 0.5 0.6 0.7
R/Rδ-0.2-0.10
0.1
0.2 rel. syst. uncertaintiesrel. syst. uncertaintiesrel. syst. uncertaintiesrel. syst. uncertainties
PH ENIX preliminary
λ
0.4 0.6 0.8 1 1.2 1.4
0-10%
10-20%
20-30%
30-40%
π+
π+ -+ π π-
= 62 GeV, sNN
PHENIX Au+Au 0-10%
10-20%
20-30%
30-40%
π+
π+ -+ π π-
= 62 GeV, sNN
PHENIX Au+Au 0-10%
10-20%
20-30%
30-40%
π+
π+ -+ π π-
= 62 GeV, sNN
PHENIX Au+Au 0-10%
10-20%
20-30%
30-40%
2] [GeV/c mT
0.2 0.3 0.4 0.5 0.6 0.7
λ/λδ-0.4-0.20
0.2
0.4 rel. syst. uncertaintiesrel. syst. uncertaintiesrel. syst. uncertaintiesrel. syst. uncertainties
PH ENIX preliminary
[1/fm]R1/
0 0.1 0.2 0.3 0.4 0.5 0.6
α)
⋅(1+
λ R = R
0-10%
10-20%
20-30%
30-40%
π+
π+ -+ π π-
= 62 GeV, sNN
PHENIX Au+Au
α)
⋅(1+
λ R = R
0-10%
10-20%
20-30%
30-40%
π+
π+ -+ π π-
= 62 GeV, sNN
PHENIX Au+Au
α)
⋅(1+
λ R = R
0-10%
10-20%
20-30%
30-40%
π+
π+ -+ π π-
= 62 GeV, sNN
PHENIX Au+Au
α)
⋅(1+
λ R = R
0-10%
10-20%
20-30%
30-40%
2] [GeV/c mT
0 0.1 0.2 0.3 0.4 0.5 0.6 0.7
-1 R/-1 Rδ-0.2 -0.1 0 0.1
0.2 rel. syst. uncertaintiesrel. syst. uncertaintiesrel. syst. uncertaintiesrel. syst. uncertainties
PH ENIX preliminary
α
1 1.2 1.4 1.6 1.8 2
0-20%
20-40%
π+
π+ -+ π π-
= 39 GeV, sNN
PHENIX Au+Au
0-20%
20-40%
2] [GeV/c mT
0.3 0.4 0.5 0.6 0.7
α/αδ -0.1
0
0.1 rel. syst. uncertaintiesrel. syst. uncertainties
PH ENIX preliminary
R [fm]
2 3 4 5 6 7 8 9
0-20%
20-40%
π+
π+ -+ π π-
= 39 GeV, sNN
PHENIX Au+Au
0-20%
20-40%
2] [GeV/c mT
0.3 0.4 0.5 0.6 0.7
R/Rδ-0.2-0.10
0.1
0.2 rel. syst. uncertaintiesrel. syst. uncertainties
PH ENIX preliminary
λ
0.4 0.6 0.8 1 1.2 1.4
0-20%
20-40%
π+
π+ -+ π π-
= 39 GeV, sNN
PHENIX Au+Au 0-20%
20-40%
2] [GeV/c mT
0.3 0.4 0.5 0.6 0.7
λ/λδ-0.4-0.20
0.2
0.4 rel. syst. uncertaintiesrel. syst. uncertainties
PH ENIX preliminary
[1/fm]R1/
0 0.1 0.2 0.3 0.4 0.5 0.6
α)
⋅(1+
λ R = R
0-20%
20-40%
π+
π+ -+ π π-
= 39 GeV, sNN
PHENIX Au+Au
α)
⋅(1+
λ R = R
0-20%
20-40%
2] [GeV/c mT
0.1 0.2 0.3 0.4 0.5 0.6 0.7
-1 R/-1 Rδ-0.2 -0.1 0 0.1
0.2 rel. syst. uncertaintiesrel. syst. uncertainties
PH ENIX preliminary
Figure 5. L´evy HBT fit parameters in√
sN N = 39 and 62 GeV Au+Au collisions.
1234567890 ‘’“”
34th Winter Workshop on Nuclear Dynamics IOP Publishing
IOP Conf. Series: Journal of Physics: Conf. Series 1070 (2018) 012026 doi :10.1088/1742-6596/1070/1/012026
2] [GeV/c mT
0.3 0.4 0.5 0.6 0.7 0.8
3λ
0 2 4 6 8
= 200 GeV sNN
@ = 200 GeV
PHENIX MinBias Au+Au sNN
= 200 GeV sNN
@ π−π−π−
π+π+π+
Core-Halo + chaotic
emission allowed range PH ENIX
preliminary
2] [GeV/c mT
0.3 0.4 0.5 0.6 0.7 0.8
3/2 2λ)/2λ-33λ=0.5(3κ
-1.5 -1 -0.5 0 0.5 1 1.5 2
= 200 GeV sNN
@
/NDF=197/62, C.L.<0.1%
χ2 3=1:
κ
= 200 GeV PHENIX MinBias Au+Au sNN
= 200 GeV sNN
@
Core-Halo + chaotic emission
π−π−π−
π+π+π+
PH ENIX
preliminary
Figure 6. The three-particle correlation strength,λ3, as function ofmT (top panel). Core-halo independent parameterκ3 as function of mT (bottom panel).
can be performed by the measurement of multi-pion correlations, since their zero momentum intercept is also related to the core/halo ratio. It turns out [31] that if we define two- and three-particle correlation intercepts (neglecting K dependence) as
λ2≡C2(Q12→0)−1 (11)
λ3≡C3(Q12→0, Q13→0, Q23→0)−1 (12) then these can be expressed from the core fraction fc as
λ2 =fc2, λ3 = 2fc3+ 3fc2. (13) It is immediately clear from this, that we may define
κ3 = λ3−3λ2 2√
λ23 (14)
which is equal to one in case of the core-halo model. Hence if κ3 6= 1, that would point to pion production beyond the core-halo model, such as coherence, as also discussed in Ref. [24].
We measured the value of the above defined λ3 and κ3 parameters, as shown in Fig. 6. The preliminary uncertainties were calculated from simultaneous variation of two- and three-pion analysis settings. We observe that κ3 is near unity, but the preliminary status of this analysis prevents us from making a more definitive conclusion.
8
5. Summary
In summary, we measured two- and three-particle correlation functions of identical pions at various collision energies and centralities, and fitted them with correlation functions calculated from L´evy sources. We found that this assumption yields a statistically acceptable description of all results. We extracted the mT dependence of two-particle L´evy parameters α, R and λ.
We found that the αparameter is far from 2, and has only a slight mT dependence, but a more pronounced centrality dependence. We also found that 1/R2 is approximately linear with mT, while λ decreases at low mT, showing a “hole-like” structure, not incompatible with models utilizing a decreased η0 mass. We also demonstrated the appearance of a scaling parameter R,b the inverse of which shows a very clear linear scaling with mT. Furthermore, we investigated if the interpretation ofλholds as being related to the core-halo ratio, by measuring three-particle correlations. The κ3 parameter, which equals to unity in the core-halo model, was measured to be close to this conjectured value.
Acknowledgments
The author expresses gratitude for the excellent organization of the WWND 2018 conference.
The author was supported by the Hungarian NKIFH grant No. FK-123842, by the J´anos Bolyai Research Scholarship of the Hungarian Academy of Sciences and the ´UNKP-17-4 New National Excellence Program of the Hungarian Ministry of Human Capacities.
References
[1] Hanbury Brown R, Jennison R C and K D G M 1952Nature1701061–1063 [2] Brown R H and Twiss R 1956Nature 17727–29
[3] Twiss R Q, Little A G and Hanbury Brown R 1957Nature180pages 324–326 [4] Hanbury Brown R and Twiss R Q 1956Nature1781046–1048
[5] Townes C H 1999Astrophysical Journal 525C148
[6] Michelson A A and Pease F G 1921Astrophysical Journal 53249–259
[7] Brown R H, Davis J and Allen L R 1967Mon. Notices Royal Astron. Soc.137375–392 [8] Hanbury Brown R, Hazard C, Davis J and Allen L R 1964Nature 201pages 1111–1112
[9] Brown R H, Davis J, Allen L R and Rome J M 1967Mon. Notices Royal Astron. Soc.137393–417 [10] Dravins D, Jensen H, LeBohec S and Nu˜nez P D 2010Optical and Infrared Interferometry II (Proceedings
of the SPIE vol 7734) p 77340A (Preprint 1009.5815) [11] Glauber R J 1963Phys. Rev. Lett.1084–86
[12] Glauber R J 2006Rev. Mod. Phys.781267–1278
[13] Glauber R J 2006Nucl. Phys.A7743–13 (Preprint nucl-th/0604021)
[14] Goldhaber G, Fowler W B, Goldhaber S and Hoang T F 1959Phys. Rev. Lett.3181–183 [15] Goldhaber G, Goldhaber S, Lee W Y and Pais A 1960Phys. Rev.120300–312
[16] Lednicky R 2001 (Preprint nucl-th/0112011)
[17] Adare Aet al.(PHENIX) 2017 (Preprint 1709.05649)
[18] Metzler R, Barkai E and Klafter J 1999Phys. Rev. Lett.823563–3567
[19] Csan´ad M, Cs¨org˝o T and Nagy M 2007Braz. J. Phys.371002–1013 (Preprint hep-ph/0702032) [20] Cs¨org˝o T, Hegyi S and Zajc W A 2004Eur. Phys. J.C3667–78 (Preprint nucl-th/0310042) [21] Csan´ad M (PHENIX) 2017Universe 385 (Preprint 1711.05575)
[22] Kincses D (PHENIX) 2018Universe411 (Preprint 1711.06891) [23] L¨ok¨os S (PHENIX) 2018Universe431 (Preprint 1801.08827) [24] Nov´ak T (PHENIX) 2018Universe 457 (Preprint 1801.03544)
[25] Bolz J, Ornik U, Plumer M, Schlei B and Weiner R 1993Phys.Rev.D473860–3870
[26] Cs¨org˝o T, L¨orstad B and Zim´anyi J 1996Z. Phys.C71491–497 (Preprint hep-ph/9411307)
[27] Kapusta J I, Kharzeev D and McLerran L D 1996Phys. Rev.D535028–5033 (Preprint hep-ph/9507343) [28] Vance S E, Cs¨org˝o T and Kharzeev D 1998Phys. Rev. Lett.812205–2208 (Preprint nucl-th/9802074) [29] Cs¨org˝o T, V´ertesi R and Sziklai J 2010Phys.Rev.Lett.105182301 (Preprint 0912.5526)
[30] Adcox Ket al.(PHENIX Collaboration) 2005Nucl. Phys.A757184–283 (Preprint nucl-ex/0410003) [31] Cs¨org˝o T 2002Heavy Ion Phys.151–80 (Preprint hep-ph/0001233)