fatality-rate for patients under age of 70 years and hospitalization risk overall
MERYEM CETIN
1p, PERVIN OZLEM BALCI
2, HAKAN SIVGIN
3, SIRIN CETIN
4, AYSE ULGEN
5p, HATICE D ORTOK DEMIR €
6and WENTIAN LI
7p1Department of Medical Microbiology, Faculty of Medicine, Amasya University, Amasya, Turkey
2Department of Medical Microbiology, Tokat State Hospital, Tokat, Turkey
3Department of Internal Medicine, Tokat State Hospital, Tokat, Turkey
4Department of Biostatistics, Faculty of Medicine, Tokat Gaziosman Pasa University, Turkey
5Department of Biostatistics, Faculty of Medicine, Girne American University, Karmi, Cyprus
6Department of Medical Biochemistry Faculty of Medicine, Amasya University, Amasya, Turkey
7The Robert S. Boas Center for Genomics and Human Genetics, The Feinstein Institutes for Medical Research, Northwell Health, Manhasset, NY, USA
Received: June 28, 2021 • Accepted: July 28, 2021 Published online: August 11, 2021
ABSTRACT
The emergence of new SARS-CoV-2 variants is a challenge to the control of this pandemic. It is therefore important to collect and to analyze data related to the infection caused by different variants.
We have obtained more than 3,700 COVID-19 patients between April 2020 and March 2021 from Tokat, Turkey (roughly 3,100 outpatients and close to 600 inpatients) where about 30% were infected with Alpha variant (B.1.1.7). Descriptive statistics was used to characterize different subgroups. Both logistic regression and cause-specific Cox survival analysis of competing-risk was run on inpatients, to examine the impact of Alpha variant on hospitalization, on mortality and on other factors. We observed that the Alpha variant is over-represented in inpatients than outpatients so infection by Alpha variant increases the chance for hospitalization. The impact of Alpha variant on mortality seems to depend on the patient’s age. For patients under age of 70, the case-fatality-rate was 0.84% (5.3%) for patients without (with) Alpha variant (Fisher’s testP-value52.431010). For patients above age of 70, the trend is opposite: the case-fatality-rate is 31.5% (13.6%) for patients without (with) Alpha variant (Fisher’s testP-value50.0016). The two opposite trends would cancel each other, making other an- alyses such as cause-specific Cox regression and logistic regression non-significant. The Alpha variant increases the risk for hospitalization, increases the case-fatality-rate for lower age group, and decreases the case-fatality-rate for the upper age group. If the increase of case-fatality-rate in not the most senior group holds true, it should provide useful information for a vaccination planning to counter the impact of Alpha variants.
KEYWORDS
COVID-19, SARS-CoV-2 virus, Alpha variant, age-dependency, case-fatality rate
INTRODUCTION
The global COVID-19 pandemic, like the similar event for 1918 influenza pandemic [1], swept through every corner of the world, causing tremendous public health and economic damages. Multiple waves of COVID-19 occurred in different regions of the world. The reasons for multiple waves can be complicated: it could be related, or induced by changes in
Acta Microbiologica et Immunologica Hungarica
68 (2021) 3, 153–161 DOI:
10.1556/030.2021.01524
© 2021 Akademiai Kiado, Budapest
RESEARCH ARTICLE
pCorresponding authors:
E-mail:ayshe.ulgen@global.t-bird.edu;
meryemcetin55@yahoo.com;
wtli2012@gmail.com
public health measures (e.g., quarantine or not), or purely due to the time lapse for the virus to spread from one place to another. There is also a burning question about whether a new variant of the virus would spread faster and cause more deaths, thus leading to more lethal/harmful new waves.
Thanks to the monitoring work of COVID-19 Genomics UK Consortium, a new variant of SARS-CoV-2, B.1.1.7 (or 201/501Y.V1, VOC-202012/01), was detected in the UK [2–4], which was later named Alpha variant by WHO. Soon, other new variants have been reported, including B.1.351 or Beta variant from South Africa [5] and P.1 or Gamma variant from Brazil [6]. The B.1.1.7 is best known for the N501Y mutation; the B.1.351 shares the same N501Y mu- tation with the B.1.1.7, but also has the E484K mutation, among others; and P.1 (a branch in the B.1.1.28 lineage) has both N501Y and E484K mutations. More recently, a new variant arised from India (Delta variant) with L452R, E484Q and P681R mutations [7].
The emergence of the new viral variant is of great concern. In a surprising finding, many people in Manaus, Brazil who were infected with COVID-19 earlier in 2020 (as indicated by the blood antibodies) were reinfected with the new variant [8]. The Alpha variant B.1.1.7 quickly spread to Turkey and it was one of the dominant variants in Turkey in early 2021. It has been shown that B.1.1.7 variant has a higher transmissibility [9]. Here, we would like to address the issue of whether B.1.1.7 affects disease severity and mortality by examining a patient dataset from Tokat, Turkey. This analysis on the effect of Alpha variant was carried out on relevant factors in particular the age of patients.
METHODS
Data
All patients were treated at the Tokat State Hospital between the beginning of April of 2020 and the end of March of 2021. Although we did not have information on COVID-19 vaccination status of patients from these four analyses, the chance was very low that any of these patients had been vaccinated because the early vaccine was only available for health workers and not available for general public. The determination of COVID-19 infection was performed at Tokat State Hospital COVID-19 laboratory, with Bio-Speed SARS-CoV-2 Double Gene RT-q PCR Kit (bioeksen.com.tr).
The kit was applied to nucleic acid extracts obtained with Vnat extraction buffer from nasopharyngeal aspirate/lavage, bronchoalveolar lavage, nasopharyngeal swab, oropharyn- geal swab, and sputum samples. The one-step reverse tran- scription (RT) real-time PCR (RT-qPCR) targets the N and ORF1ab gene region of the SARS-CoV-2 virus sequence.
The human RNaseP gene was used for inhibition control.
In the variant analysis, we used Bio-Speed SARS-CoV-2 Variant Plus Kit (bioeksen.com.tr). This kit is a one-step RT-qPCR designed to qualitatively detect SARS-CoV-2 and to differentiate B.1.1.7 (“Alpha variant” or “UK variant”),
B.1.351 (“Beta variant” or“South Africa variant”), and P.1 (“Gamma variant”or“Brazil variant”).
Since very few Beta and Gamma variants were detected, these were discarded from this dataset and not analyzed.
When a sample was not one of these three variants, it was called “non-Alpha-variant” in this paper. In this paper, we will use the term “Alpha variant” to refer B.1.1.7 variant.
Since the B.1.1.7 variant did not appear in UK until mid- October 2020, we can safely call our samples collected before certain date to be non-Alpha-variant, even without a Bio-Speed Plus Kit test.
Statistical analysis
All statistical analyses were carried out by using the R sta- tistical platform and programs (https://www.r-project.org).
The logistic regression was carried out by R function glm (generalized linear model) with family option to be“bino- mial”. The Fisher’s test was carried out by R functionfish- er.test. The proportional hazard Cox model for survival analysis (time-to-event analysis) was carried out the coxph function in thesurvival package.
RESULTS
A general description of the COVID-19 patient data
The description of our data is summarized inTable 1. There were 3707 COVID-19 patients, most of them were out- patients (n53,111). Of the 596 inpatients, 72% were non- ICU and 28% were admitted to ICU. Comparing outpatients and inpatients, inpatients were older; and comparing ICU inpatients and non-ICU patients, ICU patients were older.
As expected, none of the outpatients died and 19 out of 429 (4.4%) non-ICU patients died. As a comparison, close to 77% of ICU patients did not survive. Although the outpatient, non-ICU inpatient, and ICU patient may not be the best partition of patient samples from a biological perspective [10], these were convenient groups for our current analysis.
For any factor, we can both contrast the level between outpatients and inpatients, and between non-ICU inpatients and ICU inpatients. However, some blood tests were not administered for the majority of outpatients (e.g., whole blood cell, neutrophil, lymphocyte). Therefore, some test results between outpatients and inpatients should be treated with caution.
Table 1 shows strikingly, that almost all factors were significantly different at the 0.005 level between outpatients and inpatients, as well as between non-ICU and ICU inpatients. The reason for using P-value 5 0.005 as a threshold instead of 0.05 and 0.01 is because the latter practice often lead to an unacceptable level of false positives [11–14]. TheP-value inTable 1either results from at-test for the original measurement, a t-test for the log-trans- formed level (if the log-transformation makes the distribu- tion more normal-like), or from a Fisher’s test (if the factor is binary).
The only non-significant results (around 0.005 level) were chlorine (outpatient vs inpatient), and gender (non- ICU vs ICU). The most significantly different factors in outpatient vs in-patient comparison (meaning smallest P-values) included age (P-value 5 5.1E-94), calcium (P-value 51.8E-58), and ferritin (P-value 5 8.9e-87). The P-values for non-ICU vs ICU test were comparatively less smaller, partly because the sample size was smaller. Never- theless, theseP-values were still quite small.
Finally, in the last row in Table 1, we show the pro- portion of patients infected with the Alpha variant. Again, the outpatient vs inpatient comparison and non-ICU vs ICU comparison were significantly different at the 0.005 level.
We further elaborate on these two comparisons below.
Alpha variant infected patients are more likely to be admitted to hospital than being treated as outpatients
Although the title of this subsection may imply a causal connection, what the data show is simply a direct association between the rate of Alpha variant infection in the outpatient and inpatient groups. However, since infection occurs before being admitted to hospital, we can assume cause precedes
effects.Table 1shows 33% of the inpatients (both non-ICU and ICU) had Alpha variant, as compared to the 13% for outpatients who have Alpha variant.
Since inpatients and outpatients were different in almost any their factor value, one may question if there is a con- founding between the Alpha variant infection and other factors. We address this issue by using a two-variable logistic regression: logðPin=ð1−PinÞÞ ¼aþbXþcXav; where Pin is the probability for a patient to be admitted as inpatient,X is the level (or log-level) of a factor, andXav5(0, 1) is the indicator variable for absence or presence of the Alpha variant.
Table 2shows that to be infected with the Alpha variant contributes independently to the chance to be admitted to hospital, independent from other factors because these contributions were summarized in their own coefficient in the logistic regression. The negative sign for b coefficient for gender, calcium, and lymphocyte means (female coded as 2, and male coded as 1), those with higher calcium level, and those with higher level of lymphocyte counts were less likely to be admitted to hospital. The positive sign for the c co- efficient for Alpha variant means people with the Alpha variant were more likely to be admitted to hospital.
Table 1.Overall statistics of various factor values in all patients, outpatients, inpatients, non-ICU inpatients, and ICU patients. Mostly the mean value is given, whereas for other factors, whose log-transformed value is closer to normal distribution, the median and geometric mean (geom) value is given. The test result of differences between outpatients vs inpatients, between non-ICU vs ICU, are given inP-values, which can be either fromt-test, ort-test of log-transformed value, or from Fisher’s test for binary factors.P-values lower than 0.005 are marked
with bold font
factor
all (n53,707)
outpatient (n53,111)
inpatient
(n5596) P-value
in (non-ICU) (n5429)
in (ICU)
(n5167) P-value
gender (male) 1,742 (47%) 1,425 (46%) 317 (53%) 218 (51%) 99 (59%)
(female) 1,965 (53%) 1,686 (54%) 279 (47%) 0.0011 211 (49%) 68 (41%) 0.068
age (mean) 41.26 37.94 58.61 5E-94 54.5 69.16 7E-21
calcium (mean) 9.32 9.45 8.72 2E-58 9.01 7.97 2E-27
chlorine (mean) 103.75 103.69 103.98 0.24 103.29 105.73 0.00026
creatine (mean) 0.83 0.74 1.24 1E-19 0.9 2.13 2E-15
potassium (mean) 4.3 4.28 4.39 0.00025 4.28 4.67 3E-05
sodium (mean) 139.06 138.82 140.19 6E-10 139.24 142.64 4E-08
HGB (mean) 12.72 13.5 12.12 3E-27 12.69 10.68 4E-22
PLT (mean) 231.31 221.55 238.93 0.0017 254.34 200.64 7E-07
DD (median/geom) 0.3/0.34 0.22/0.25 0.47/0.55 2E-30 0.33/0.34 1.97/1.5 4E-40
(typed%) 34.3% 24.7% 84.4% 80.2% 95.2%
CRP 1.38/1.5 1.06/1.17 3.79/4.57 6E-27 3.26/3.21 12/12.13 5E-07
(typed%) 54.4% 53.1% 61.2% 62.5% 58.1%
WBC 6.79/7.1 6.17/6.23 7.28/7.87 1E-15 6.54/6.58 13.5/12.32 2E-27
(typed%) 27.6% 14.4% 96.5% 95.6% 98.8%
NEU 4.43/4.7 3.83/3.82 5.19/5.57 1E-20 4.33/4.26 12.04/10.63 3E-36
(typed%) 26% 13.9% 89.6% 88.1% 93.4%
LYM 1.41/1.29 1.54/1.51 1.26/1.14 1E-11 1.48/1.44 0.64/0.65 1E-20
(typed%) 26% 13.9% 89.6% 88.1% 93.4%
ALT 19.2/21.57 18.4/20.17 25.85/30.13 2E-19 25.3/27.61 28.3/37.73 0.0057
AST 22/24.45 21.1/22.72 28/35.26 4E-25 26/28.79 40.9/59.28 9E-10
urea 27.09/28.53 26.2/26.3 35.94/42.69 2E-46 31.7/32.55 89.7/85.66 1E-33
LDH 201.75/221.79 193/203.2 259.85/300.07 1E-39 229.15/244.7 460/494.2 2E-24
ferritin 51.28/54.25 38.93/39.5 218.59/194.06 9E-87 130.28/120.09 716/615.39 2E-35
death 147 (4.0%) 0 147 (24.7%) 1E-124 19 (4.4%) 128 (76.6%) 8E-73
Alpha var 588 (15.9%) 391 (12.6%) 197 (33.1%) 6E-31 153 (35.7%) 44 (26.3%) 0.033
To further test more complicated models, we have run two logistic regressions with 3 or 5 independent variables:
age, gender, and Alpha variant, or age, gender, calcium, and (log transformed) ferritin, and Alpha variant. The contri- bution from Alpha variant to the hospital admission was still significant (P-value 5 6.9E-25 and 2.9E-17 respectively), conditional on other factors that were known to be most associated with the dependent variable by themselves.
Four analyses for inpatients related to the impact of alpha variant on mortality and on discharge
To address the impact of presence of Alpha variant on mortality or on hospital discharge, we carried out four different analyses. The first and second is straightforward logistic regression:
log Pd
1Pd ¼aþbXþcXav (1) wherePdis the mortality probability,Xis a factor’s level or log-level, and Xav5(0, 1) is absence or presence of Alpha variant. The same logistic regression is applied twice: on inpatients only, or, on both inpatients and outpatients.
The third analysis is cause-specific hazard model on time-to-death variable treating release as right-censored events:
log hcsdðtÞ
hcsd;baseðtÞ¼aþbXþcXav (2)
where hcsd is the cause-specific hazard for death event [15, 16]. The third analysis is another cause-specific hazard model on time-to-release with death event as right censored ones:
log hcsrðtÞ
hcsr;baseðtÞ¼aþbXþcXav (3)
where hcsr is the cause-specific hazard for release [15, 16].
There will be four P-values for testing the coefficient to be zero in the above analyses.
The reason we always use a conditional analysis with both Alpha variant and another factor as independent var- iables is because we don't expect Alpha variant to play a major role on mortality and discharge. It is therefore to include other more important factors (e.g. age) into consideration. Let us review the meaning of a possible result:
if the coefficient c in Eq.1 is positive and the P-value is significant at (e.g.) 0.005 level, then the presence of Alpha variant contributes to the probability of dying conditional on another factor x; For Eq.2, it would mean Alpha variant contributes to a shortening of event-to-dead time (i.e., die with a faster rate); For Eq.3, it is the opposite to Eq.2, and Alpha variant contributes to a faster recovery of the patient.
These four sets ofP-values are listed in Table 3. Unlike the difference between inpatients and outpatients as shown in Table 2, the contribution from Alpha variant to death, to faster discharge, and to faster death, is unclear. We do see some significant (at 0.005 level) results, but if the age factor is added as the third variable, then the contribution Table 2.Contribution of a factor and Alpha-variant status in a bivariate logistic regression, where the dependent variable is inpatient/
outpatient status. Both the coefficient value and theP-value for testing zero coefficient value is shown, for both the factor and for the Alpha-variant indicator variable. The last two rows are results for a three-variable andfive-variable logistic regression, where only the
result for the Alpha-variant indicator variable is shown.P-values lower than 0.005 are marked with bold font
Factor(s) name
logistic regression: logit (P(hospitalization))∼b*factorþc*avar.
b5cof (factor) P-value (test b50) c5cof (avar) P-value (test c50)
gender 0.34 2E-4 1.25 5E-34
age 0.07 2E-107 1.2 2E-24
calcium 1.31 2E-70 0.9 5E-15
chlorine 0.03 0.03 1.26 4E-32
creatine 0.92 8E-28 1.27 3E-32
potassium 0.54 2E-09 1.31 3E-35
sodium 0.13 2E-21 1.39 6E-38
HGB 0.34 3E-22 0.31 0.026
PLT 0.0021 0.0035 0.33 0.013
(log) DD 0.64 1E-28 0.78 3E-08
(log) ALT 0.68 9E-28 1.2 2E-29
(log) AST 1.19 4E-39 1.19 7E-28
(log) urea 1.8 3E-68 1.21 2E-26
(log) CRP 0.46 8E-39 1.9 1E-25
(log) LDH 1.98 5E-52 1.22 2E-24
(log) WBC 1.03 8E-13 0.26 0.052
(log) NEU 0.95 9E-17 0.21 0.13
(log) LYM 0.7 4E-10 0.26 0.052
(log) ferritin 0.78 3E-80 1.08 9E-19
ageþgender 1.21 7E-25
ageþgenderþcalciumþferritin 1.12 3E-17
from Alpha variant becomes insignificant (see the bottom of Table 3).
Alpha variant increases the case-fatality-rate for younger patients whereas reduces the case-fatality- rate for older patients
Although we did not obtain a conclusive result concerning the contribution of Alpha variant on mortality, we would like to draw the raw data for any potential hint. Figure 1 shows each person as a point with age as the x-axis and calcium level as they-axis. The deceased patients are marked with darker colors. The Alpha variant and non-Alpha variant are marked with lightblue/blue and pink/red color.
To see how the case-fatality-rate changes with age for both non-Alpha variant and Alpha variant, we use a 10-year age window to calculate the percentage of patients in the two groups who died. It can be seen that Alpha variant group has a slightly higher case-fatality-rate than the non-Alpha
variant group for younger (e.g.≤70) aged patients, whereas the non-Alpha variant group has a higher case-fatality-rate in older ages.
Inspired by this finding, we examined what if the co- variate in conditional analysis is changed from age to age group. The last three lines inTable 3shows that for event- to-discharge time, Alpha-variant contributes significantly (at 0.005 level) to a faster recovery rate. At 0.05 level, logistic regression for inpatients also shows the benefit of having Alpha variant which reduce the case-fatality-rate. We also carried out a test on the 2-by-2 table with column/row as Alpha-variant/dead-status by partitioning the samples into two age groups. For the“younger” group (age < 70) with 3,356 samples, the case-fatality-rate increases from 0.84% in those without Alpha-variant to 5.3% in those with Alpha- variant (Fisher’s test P-value 5 2.4e-10). For the age ≥70 group (n5 351), the case-fatality-rate reduced from 31.5%
for non-Alpha-variant patients to 13.6% for Alpha-variant patients (Fisher’s testP-value50.0016). This opposite trend Table 3.Results from four bivariate analyses are shown: (1) cause-specific Cox regression with time-to-discharge as dependent variable; (2) cause-specific Cox regression with time-to-death as dependent variable; (3) logistic regression with death status as dependent variable, for inpatients only; (4) same as (3) but using both inpatients and outpatients. The coefficient and theP-value for testing the coefficient equal to zero for the Alpha variant indicator variable is shown. Results from several three-variable analyses (age, a factor, and Alpha-variant status)
are also listed.P-values lower than 0.005 are marked with bold font
covariate factor
Cox release Cox death LR inpatients LR all-samples
cof (factor) P-value cof (factor) P-value cof (factor) P-value cof (factor) P-value
gender 0.15 0.14 0.077 0.69 0.44 0.042 0.66 6.5e-4
age 0.09 0.37 0.01 0.97 0.35 0.12 0.29 0.19
calcium 0.32 0.002 0.21 0.28 0.86 0.00068 0.18 0.46
chlorine 0.21 0.042 0.1 0.59 0.48 0.03 0.62 0.0019
creatine 0.16 0.12 0.08 0.7 0.36 0.14 0.54 0.016
potassium 0.16 0.12 0.09 0.65 0.41 0.065 0.72 0.00043
sodium 0.14 0.17 0.07 0.71 0.31 0.17 0.85 5E-05
HGB 0.14 0.18 0 1 0.45 0.05 0.51 0.018
PLT 0.25 0.019 0.13 0.52 0.54 0.014 0.65 0.0014
(log) DD 0.2 0.077 0.1 0.61 0.39 0.13 0.18 0.44
(log) ALT 0.22 0.033 0.13 0.5 0.52 0.017 0.48 0.018
(log) AST 0.23 0.03 0.1 0.6 0.5 0.022 0.45 0.037
(log) urea 0.33 0.0015 0.3 0.12 0.74 0.0093 0.12 0.64
(log) CRP 0.1 0.53 0.04 0.91 0.5 0.16 0.78 0.024
(log) LDH 0.17 0.1 0 0.99 0.5 0.023 0.27 0.26
(log) WBC 0.22 0.039 0.09 0.65 0.71 0.0059 0.55 0.018
(log) NEU 0.33 0.0023 0.09 0.65 0.83 0.0021 0.65 0.0089
(log) LYM 0.3 0.0062 0.35 0.091 0.63 0.006 0.76 0.0011
(log) ferritin 0.31 0.0036 0.03 0.88 0.63 0.015 0.0016 0.99
genderþage 0.068 0.52 0.011 0.95 0.35 0.14 0.30 0.17
calciumþage 0.23 0.032 0.13 0.51 0.64 0.013 0.084 0.73
chlorineþage 0.12 0.25 0.032 0.87 0.33 0.16 0.38 0.092
potassiumþage 0.07 0.51 0.0095 0.96 0.32 0.17 0.32 0.17
sodiumþage 0.056 0.59 0.007 0.97 0.17 0.49 0.61 0.0087
PLTþage 0.15 0.15 0.069 0.72 0.42 0.076 0.38 0.092
(log) ureaþage 0.22 0.039 0.27 0.17 0.68 0.018 0.02 0.95
(log) NEUþage 0.25 0.02 0.05 0.81 0.71 0.011 0.55 0.039
(log) LYMþage 0.24 0.027 0.27 0.19 0.49 0.042 0.47 0.06
(log) ferritinþage 0.21 0.048 0.02 0.91 0.4 0.14 0.02 0.93
age≥60 0.23 0.03 0.056 0.78 0.46 0.084 0.008 0.97
age≥70 0.27 0.013 0.066 0.74 0.45 0.089 0.056 0.82
age≥80 0.31 0.0033 0.074 0.71 0.58 0.026 0.022 0.93
for different age groups might explain why we did not obtain a clear cut conclusion inTable 3because effect of different directions in the age variable may cancel each other.
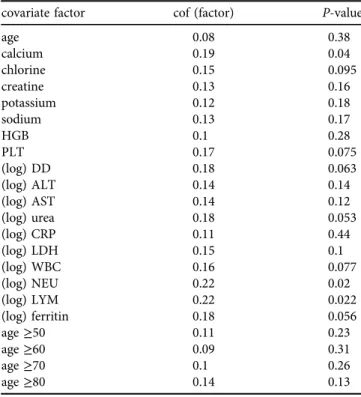
Alpha variant infection does not affect the hospital stay time
From hospital management perspective, the number of days a patient occupies a bed is the most relevant variable, regardless of the patient ends up discharged or died. We carried out another survival analysis for the n 5 596 in- patients with the hospital stay as the time-to-event, and event status is all 1 (no right-censored data). The meaning of hazard in Cox regression is the leaving-hospital rate: if the hazard ratio is larger than one (orccoefficient positive) for a factor, that factor makes the patient discharge/die faster; if the hazard ratio is less than one (orccoefficient negative), the factor causes a slower release of the patient.
Table 4 shows the results from two-variable Cox regression for the time to any event; with one factor being listed on thefirst column, and the second factor being the indicator variable for Alpha variant. The results (ccoefficient and P-value for testingc5 0) are all for the Alpha-variant indicator variable. We did not have any situation where the Alpha-variant’s contribution to hospital stay time to be significant at 0.005 level. The contribution from the covar- iate factor to hospital stay time can be more complicated [17], but it is not the focus of this analysis. Generally speaking, the same factor can contribute to hospital time in
inpatients only
0 20 40 60 80
age notAlpha/deceased/M
non−Alpha
Alpha
calcium 2468101214
Fig. 1.A display of all patients (both inpatients and outpatients) by their age (x-axis) and calcium level (y-axis). Lightblue/blue indicate non- Alpha-variant, and pink/red indicate Alpha variant. Deceased patients are marked with solid symbols and darker color. The case-fatality- rate in both non-Alpha-variant (blue) and Alpha-variant patients (red) in a 10-year moving window in age is shown at the bottom (not in
real height)
Table 4.Results from bivariable Cox regression with the time-to- event (where the event can be either death or discharge) as the dependent variable. Only the result for the Alpha-variant indicator
variable (coefficient andP-value for testing zero coefficient) is shown. Since noP-value is smaller than 0.005, nothing is marked
with the bold font
covariate factor cof (factor) P-value
age 0.08 0.38
calcium 0.19 0.04
chlorine 0.15 0.095
creatine 0.13 0.16
potassium 0.12 0.18
sodium 0.13 0.17
HGB 0.1 0.28
PLT 0.17 0.075
(log) DD 0.18 0.063
(log) ALT 0.14 0.14
(log) AST 0.14 0.12
(log) urea 0.18 0.053
(log) CRP 0.11 0.44
(log) LDH 0.15 0.1
(log) WBC 0.16 0.077
(log) NEU 0.22 0.02
(log) LYM 0.22 0.022
(log) ferritin 0.18 0.056
age≥50 0.11 0.23
age≥60 0.09 0.31
age≥70 0.1 0.26
age≥80 0.14 0.13
two opposite ways: an increase of its level may cause a non- surviving patient to die faster, and at the same time, making a surviving patient to stay in hospital longer.
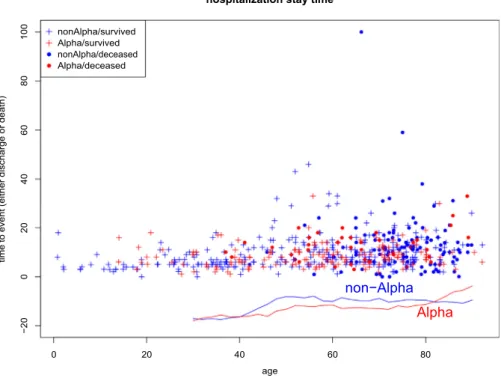
To examine if the impact of Alpha variant on hospital- ization stay time also depends on age, we plot the hospital stay time as a function of age inFig. 2. Each point inFig. 2 represents one patient, and it’s Alpha-variant status (blue for non-Alpha-variant, red for Alpha-variant) and the alive/
death status (cross for alive, solid circle for deceased) are marked. The curve below shows average (averaging over a 10-year window) hospital stay time in the Alpha-variant patients (red) and non-Alpha-variant ones (blue). There is a trend that non-Alpha-variant patients seem to stay in hos- pital longer until reaching a very old age. However, t-test using various age cut off does not show a significant (at 0.005 level) difference between hospital stay times.
DISCUSSION
The presence of virus variants might have been important for past pandemics. The 1918 influenza pandemics consisted of three waves [18]: first wave in the spring of 1918, and the more fatal second and third wave came in the winter of 1918–1919. At the time, without knowledge of pathogen identity and without the understanding of genetic infor- mation stored in nucleic acids, obviously there was no sequencing data. There are however recent attempts to reconstruct 1918 influenza virus [19,20]. It had been spec- ulated that the second wave in 1918–1919 pandemics was more fatal because the cumulative mutations led to more
virulent variants [18, 21]. Fast forward 100 years, we start to see in the current COVID-19 pandemic potential links between variants and multiple waves, as well as links be- tween variants and severity/mortality of the disease.
Our first conclusion is that the presence of Alpha variant increases the chance of hospitalization, which is another way to say increase the chance to have more severe symp- toms. This result can be seen fromTable 1that though 13%
of the outpatients have Alpha variant versus the 33% for inpatients. However, count statistics in Table 1 does not take into account of other relevant factors, such as age and the time period a patient is examined. We have considered the effect of age as well as other factors in a conditional logistic regression (Table 2), and the conclusion remains the same. On admission time, we cannot obtain such in- formation for all patients and cannot carry out a conditional analysis.
The impact of Alpha variant on case-fatality-rate is more complicated. In the literature, there are conflicting reports on Alpha variant’s effect on mortality rate. Davies et al. [3]
analyzed the impact of Alpha variant on severity (presum- ably including the most extreme of severity, i.e. death) and the result was uncertain (presumably with an insignificant P-value and confidence interval covering both directions).
On the other hand, other publications result a positive impact of Alpha variant on mortality rate or hazard ratio [22–24].
Our result indicates that the impact of Alpha variant on probability of death or/and rate of death (hazard) can be non-trivial and nonlinear. While we don't see much signif- icant (at 0.5 level) results for Alpha variant conditional on
hospitalization stay time
0 20 40 60 80
age nonAlpha/deceased
non−Alpha Alpha
timetoevent(eitherdischargeordeath) −20020406080100
Fig. 2.A display of all inpatient’s hospital stay time as a function of patient’s age. Non-Alpha-variant (Alpha-variant) inpatients are marked with blue (red) color. Surviving (deceased) patients are marked with pluses (solid circle), The average hospital stay time in a 10-year moving
window in age is shown for both non-Alpha-variant (blue) and Alpha-variant (red) infected inpatients
another factor (Table 3), the raw data show a change of trend in different age groups: Alpha variant seems to have a positive impact on death for younger age group, whereas a negative impact for older age group. The intrinsic difficulty infinding patterns concerning a variant is that it is not the only potentially relevant factor. Any other information, such as the genetic and immunological condition of a patient, the treatment availability, comorbidity and other health condi- tion, all may contribute to the mortality rate.
CONCLUSIONS
Using more than 3,700 patients from a Turkish hospital, we observed that Alpha variant (B.1.1.7) is over represented in hospitalized inpatients than among outpatients. This over representation holds true even after analysis on age or other factors. We did not observe a consistently significant result on the contribution of Alpha variant to mortality probability or mortality rate (hazard) if using the traditional cause- specific Cox regression and logistic regression. However, if the patients are partitioned into two age group, the presence of Alpha variant significantly (at 0.005 level) increases the case-fatality-ratio in the less-than-70-years-old group, while significantly decrease that in the older group. These infor- mation should be useful for the management and treatment of COVID-19 inpatients. In particular, if the Alpha variant increases the case-fatality-rate for relatively younger age group, it is imperative to vaccinate young, middle-aged, and early senior population to counter the impact of wave of the Alpha variant. After finishing this paper, we found a pre- print with the same conclusion (the first part) as ours that the B.1.1.7 increases the hospitalization risk [25], which is later published [26] .
Declaration of competing interest: The authors have no conflict of interest to declare.
Funding:This research received no external funding.
ACKNOWLEDGMENT
WL acknowledges the support from Robert S Boas Center for Genomics and Human Genetics.
REFERENCES
1. Shanks GD. COVID-19 versus the 1918 influenza pandemic:
different virus, different age mortality patterns. J Travel Med 2020;
27: taaa086.
2. Rambaut A, Loman N, Pybus O, Barclay W, Barrett J, Carabelli A, et al. Preliminary genomic characterisation of an emergent SARS- CoV-2 lineage in the UK defined by a novel set of spike mutations;
2020. URL: https://virological.org/t/preliminary-genomic-
characterisation-of-an-emergent-sars- cov-2-lineage-in-the-uk- defined-by-a-novel-set-of-spike-mutations/563.
3. Davies NG, Abbott S, Barnard RC, Jarvis CI, Kucharski AJ, Munday JD, et al. Estimated transmissibility and impact of SARS-CoV-2 lineage B.1.1.7 in England. Science 2021a; 372: eabg3055.
4. Galloway SE, Paul P, MacCannell DR, Johansson MA, Brooks JT, MacNeil A, et al. Emergence of SARS-CoV-2 B.1.1.7 lineage United States, December 29, 2020 January 12, 2021. MMWR Mob Mortal Wkly Rep 2021; 70: 95–9.
5. Tegally H, Wilkinson E, Giovanetti M, Iranzadeh A, Fonseca V, Giandhari J, et al. Emergence and rapid spread of a new severe acute respiratory syndrome-related coronavirus 2 (SARS-CoV-2) lineage with multiple spike mutations in South Africa. medRxiv preprint 2020.https://doi.org/10.1101/2020.12.21.20248640.
6. Fujino T, Nomoto H, Kutsuna S, Ujiie M, Suzuki T, Sato R, et al.
Novel SARS-CoV-2 variant identified in travelers from Brazil to Japan. Emerg Infect Dis 2021; 27: 1243–5.
7. Cherian S, Potdar V, Jadhav S, Yadav P, Gupta N, Das M, et al.
Convergent evolution of SARS-CoV-2 spike mutations, L452R, E484Q and P681R, in the second wave of COVID-19 in Mahara- shtra, India, bioRxiv preprint; 2021. https://doi.org/10.1101/2021.
04.22.440932.
8. Sabino EC, Buss LF, Carvalho MPS, Prete CA, Jr, Crispim MAE, Fraiji NA, et al. Resurgence of COVID-19 in Manaus, Brazil, despite high seroprevalence. Lancet 2021; 397: 452–5.
9. Volz E, Mishra S, Chand M, Barrett JC, Johnson R, Geidelberg L, et al. Assessing transmissibility of SARS-CoV-2 lineage B.1.1.7 in England. Nature 2021. to appear.https://doi.org/10.1038/s41586- 021-03470-x.
10. Ulgen A, Cetin S, Balci PO, Sivgin H, Cetin M, Li W. COVID-10 outpatients and surviving inpatients exhibit comparable blood test results that are distinct from non-surviving inpatients. J Health Sci Med 2021; 4(3): 306–13.
11. Ioannidis JPA. The proposal to lower P value thresholds to .005.
JAMA 2018; 319: 1429–30.
12. Colquhoun D. The reproducibility of research and the misinter- pretation of p-values. Royal Soc. Open Sci. 2017; 4: 171085.
13. Wasserstein RL, Schirm AL, Lazar NA. Moving to a world beyond p<0.05. Am Stat 2019; 73: 1–19.
14. Li W, Shih A, Freudenberg-Hua Y, Fury W, Yang Y. Beyond standard pipeline and p < 0.05 in pathway enrichment analyses.
Comp Biol Chem 2021; 92: 107455.
15. Cetin S, Ulgen A, Balci PO, Sivgin H, Cetin M, Sivgin S, et al. Survival analyses of COVID-19 patients in a Turkish cohort: comparison be- tween using time to death and time to release. Scimed J 2021; 3: 1–9.
16. Cetin S, Ulgen A, Sivgin H, Li W. Approximate reciprocal rela- tionship between two cause- specific hazard ratios in COVID-19 data with mutually exclusive events. medRxiv preprint 2021.
https://doi.org/10.1101/2021.04.22.21255955.
17. Cetin S, Ulgen A, Sivgin H, Li W. A study on factors impacting length of hospital stay of COVID-19 inpatients. J Contemp Med 2021; 11(3): 396–404.
18. Taubenberger JK, Morens DM. 1918 influenza: the mother of all pandemics. Emerg Infect Dis 2006; 12: 15–22.
19. Tumpey TM, Basler CF, Aguilar PV, Zeng H, Solorzano A. Char- acterization of the reconstructed 1918 Spanish influenza pandemic virus. Science 2005; 310: 77–80.
20. Taubenberger JK, Reid AH, Lourens RM, Wang R, Jin G, Fanning TG. Characterization of the 1918 influenza virus polymerase genes.
Nature 2005; 437: 889–93.
21. Barry JM, Viboud C, Simonsen L. Cross-protection between suc- cessive waves of the 19181919 influenza pandemic: epidemiological evidence from US Army Camps and from Britain. J Infect Dis 2008;
198: 1427–34.
22. Challe R, Brooks-Pollock E, Read JM, Dyson L, Tsaneva-Atanasova K, Danon L. Risk of mortality in patients infected with SARS-CoV- 2 variant of concern 202012/1: matched cohort study. BMJ 2021;
372: n579.
23. Davies NG, Jarvis CI, CMMID COVID-19 Working Group, Edmunds WJ, Jewell NP, Diaz-Ordaz K, et al. Increased mortality in community-tested cases of SARS-CoV-2 lineage B.1.1.7.
Nature 2021b. to appear. https://doi.org/10.1038/s41586-021- 03426-1.
24. Grint DJ, Wing K, Williamson E, McDonald HI, Bhaskaran K, Evans D, et al. Case fatality risk of the SARS-CoV-2 variant of concern B.1.1.7 in England, 16 November to 5 February. Eurosurveilance 2021;
26(11).https://doi.org/10.2807/1560-7917.ES.2021.26.11.2100256.
25. Nyberg T, Twohig KA, Harris RJ, Seaman SR, Flannagan J, Allen H, et al. Increased risk of hospitalisation for COVID-19 patients infected with SARS-CoV- 2 variant B.1.1.7. arXiv preprint 2021.
arXiv:2104.05560v1.
26. Nyberg T, Twohig KA, Harris RJ, Seaman SR, Flannagan J, Allen H, et al. Risk of hospital admission for patients with SARS-CoV-2 variant B.1.1.7: cohort analysis. BMJ 2021; 373: n1412.https://doi.
org/10.1136/bmj.n1412.