University of Pannonia Department of Physical Chemistry
Prediction of Phase Equilibrium Properties from Capillary Column Gas-chromatographic Retention Data
Ph.D. Dissertation Kresz Richárd
Supervisor Dr. Dallos András
University of Pannonia, Chemical Sciences Doctoral Course
Table of contents
Tézisek ... 4
1. Introduction ... 6
2. Literature review ... 8
2.1. Techniques for measurement of different phase equilibrium data... 8
2.2. The characterisation of gas-liquid and liquid-liquid phase equilibrium ... 11
2.2.1 The distribution in chromatography... 11
2.2.2 Applying capillary column GC ... 13
2.3 The determination method of “interaction-parameters” by gas-chromatography... 15
3 Experimental part ... 17
3.1 Apparatus ... 17
3.2 Making and testing capillary columns ... 18
3.2.1 Validation of the GC capillary measuring system... 20
3.2.2 Accuracy... 21
3.2.3 Precision ... 21
4 Results and discussion... 26
4.2 Wrong gas/liquid partition data by gas chromatography ... 26
4.2.1 Identification and correction of the wrong data on the paraffin C78... 27
4.2.2 The best n-alkane data on the branched paraffins C78 and C87... 28
4.2.3 Corrected partition data in the polar derivatives of the paraffin C78... 30
4.3 Column selection for predictions ... 30
4.3.1 Rank correlation ... 31
4.3.2 Principal Component Analysis... 32
4.3.3 Cluster Analysis ... 33
4.4 Prediction of Phase Equilibrium data using LSER equations and comparison the results with COSMO-RS ... 34
4.4.1 Correlation of normal boiling point data with molecular descriptors ... 36
4.4.2 Correlation of vapour pressure with molecular descriptors ... 38
4.4.3 Correlation of logKow with molecular descriptors ... 39
4.4.4 Correlation of Henry-constant with molecular descriptors ... 41
4.4.5 Correlation of water solubility data with molecular descriptors ... 43
4.4.6 Correlation of Koc data with different molecular descriptors... 45
4.4.7 Correlation of olive oil/gas partition coefficients (Lo/g) with the GC and COSMO molecular descriptors ... 46
4.5. Validation of correlation equations... 48
5. List of symbols ... 52
6. Literature ... 56
7. Theses... 60
7.1. Theses... 60
8 Publications ... 62
9 Curriculum Vitae... 65
10. Supplementary part ... 66
Prediction of Phase Equilibrium Properties from Capillary Column Gas-chromatographic Retention Data
Értekezés doktori (PhD) fokozat elnyerése érdekében a Pannon Egyetem…Kémia Tudományok
Doktori Iskolájához tartozóan.
Írta:
Kresz Richárd
Készült a Veszprémi Egyetem Kémia Tudományok Doktori iskolája keretében Témavezető: Dr. Dallos András
Elfogadásra javaslom (igen / nem)
(aláírás) A jelölt a doktori szigorlaton …... % -ot ért el,
Az értekezést bírálóként elfogadásra javaslom:
Bíráló neve: …... …... igen /nem
……….
(aláírás) Bíráló neve: …... …...) igen /nem
……….
(aláírás) ***Bíráló neve: …... …...) igen /nem
……….
(aláírás) A jelölt az értekezés nyilvános vitáján …...% - ot ért el
Veszprém, ……….
a Bíráló Bizottság elnöke A doktori (PhD) oklevél minősítése…...
………
Az EDT elnöke
Tézisek 1. Az irodalmi adatok kritikai feldolgozása
1.1 Az elágazó láncú szénhidrogén (C78) vázú állófázis család töltött oszlopos GC-vel mért és publikált retenciós jellemzőit kiértékeltem és az irodalmi adatok belső konzisztencia vizsgálata során megállapítottam, hogy a közölt adatok hibásak: a Kováts-indexek és a gSPOT adatok hőmérséklet függését leíró egyenletekből számított értékek nincsenek összhangban egymással.
1.2 Kimutattam, hogy a n-alkánok gSPOT értékei hőmérséklet függésének leírására publikált Kirchhoff-paraméterek hibásak, ezért módszert dolgoztam ki retenciós index alapú újraszámolásukra.
2 Új, hiánypótló mérési eredmények és elemzésük
2.1 Kapilláris gázkromatográfián (GC) alapuló fázisegyensúly-mérő módszert fejlesztettem ki abszolút (standard kémiai potenciál különbség, gSPOT) retenciós jellemzők relatív (retenciós index) retenciós adatok alapján történő meghatározására.
2.2 Kapilláris gázkromatográfiás módszer alkalmazásával, több állófázison (C78, POH, PSH, MTF, MOX, PCN) újra megmértem a Kováts Ervin professzor munkatársai által korábban töltött oszlopos GC-vel vizsgált vegyületek retenciós indexeit és megállapítottam, hogy a töltött oszlopon mért és publikált, valamint a kapilláris oszlopon meghatározott indexek jól egyeznek egymással.
2.3 Validálási eljárással minősítettem a kapilláris GC fázisegyensúly-mérő módszert és megállapítottam, hogy az alkalmas megbízható, 1% relatív standard deviációnál kisebb hibájú mérési eredmények szolgáltatására.
2.4 Meghatároztam 213 szerves vegyület retenciós Kováts-indexét több hőmérsékleten a 100-180 °C hőmérséklet intervallumban a C78 állófázis család tagjain (POH, PSH, MTF, MOX, PCN), jelentősen kiterjesztve a korábban ismert, publikált, töltött oszlopos GC-vel mért adatbázist. Egyváltozós polinomiális regresszióval meghatároztam a Kováts-indexek hőmérséklet függését leíró másodfokú T-polinomok együtthatóit.
2.5 A retenciós indexekből a n-alkánok általam korrigált abszolút retenciós jellemzőinek felhasználásával a folyadék-gáz fázisátmenetre jellemző standard kémiai potenciál
különbségeket számítottam és meghatároztam a gSPOT adatok hőmérséklet függését leíró Kirchhoff egyenlet paramétereit, az oldási folyamatra jellemző standard entalpia, entrópia és izobár moláris hőkapacitás változását.
3 Javaslat új, gSPOT-alapú oldási paraméterekre
3.1 Főkomponens analízist, rank-korrelációs tesztet és klaszter analízist alkalmazva elvégeztem az irodalmi, töltött oszlopos GC-vel maghatározott gSPOT értékek kemometriai vizsgálatát. Megállapítottam, hogy az apoláris C78 állófázison mért gSPOT értékek szignifikánsan különböznek a poláris állófázisokon (POH, PSH, MTF, MOX, PCN) meghatározott adatoktól, ellenben a poláris állófázisokon mért gSPOT adatok között nagyon szoros a korreláció, azaz hasonló intermolekuláris kölcsönhatásokat mérnek.
3.2 Megállapítottam, hogy a C78 állófázis család tagjain mért gSPOT értékek – intermolekuláris kölcsönhatások speciális mérőszámaként, új molekuláris jellemző paraméterként –, felhasználhatók LSER típusú korrelációs egyenletek független változóiként.
3.3 Megállapítottam, hogy a poláris állófázisokon mért gSPOT értékek közül elegendő egyet, a ∆µPOH -t felhasználni a polaritással és a hidrogénkötési hajlammal kapcsolatos intermolekuláris kölcsönhatások jellemző oldási paramétereként, a diszperziós kölcsönhatásokra jellemző ∆µC78 paraméter kiegészítésére.
3.4 Kétváltozós lineáris regresszióval kimutattam, hogy a ∆µC78 és ∆µPOH oldási paraméter-páros jól korrelál számos, nagy gyakorlati jelentőségű fázisegyensúlyi jellemzővel (gőznyomás, normális forráspont, logKo/w, vízoldhatóság, a víz/levegő megoszlási Henry-állandó, Koc, oliva-olaj/levegő megoszlási hányados).
3.5 Megállapítottam, hogy a csökkentett számú tesztvegyület felhasználásával felállított, a
78
µC
∆ és ∆µPOH oldási paraméter-párost alkalmazó LSER típusú korrelációs egyenletek becslési tulajdonságai kiválóak, segítségükkel a nagy gyakorlati jelentőségű, ökotoxikológia fázisegyensúlyi jellemzők (gőznyomás, normális forráspont, logKo/w, vízoldhatóság, a víz/levegő megoszlási Henry-állandó, Koc, oliva-olaj/levegő megoszlási hányados). várható értékei elfogadható pontossággal jelezhetők előre.
1. Introduction
The accurate and fast determination or estimation of phase equilibrium data such as octanol/water partition coefficient, Henry-coefficient, water solubility etc. are very important in many respects, especially in the risk assessment.
Figure 1.1 Important physicochemical properties, their interrelationships, and their uses in risk assessment
There are many situations like phase equilibria in complex matrices − olive oil/gas partition coefficient − or the design of drugs where the determination of these properties is difficult. In such case the prediction of these data from other measured physicochemical properties, is possible.
Because easy to use and the reproducibility of the measurements is excellent, the chromatography is preferred to obtain properties to characterize the behaviour of solute compounds in different solvent systems. Nowadays, one of the most used models is Abraham’s Solvation Parameter Model [1]. Abraham and co-workers recommended different solute descriptors to characterize solvation properties using LSER (Linear Solvation Energy Relationship) equations. Gas/liquid and liquid/liquid chromatography are used to determine these descriptors. For the determination of descriptors several stationary phases from a numerous commercial used stationary phases were selected, which can represent these parameters [2-10]. But there is one stationary phase family, which was not investigated so far.
E. sz. Kováts and co-workers synthesized a family of nearly isochor solvents a branched hydrocarbon as non-polar solvent (C78H158) and its polar derivatives (Figure 2.). It is seen that
Estimate vapour pressure Boiling Point
Estimate Henry’s law
constant
Estimate Water Solubility
Octanol/Water Partition Coefficient
( Kow, P ) Melting Point
Estimate Soil/Sorption Coefficient
( Koc )
Estimate Concentration
in Air
Estimate Concentration
in Water
Estimate Adsorption Through Skin
Estimate bioconcentracion
Estimate Inhalation Explosure
Estimate Volatilization
From Water
Estimate Removal from Wastewater Threatment
Estimate Toxicity
Estimate Migration Through Soil into Groundwater
Estimate Risk to Human Health and the Environment
the structure of the polar phases in the C78 family are the same but one or more groups are substituted by an other functional group (Table 1) like –OH, –SH, –CN etc. to represent different intermolecular interactions.
R2 X R1
R2 R2
Figure 1.2 Structure of the applied stationary phases
Table 1.1 The interacting groups
Polar interacting group(s) R1 R2 X Ref.
C78 – CH2CH3 CH2CH3 H [11,12]
PCl Primary chloro CH2Cl CH2CH3 H [11]
MTF Monotrifluoromethyl CH2CF3 CH2CH3 H [13]
TTF Tetrakistrifluoromethyl CH2CF3 CH2CF3 H [13]
TMO Tetramethoxy OCH3 OCH3 H [14]
PCN Primary cyano CH2CN CH2CH3 H [14]
PSH Primary thiol CH2SH CH2CH3 H [14]
POH Primary alcohol CH2OH CH2CH3 H [12]
SOH Secondary alcohol CH3 CH2CH3 OH [15]
Kováts and co-workers applied these solvents in packed column chromatography system as stationary phases. This technique has the advantage, that the exact amount of the stationary phase in the column is known. By using capillary column GC system, the exact amount of the dynamically covered stationary phase is not known. However the capillary column GC system technique is faster than the packed column, and a not negligible advantage of fused silica capillary columns is the more inert solid surface [16].
To calculate any thermodynamic parameter of partitioning of solutes using capillary column GC the problem of “unknown” amount of stationary phase in capillary columns has to be solved. The key for the solution of the problem is the knowledge of the absolute retention data eq. ∆µ, standard chemical potential differences (gSPOT) ─ of n-alkanes. Applying the absolute retention data obtained on packed column GC with the same stationary phases [11- 15] one can calculate the absolute retention data of any other solutes, for which relative
accurate correlations for prediction of different phase equilibrium data using molecular descriptors obtained by capillary gas chromatography.
Therefore we selected different stationary phases from the Kováts solvent family using chemometric methods like Principal Component Analysis, CLUSTER analysis and Rank- correlation. We prepared new capillary columns covering them with the selected phases dynamically. We tested our measuring system in chemometric respect. We determined absolute retention data of 213 organic compounds and fragrances at different temperatures using the absolute retention data of n-alkanes. With the new retention data set we estimated other important phase equilibrium properties − logP, boiling point, ethanol/gas partition coeff., water solubility − and compared them to data obtained from other prediction method like COSMO.
2. Literature review
2.1. Techniques for measurement of different phase equilibrium data
The classical measuring method to obtain octanol/water partition coefficient, Ko/w is the
“shake-flask” method [17]. In this method the test chemical is mixed with an n-octanol/water liquid system and shaken for some given period during which equilibrium between both phases is achieved. After the phases separate, the concentrations of the test chemical in the octanol and water phase are determined. The “slow-stir” method similar to the „shake-flask”
but differs in that the octanol and water phases are equilibrated using slow stirring. The major point of the shake-flask method is that it is a direct method measuring without approximation the liquid–liquid partition coefficient of the solute in the biphasic liquid system. The weak point is its limited range that is depending on the method used to analyse the phases because the very low concentration obtained at equilibrium in one phase may be below the limit of detection of many analytical methods. The other method for determining Ko/w is the generator column technique. In this method the column is packed with a support and is saturated with a fixed concentration of the test substance in n-octanol. The test substance is eluted from the octanol-saturated generator column with water. The use of liquid chromatographic (HPLC) methods using standards and correlations is the most widespread way to measure rapidly
liquid–liquid partition coefficients. It is extremely simple: the logarithms of the retention factor of the solutes are linearly correlated with the logarithm of their partition coefficients as first described by Collander [18]:
b k a
KD = log +
log [2.1]
These two most common method –„shake-flask, generator column– are used for the experimental determination of water solubility (WS) too. If we use these determination ways we have to consider the advantages and disadvantages. The next table shows shortly these instructions for use. Table 2 shows the advantages and disadvantages of the methods mentioned above.
Method Advantages Disadvantages Ref.
Shake-Flask
Easy to use. Reliable for substances that have log Ko/w values < 4.5.
Doesn't require expensive equipment.
Generally not useful for measuring K values for substances having log Ko/w values>4.5;
shaking may form micro- emulsions, which lead to inaccurate measurement.
[17,19]
Slow-Stir
Easy to use. Relatively fast, doesn't require expensive equipment. Reliable for essentially all substances.
Requires careful stirring and close temperature control to avoid formation of micro- emulsions.
[20,21]
Generator Column
Reliable essentially for all substances. Avoids
formation of micro- emulsions.
Requires expensive equipment.
[22-24]
Table 2.1 Methods of measuring partition coefficient
A useful method for vapour pressure (VP) determination is the isoteniscope technique. It is a standardized procedure applicable for pure liquids with vapour pressure of 0.75 to 750 Hgmm.
Table 3 shows the direct and indirect techniques used today to measure vapour pressure of liquids.
Method Ref. Range of vapour pressure / Pa Gas saturation [25] 10-8 to 104
Effusion [27] 10-5 to 10-1
Manometry [27-36] 1 to 105
GL solute retention [33-36] 10-8 to 10-1 GLC solvent evaporation [37] 10-5 to 10-2 Relative volatilisation [38,39] 10-5 to 10-1
Table2.2 Method for the determination of vapour pressure of liquids
The Henry coefficient, h’, is often calculated from vapour pressure and water solubility data that are measured independently. This method may not be accurate for substances with water solubilities exceeding few percent but it is considered to be satisfactory for less soluble substances [40].
Normal Boiling point, NBP, is not measurable easily. There are several methods − for example ebulliometric or dynamic method − to determine NBP data of compounds. However, these methods need very pure compounds with thermal stability.
Because the exact values of these phase equilibrium data are very important and the determinations of these partition coefficients simultaneously or rapidly are impossible or expensive, other methods or models were proposed for this purpose. The experimental data set was the basis for developing techniques to estimate these properties. Most of the phase equilibrium estimation methods are based upon one or more of the following approaches:
• Fragment or substituent additivity [41,42]
• Correlations with capacity factors on reversed-phase HPLC [43-49]
• Correlations with descriptors for molecular volume or shape [22,47,50]
• Correlations with molar volume, solvatochromatic (thermodynamic) parameters, or charge transfer interactions [51-54]
The GLC techniques offer great advantages of speed, small sample size, purity, stability and reproducibility to determine a range of physicochemical properties.
.
2.2. The characterisation of gas-liquid and liquid-liquid phase equilibrium
2.2.1 The distribution in chromatography
The distribution of analytes A between phases can often be described quite simply:
A
mobile⇔A
stationary [2.2]The distribution coefficient, KD,j is defined as the concentration of the analyte in the stationary phase divided by the concentration of the analyte in the mobile phase. Classical thermodynamics provides an expression that describes the change in free energy of a solute when transferring from one phase to the other as a function of the equilibrium constant (distribution coefficient). The expression is as follows:
i i
D G
K
RTln , =−∆ [2.3]
The distribution equilibrium at a given temperature may be characterized by the following coefficients:
• Henry coefficient
• Ostwald coefficient
• Molal Ostwald coefficient
• Molal Henry coefficient
• Molar Henry coefficient
We can calculate g-SPOT-s related to any of the distribution coefficients, which will be the difference of the standard chemical potential, SPOT, between equilibrium and standard states.
The g-SPOT related to the molal Henry coefficient, g, is given by:
(
( / ) 1)
sv†
† )
(
/ ln ln = ln / −
−
=
∆ RT g barkgmol
m RT P m
RT Psv isv g
i g i
sv i
g µ (Jmol−1) [2.4]
Using these g-SPOT data at different temperature we are able to fit the parameters of Kirchhoff-approximation:
)) ln(
( † †
/ , /
/ /
T T T T T C S
T
Hisv g g isv g g Psvig
g g sv i
g∆µ = ∆ − ∆ + ∆ − − [2.5]
The parameters of the Kirchhoff-approximation are the following:
- g∆Hisv/g is the enthalpy of dissolution of the solute in solvent.
- g∆Ssv/g is the difference of the molar entropy of the solute between the two phases.
- g∆CPsv,i/g is partial molar heat capacity difference of the solute in the two phases at constant temperature.
Using these g-SPOT data as “interaction parameters” of solvents we are able to do correlations for other physicochemical data. The g-SPOT as a function of temperature is illustrated in Fig3.
Figure 2.1 A typical example of temperature dependence of g-SPOT
In gas-chromatography where retention is made by absorption only, the retention volume, )
( 3
, cm
VRi , is related to the Ostwald coefficient as follows:
) ( )
( 3 (,/ ) 3
, cm V V K cm
VRi = µ + sp Dsvi g [2.6]
where, Vspis the volume of stationary phase (non volatile solvent in the column) and Vµ, is the “hold-up volume”. Latter volume is measured by injection of a gas (Neon) insoluble in stationary phase. The net retention volume is defined as:
) / (
, ,
,
g sv
i D sp i
R i
N V V V K
V = − µ = [2.7]
The specific retention volume is defined as:
) / (
, , ,
g sv
i D sp
i N i g
V V κ
ϖ =
= , [2.8]
where ϖsp is the amount of the stationary phase in grams.
Because the
RT gisv g
g sv
i
D(,/ ) ( / ) =
κ [2.9]
) / 1000 (
3 ,
) /
( cm kg
V g RT
i g g
sv
i = [2.10]
[
g /(atm kg mol )]
RTln
∆µi = (sv/gi −1 [2.11]
Now we are able to calculate g-SPOT data from specific retention volume. For the calculation of Vg,i we have to know the mean flow rate of the carrier gas in the column, Φ(mc ). The determination of net retention time is not a problem and the mean flow rate is related to the measured flow rate,Φfl[55].
Knowing this data the net retention volume is given by:
) ( , ,
m c i N i
N t
V = Φ where tN,i =tR,i −tR,Ne the net retention time.
2.2.2 Applying capillary column GC
The measurement of gas–liquid partition data of polar solutes by GLC using columns with porous particles in packed beds is fraught with problems of interfacial adsorption at the liquid–solid and gas–solid interfaces [56,57]. The application of fused-silica open tubular capillary columns can decrease the undesirable effects in packed columns like interfacial adsorption at interfaces moreover highly loaded packed columns [58] have the disadvantages of long retention times and therefore a limited applicability for heavy volatile compounds.
Defayes et al. have shown with an Apolane stationary phase (C87H176) that the effect of adsorption at the liquid-gas interface can be negligible in even on packed columns. However, this opinion is not generally accepted and Weckwerth et al. [59] found an influence of adsorption on retention of strongly polar compounds on packed column. Mutelet and Rogalski [60] used packed and capillary columns wetted by long chain branched alkanes to establish relationships between corresponding partition coefficients and logL16. They have found that selecting an appropriate support material could reduce the adsorption on the surface of the support. To sum up, the adsorption at the support-wall interface is not generally important for well-deactivated support-walls when normal to thick film are employed [61].
Gas-liquid partitioning is the dominant retention mechanism for nearly all solutes and for solutes retained by mixed retention mechanism. The liquid-interfacial adsorption is
- in case of the thin films, - at low temperatures,
- for solutes of significantly different polarity to the stationary phase.
Applying fused silica open tubular capillary columns retention times are short and precisely measurable, therefore the application domain of the chromatography can be extended using capillaries for the determination of gas–liquid equilibrium of less volatile solutes. Because the measurement of the amount of the stationary phase in the capillaries is difficult, several authors have suggested indirect ways to estimate specific retention volumes from capillary columns, either using n-hexane as a standard solute with partition data measured on packed column [62], or calculating the mass of the stationary phase from specific retention volumes obtained on packed column [63,64]. One of the most useful method is based on the retention index obtained on capillary column wetted by the same stationary phase as in packed column.
The retention index for a solute, Ij, was evaluated by Eq. (2.12), using its adjusted retention time (tR',j) and the adjusted retention times (tR',z,tR',z+1) of n-alkanes with carbon numbers z and z+1eluted before and after the solute on the capillary column under isothermal condition.
t z t
t I t
z R z
R
z R j R
i 100
lg lg
lg
100 lg '
, '
1 ,
' , '
, +
−
= −
+
(tR',z ≤ t'R,j ≤ t'R,z+1) [2.12]
In this case the specific retention volume of the solute (Vg,i) can be calculated by Eq. (2.13) using the absolute retention data for n-alkanes obtained on packed column.
( )(
gz gz)
gzsv i i
g I z V V V
V , ( ) /100 ln , 1 ln , ln ,
ln = − + − + . [2.13]
In equation 2.13 Vg,z, and Vg,z+1 were determined by packed column GC. The retention indices of solutes determined by capillary column GC applicable for calculation of specific retention volume of solutes using published g-SPOT data of n-alkanes, which were taken from a literature [11-15].
2.3 The determination method of “interaction-parameters” by gas-chromatography
Partition coefficients at infinite dilution are often described using quantitative structure-activity relationship (QSAR), e.g. the linear solvation energy relationship (LSER) method of Kamlet and co-workers [65-70]. The excess Gibbs energy is often separated into several contributions, which comprise the results from different phenomena, such as volume effects, dipole–dipole interactions, etc. Therefore, the logarithm of the activity coefficient as well as the logarithm of the partition coefficient at infinite dilution is also sums of such contributions:
∑
∞ =
k ow
k i ow
i A
K , ,
log [2.14]
In linear solvation energy relationship methods it is common practice to express each contribution Aiow,k as the product of a solute property and a parameter, which characterizes the solvent system. The LSER method of Kamlet et al. requires five parameters for the characterisation of a solute, i:
• Volume parameter, νi
• Polarity parameter, πi
• Parameter for the polarizability, δi
• Basicity parameter, βi
• Acidity parameter, αi
The resulting expression for the partition coefficient at infinite dilution becomes:
i i i i i ow
i K M S D B A
K ,∞ = + ν + π + δ + β + α
log [2.15]
Where K, M, S, D, B and A are dimensionless parameters, which characterise the solvent system at a given temperature.
Michael H. Abraham used two different equations for describing solute transfer between two condensed phase (eq.2.16) and solute transfer from the gas phase into a condensed phase (eq.
2.17):
vV bB aA sS eE c
SP = + + + + +
log [2.16]
lL bB aA sS eE c
SP = + + + + +
log [2.17]
Where SP is the solute property, V is a McGowan volume of the solute and L the solute’s logarithmic n-hexadecane-air partition coefficient at 298.15 K. One of the most useful solute
difficulties arise, when L16 of compounds is to be measured, which are less volatile than n- hexadecane. Therefore, it is recommended to determine partition data by GC at higher temperatures using non-volatile paraffin stationary phases (C78) and then extrapolates them to the ambient temperature and/or to volatile alkane solvents [2-4]. Furthermore, Weckwerth et al. [59]
suggested that gas-Apolane 87 partition coefficients, L87, might substitute the gas-liquid n- hexadecane partition coefficients in general LSER equations, because the measurement of L87 at elevated temperature is much simpler than the measurement of L16 at 298 K. Furthermore, several solute descriptors used usually in LSERs do not have thermodynamic relevance, at all.
Hence, there is a strong need to define all other molecular descriptors, which reflect the polar–
type and specific molecular interactions, or their combination, also as free enthalpy parameters related to gas-liquid partition of non-volatile solvents having dipolar and H-bond donor/acceptor atomic groups. Laffort et al. [71] generated their own GLC retention data on five stationary phases and obtained the five solute factors for 240 compounds. Laffort and co-workers [71,72] used the solute factors to correlate a number of physicochemical and biochemical properties. In general the solute factors have not been widely used, although Voelkel and Janas [73] characterized a number of GLC stationary phases in this way.
Table 2.3 The five stationary phases used by Laffort et al. [70,71]
No. Phase Z Zonyl E7 C Carbowax 1000
T Tricyanoethoxypropane P Polyphenyl ether (6 rings) D Diethylene glycol succinate
Laffort and co-workers [74] tested several published data and approaches in the field of solubility and solvation parameters. They used a new set of optimised values for 133 solutes – which solutes were published by E. Kováts – and 314 values published by M. H. Abraham. In our project we applied these 160 solutes and a few perfume compounds for our LSER like correlations describing different phase equilibrium properties.
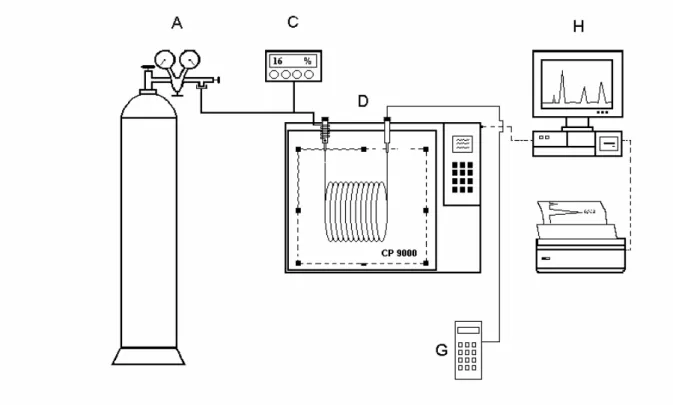
3 Experimental part 3.1 Apparatus
A modified CP 9000 (Chrompack) gas chromatograph equipped with flame ionisation detectors (FID, see letter D) was used for determination of retention times of the solutes. The measuring method and devices were described previously [75].
Figure 3.1 The schematic picture of gas chromatograph
The temperature in the oven was measured with a platinum sensor (100 Ω, DIN 43710) and a model S 1221 measuring device from Systemteknik to better than ± 0.05 K. The helium carrier gas flow (6.0, Messer Griesheim) was controlled by a precision pressure regulator (A) (Model DLRS No.7, L’Air Liquide), which attached in series with a flow controller (Model 5850 EM, Brooks (C)).
The column dead time was determined by methane injected together with each sample after correction as recommended by Riedo et al. [76] the dead time is given by:
−t t
where tC1 and tC5 are the gross retention time of methane and pentane measured on capillary column, and τC5/C1 is the relative retention of pentane with respect to methane measured on packed column. The FID signals were collected and evaluated by data acquisition software Chromeleon (Dionex, Sunnyvale CA).
3.2 Making and testing capillary columns
The capillary columns were prepared in the laboratory of Prof. Zoltán Juvancz ( VITUKI Ltd.). The raw – untreated fused silica open tubular – capillary columns with 0.25 mm inside diameter were delivered by Polymicro Technologies Inc., Phoenix AZ, USA. The surface of the capillary column was first treated thermally after the column was wetted with water dynamically using inert gas. In the next step we closed both end of the column and heated it during two ours at 250 oC. After thermal operation the column was deactivated with (dimethylamino)-dimethyl-(octadecyl)-silane in hydrogen flow at 520 K. After rinsing with n- hexane the column coated by the dynamic method with C78 and POH yielded a film-thickness about of 0.3 µm. The film thickness was calculated from the retention time of n-decane using the absolute retention data of n-decane measured on packed column GC [77]. The calculation of film thickness and the mass of stationary phase in the treated fused silica columns supposes that the absolute retention volumes of n-alkanes are constant obtained on packed column as well as on capillary column gas chromatography. The first step was the calculation of the gSPOT data of n-decane at 130 oC from published Kirchhoff-parameters obtained with packed column gas chromatography. From the gSPOT data of n-decane we calculated the absolute retention volume of the n-decane, applying equations 2.10 and 2.11. With knowledge of the retention volume obtained on capillary column GC and the absolute retention volume of n-decane obtained on packed column GC and the density of the stationary phases, the film thickness,dsf ,is calculable using the following equations.
pc g
cc N
sf V
m V
,
= , [3.2]
where msf is the mass of the stationary phase.
sf c id c
sf
f L
d m
ρ πΦ ,
= [3.3]
where Lc is the length of the column, Φid,c is the inlet diameter of the column and ρsf is the density of the stationary phase. The film thickness with C78 wetted capillary column was 0.28 µm and with POH wetted column was 0.31µm.
For testing the columns a series of molecular probes of varying polarity were selected. The solutes were evaporated in a methane atmosphere and 0.1 µl samples of these vapour mixtures were injected onto the capillary column. We used effluent splitter liner with a split ratio about of 1:10.
The test procedure contains the comparison of measured retention indices measured by capillary GC at 130 oC to those obtained by packed column GC on the same stationary phases.
A comparison of the data measured on capillary and packed columns (Figure 3.2 ) shows that the retention values obtained on both type of columns agreed well.
Index (packed column)
650 700 750 800 850 900 950
Index (capillary column)
650 700 750 800 850 900 950
C78 stationary phase POH stationary phase
Figure 3.2 Comparison of retention indices
3.2.1 Validation of the GC capillary measuring system
The system was tested injecting 10 times 1-chloro-alkanes as test sample at different temperatures. The measure of goodness was the percentage relative standard deviation of the retention index differences of the probes. The standard deviation – see equation 3.4 – is the measure of how precise the average is, how well the individual values agree with each other.
It is the measure of random error. This type of error people can’t be controlled very well.
1 ) . (
.
2
−
= − n
x D x
S i [3.4]
The relative standard deviation (RSD) is often more convenient. It is obtained by multiplying the standard deviation by 100 and dividing this product by the average. RSD can be expressed as a percentage, parts per thousand, etc.
x D V S
C D S
R 100 . .
%) . .(
.
. = [3.5]
We took the precision and accuracy into consideration by testing the capillary columns because the exactness is composed of precision and accuracy of the mean together. Accuracy of an analytical method is the extent to which test results generated by the method and the true value agree. One alternative is to compare results of the method with results from an established reference method. Precision is the measure of how close the data values are to each other for a number of measurements under the same analytical conditions. Figure 3.3 illustrates the difference between accuracy and precision.
Figure 3.3 Accuracy and precision Precise, not accurate
Accurate, not precise
Neither accurate nor precise
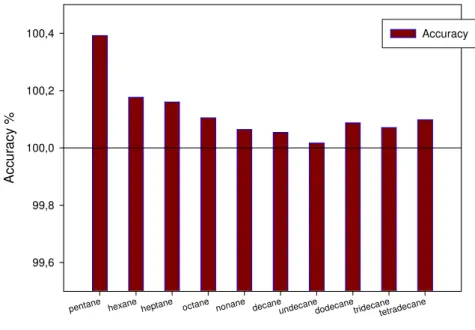
3.2.2 Accuracy
In our case, accuracy of the system was tested by applying the definition the Kováts- retention index of n-alkanes as reference. Alkane homologues (C5-14)were injected in rapid succession 6 times afterwards retention indices were calculated for the test compounds and compared them to the reference value as it can be see Figure 3.4.
pentane hexane
heptane octane nonane decane
undecanedodecanetridecane tetradecane
Accuracy %
99,6 99,8 100,0 100,2
100,4 Accuracy
Figure 3.4 Accuracy test
It can be seen that the measured retention indices are very close to the theoretical values and the trueness of the determination is very high.
3.2.3 Precision
The precision of a method is the extent to which the individual test results of multiple injections of a series of standards agree. The measured standard deviation can be subdivided into three categories:
• Repeatability (same material, same sample by same observers in small time intervals)
• Intermediate precision and
• Reproducibility (same material, same sample by different observers with different equipments)
Repeatability is obtained when, the analysis is carried out in one laboratory by one operator using one piece of equipment over a relatively short time span. At least
• 5 or 6 determinations of
• three different matrices at
• two or three different concentrations
should be done and the relative standard deviation calculated.
First, we tested the calculation method of Kováts-indices. There are many ways to calculate retention indices of solutes. The most common method is based on the use of the retention times of n-alkanes with carbon number z and z+1 eluted before and after the solute on the capillary column under isothermal condition. The second method applies the absolute retention data of standard alkanes (e.g. n-decane or n-tetradecane). The next picture shows the results of precision tests using different calculation methods of retention indices.
1-chloropentane 1-chlorohexane
1-chloro heptane 1-chlorooctane
1-chlorononane 1-chlorodecane
1-chloroundecane
R.S.D
0,0 0,2 0,4 0,6 0,8 1,0 1,2 1,4
n-alkanes C10 standard C14 standard
Figure 3.5 Comparison of calculation methods of retention indices
The next figure shows the repeatability test comparing R.S.D values of indices obtained at different days by different operators. Every operator were injected more than 10 paralell probes at every day. From these injections the relative standard deviations of retention indices of chloro-alkanes were calculated.
1-chloropentane 1-chlorohexane
1-chloroheptane 1-chlorooctane
1-chlorononane 1-chlorodecane
1-chloroundecane
R.S.D. (C.V.%)
0,00 0,02 0,04 0,06 0,08 0,10 0,12 0,14 0,16 0,18
2002-02-19 2002-02-20 2002-02-27 2002-06-18
Figure 3.6 Repeatability at different days
1-chloropentane 1-chlorohexane
1-chloroheptane 1-chlorooctane
1-chlorononane 1-chlorodecane
1-chloroundecane
R.S.D. (C.V.%)
0,0 0,2 0,4 0,6 0,8 1,0
2002-02-27 (laboratory assistant) 2002-02-27 (Ph.D student)
Figure 3.7 Repeatability by different operators
The test results and the figures do not show any kind of systematic or random error of the capillary column measuring system. In all cases of test runs the relative standard deviations were lower than 1 per cent.
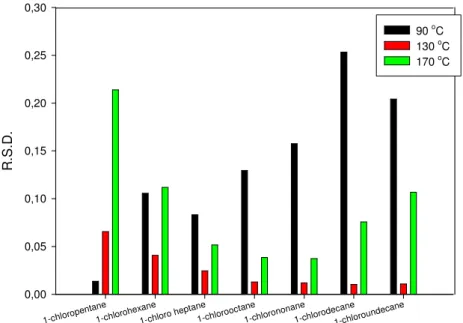
The next investigation part of precision testing was the investigation of the effect of matrices and temperature on indices. Figure 3.8 shows the results of precision test of the temperature effect.
1-chloropentane 1-chlorohexane
1-chloro heptane 1-chlorooctane
1-chlorononane 1-chlorodecane
1-chloroundecane
R.S.D.
0,00 0,05 0,10 0,15 0,20 0,25 0,30
90 oC 130 oC 170 oC
Figure 3.8 Repeatability at different temperature
Figure 3.8 is not surprising because the repeatability of chloro-alkanes with small carbon number at low temperature is better than at higher temperatures, where the elution time is short. This is true inversely. The determination of retention indices of chloro-alkanes of small carbon number at high temperatures is less precise. The ideal conditions should be between the two conditions, at medium temperature with probes of medium carbon numbers. During measurements the standard temperature was 130 oC.
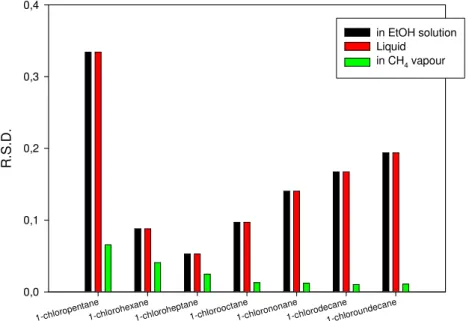
The last step of the test was the study of the solvent effect. Usually the solutes were evaporated in methane atmosphere and 0.5 µl samples of these vapour mixtures were injected onto the columns.
We tested the other two methods too, i.e. the injection of the pure liquid without evaporating the solvents in methane and the injection of the molecular probe dissolved in ethanol. The results of precision tests of these three different matrix systems were compared.
As the figure 3.9 shows the different liquid injection techniques result errors, which are systematically high, than those during the gas injection.
1-chloropentane 1-chlorohexane
1-chloroheptane 1-chlorooctane
1-chlorononane 1-chlorodecane
1-chloroundecane
R.S.D.
0,0 0,1 0,2 0,3 0,4
in EtOH solution Liquid in CH4 vapour
Figure 3.9 The solvent effect
4 Results and discussion
4.2 Wrong gas/liquid partition data by gas chromatography
In Refs. [11-15, 56] retention indices and standard chemical potential differences of some 160 solutes have been published on the C78 stationary phase with melting point of about 80 °C and on eight polar derivatives of this branched paraffin which structures shown in Fig.1.2 We realized that on C78 the published indices of solutes are not coherent with the published g-SPOT-s. In this part of my dissertation I identify and correct these wrong data.
The temperature dependence of the retention index on the standard C78 and on the polar stationary phase can be given by the quadratic equation
2 C78
j TT, C78
j T,
† C78 j C78
j (T) I (T ) A ∆T A ∆T
I = + + [4.1]
2 P
j TT, P
j T,
† P j P
j (T) I (T ) A ∆T A ∆T
I =∆ +∆ +∆
∆ [4.2]
where T†= 403.15 K is the standard temperature, T†= 403.15 K. The temperature dependence of the indexes is small and nearly linear. The coefficient of the quadratic term,
C78 j
ATT, , is in the most cases not significant. The indices determined in the polar derivatives of the branched paraffin, P, are given as
) ( )
( )
(T I T I 78 T IPj = Pj − Cj
∆ [4.3]
Kováts and co-workers published these index differences, ∆IPj for solutes on polar derivatives of C78 stationary phase. In their publications of polar stationary phases - unless for POH and SOH - they don’t reported the quadratic term of the temperature dependence of index differences. In the publications of C78 solvent some molecules have a quadratic term.
Combine equations 4.1, 4.2 and 4.3 it can be clearly seen, that molecules have a quadratic term too, which were published on C78 stationary phase and don’t have on polar phases, as equation 4.4 showes:
2 P
j TT, C78
j TT, P
j T, C78
j T,
† P j
† C78 j P
j (T) I (T ) I (T ) A A ) T A A ) T
I = +∆ +( + ∆ +( + ∆ [4.4]
The proposal of Kirchhoff was accepted for the molar heat capacity difference of a solute,
j
CP,
∆ between the ideal solution and the ideal gas phase in the temperature range of about
oC 100
130± . (This supposition has been justified by data published in two recent papers [78, 79]). Consequently, the g-SPOT in the polar derivatives of the branched paraffin:
78 C j P j P
j µ µ
µ =∆ −∆
∆ [4.5]
The g-SPOT of the n-alkanes related to the molal Henry coefficient, gz / kg atm mol–1 is at a given temperature a slightly curved function of the carbon number, z, which becomes nearly linear for higher members of the series. For the whole series it can be described by an equation where every constant is a hyperbolic function of the carbon number, z:
−
− +
+ + + +
− + +
=
∆ z ( 0 1 2) ( 0 1 2) ( 0 1 2) † ln( †) T T T T z T
z c c z c
z s s s z T
z h h
µ h [4.6]
where, T = 403.15 K is the standard temperature. †
4.2.1 Identification and correction of the wrong data on the paraffin C78
Retention and partition data on the paraffin C78 have been reported in Ref. [12]
(together with data on the solvent POH). By controlling this data set it was realized that the paraffin solvent used in Ref [12] was slightly oxidized i. e. slightly polar. The corrected data were re-determined on a pure sample of C78 were reported in [11]. It is seen that the correction only concerns the retention index of polar solutes at the standard temperature, I130,j, the temperature dependence of the index of all solutes remained the same. This implies that from the thermodynamic constants only ∆Hj changes slightly whereas ∆Sjand ∆CP,j does not. Now it is clear that for retention and partition data in C78 the values of the coefficients AT,j and ATT,j (resp. ∆Sj and ∆CP,j) must be taken from Ref. [12] but the value of the constant at the reference temperature, I (resp. ∆H ) from Ref. [11].
4.2.2 The best n-alkane data on the branched paraffins C78 and C87
Retention indices and the thermodynamic constants on the paraffin C78 and C87 were compared. The coefficients of eq.3.6 have been calculated with the published n-alkane data for the paraffin solvents C87 [80] and C78 [11,12] as follows. First with the aid of the published thermodynamic constants of the individual alkanes (∆Hz,∆Sz and ∆CP,z) gSPOT- s were calculated for every twenty degree intervals for the n-alkanes with z = 5-14 in the domain where data were measured experimentally. Data of the higher n-alkanes also included one extrapolated g-SPOT to 20 °C lower temperature. On this extended data set Eq. 4.6 was fitted. The resulting constants of Eq. 4.6 calculated in this manner for the gSPOT-s of the n- alkanes expressed in [cal mol–1] related to the molal Henry coefficient, gz /kg atm mol–1 are listed in Table 4.1.
Table 4.1 Calculated constants using eq.4.6
C78 C87 units
h0 – 680.89 – 344.84 cal mol–1 h1 – 991.92 – 1 009.70 cal mol–1 h2 + 712.58 – 156.44 cal mol–1
s0 – 9.1625 – 8.5765 cal mol–1K–1 s1 – 1.2560 – 1.2931 cal mol–1K–1
s2 – 2.8312 – 3.7859 cal mol–1K–1 c0 + 8.21 + 0.3233 cal mol–1K–1 c1 + 1.208 + 1.445 cal mol–1K–1 c2 – 42.30 – 1.209 cal mol–1K–1
With these constants were calculated the new g-SPOTs data of n-alkanes and the parameters of Kirchhoff-equation. Equation 3.6 allows an easy comparison with data published in [11] and [12] in units of [cal mol–1]. Data are also listed in units of [J mol–1] related to the molal Henry coefficient, gz / kg bar mol–1. Latter units should be used following the instruction of International Union of Pure and Applied Chemistry [55,81]. For the conversion of the data it is important to remember that the reference state of the solute in the two systems is different. Hence, for the conversion following equations are valid [82]:
1
1 4.184 /
/ − = ∆ −
∆Hj Jmol Hj calmol [4.7]