Hyperfiltration (Reverse Osmosis)
JAMES S. JOHNSON, JR., LAWRENCE DRESNER, AND KURT A . KRAUS
I. Introduction 346 II. Historical Background 348
III. Conceptual Design 351 IV. Energy Requirements 353
V . T h e r m o d y n a m i c Relations 3 6 2 A . Distribution between Solutions and M e m b r a n e s 362
B. Chemical Potential Differences across M e m b r a n e s 368 V I . Transport Relations and Mechanism of Salt Rejection 3 6 9
A . Structural A r g u m e n t s 3 7 0 B. Transport Equations and Phenomenological Analysis 371
V I I . M e m b r a n e s 383 A . Cellulose Acetate 3 8 4 B. Other Uncharged M e m b r a n e s 391
C. Ion Exchange M e m b r a n e s 3 9 2 D . Other M e m b r a n e s 3 9 4 Ε. M o d e l Solutions and M e m b r a n e s 395
V I I I . Concentration Polarization 4 0 2 A . Concentration Polarization in a System with Laminar Flow 4 0 3
B. Concentration Polarization in a S y s t e m with T u r b u l e n t F l o w 4 1 0
C. Pumping W o r k 4 1 3 I X . Equipment 4 1 6
A . Experimental Assemblies 4 1 6 B. Pilot Plants and Plant Designs 4 1 8 X . Economic Considerations 421
Acknowledgments 431 List of S y m b o l s 431 References 4 3 3
345
L Introduction
During the last 10 years interest has greatly increased in reverse osmosis, or hyperfiltration, as a promising method for the economic recovery of water from saline sources. In hyperfiltration, desalination is achieved by forcing salt solution under pressure through a membrane which generally passes water more readily than salts. It differs from electrodialysis, the other important membrane method, in that water is removed from salt rather than salt from water and that the driving force is pressure rather than electrical potential. The equipment used in the two methods thus is very different as are the membranes, although the region of overlap for useful membranes may be larger than implied in the current literature.
There are many reasons for the present enthusiasm for hyperfiltration;
possibly the most cogent one is the recent development of membranes which combine good salt rejection with moderately high water trans- mission at reasonable pressures (Lo-60, Lo-62b, Lo-63a). Other reasons are the appealing conceptual simplicity of the method, which essentially consists of removal of salt by filtering it away from water under pressure;
the novelty of the method, which promises that further intensive research would yield disproportionate improvements; operability at ambient temperatures, which tends to avoid scaling problems and to minimize corrosion; and the belief that the energy requirements for the process are low. Study of membranes also greatly appeals to many, not only because it may form the basis of a new group of industrial separations processes, but also because it is intimately tied to many processes occurring within living organisms.
Hyperfiltration can be regarded as an extension of ultrafiltration, in which particles of colloidal dimensions are removed from disperse systems by passage through a suitable membrane or "filter." W e shall reserve the prefix "hyper" for cases in which the membrane separates low-molecular-weight solutes (sometimes called "crystalloids" in colloid literature), such as ordinary inorganic acids, bases, and salts. The term reverse osmosis is widely applied to this process, since it is often argued that to effect flow of solvent through the membrane at least enough pressure must be exerted to overcome the osmotic pressure of the solution.
This widely held view, although applicable to ideal membranes with perfect rejection ability, is not correct for real membranes with finite rejection ability, even if this is very high. With real membranes one need not overcome the osmotic pressure of the feed but only the difference in osmotic pressure between feed and product solutions. This
difference depends on flow rate of water through the membrane and changes from zero (at negligible flow) to a limit given by the character- istics of the membrane. Thus with real membranes, flow can occur at pressure differences which are small compared with the osmotic pressure of the feed solution but, of course, desalination is then negligible. The bases for these statements are implicit in kinetic analyses of membrane transport by Laidler and co-workers (La-49, Sh-49), and a parallel discussion by Staverman (St-51), which through use of irreversible thermodynamics avoids the dependence on physical models in the Laidler study. (For further discussion see Section VI.)
There is, moreover, some ambiguity concerning which of the several osmotic processes (e.g., electro-, anomalous) is the "normal" type, as distinguished from the "reverse." It appears that the "normal" is taken to be that in which solvent flows through a membrane from a dilute solution into a more concentrated solution, and flux of solute is negligible.
However, with real (leaky) membranes, there is also a flow of solute, usually in the direction opposite to solvent flow; the contrast with
"reverse osmosis," in which the fluxes are in the same direction, is therefore not complete, and the term is to some extent misleading.
However, the term "reverse osmosis" has become strongly established by usage in the desalination field, and we do not expect to supplant it.
Our intention in stressing the term "hyperfiltration" is rather to emphasize warnings of misleading implications of the common name.
It has the further advantage of being applicable to any process in which one effects separation of solutes by differences in their permeation rates when solution is forced through a membrane under pressure. The term is descriptive even if the solute to be removed is at trace concentra- tion and does not significantly contribute to the osmotic pressure.
In spite of the close relation between ultrafiltration and hyperfiltration there are some (to us essential) differences. Many observations on ultrafiltration can be interpreted in terms of screening out of particles by a matrix which has pores of suitable dimensions. Removal of salts from water, however, cannot be reduced to such simple geometric terms, because there is no substantial difference in the size of water molecules and the sizes of many inorganic ions. The hyperfiltration membrane thus must be able to affect the thermodynamic and transport properties of salts and water by forces which do not depend primarily on the size of the ions or molecules to be separated. These forces could be short range (e.g., of the Van der Waals' type) or long range (e.g., of the Coulombic type). Their more detailed understanding is the objective of much of the current work on hyperfiltration. Thus, by using the term
"hyperfiltration" we do not intend to imply anything about the mecha-
nism of separation of salts from water, and in particular we do not wish to imply that in hyperfiltration the separation of salts from water occurs by "screening" or restricted diffusion in the sense used, e.g., by physiologists concerned with separation of large (colloidal) solute particles from solutions.
II. Historical Background
The first observations of salt screening or salt filtering were made by colloid chemists in the course of ultrafiltration experiments, and led to statements in the literature that solutes such as K I 03 exist partially in a colloidal state. Further investigation, however, showed a decrease in the fraction of salt filtered with increase in salt concentration (Er-34, Mc-36), which would not be expected if colloids were formed, but which is, at least qualitatively, consistent with rejection by an ion-exchange mechanism. Studies of rejection of salts by collodion (cellulose nitrate) and cellophane (regenerated cellulose) membranes have been reported, e.g., by Trautman and Ambard (Tr-52, Am-60), Hacker (Ha-41), and Wintgren (Wi-40). These membranes in general gave fast transport of water, but salt rejection was low, less than 10 % for NaCl concentrations above 0.1 M.
Other materials which have been used in ultrafiltration include copper ferrocyanide, cellulose acetate, fine metallic meshes with pores partially closed by electroplating, porous copper membranes prepared by distillation of zinc from brass, and various natural membranes. There may well be much in the ultrafiltration literature useful for desalination.
A comprehensive review was compiled by Ferry in 1936 (Fe-36);
recently the use of membranes in dialysis (another related field) was reviewed by Craig (Cr-64).
The first recognition1 that salt rejection by membranes might be useful in desalination seems to have been by Reid at the University of Florida; Breton (Br-57) refers to a 1953 proposal by Reid to the Office of Saline Water. McKelvey et al. (Mc-57) apparently first suggested use of ion-exchange membranes for hyperfiltration. The Florida group investigated membranes of a number of materials. The one showing the most promise was cellulose acetate, which rejected 98 % or more of the salt from salt solutions of sea-water concentration.
1 Recognition of the rejection properties of cellulose acetate has been attributed ( K e - 6 5 ) to Biget (Bi-50). However, the observations referred to appear to be of absorption of salt from solutions by a cellulose acetate gel, not salt rejection by membranes or gels.
Permeation rates, however, were small. A group at the University of California at Los Angeles (Yu-58) had been working along similar lines.
Loeb and Sourirajan (Lo-60) developed cellulose acetate membranes of greatly enhanced flow by casting them from solutions containing perchlorate salts. This work has been repeated and confirmed in many laboratories, particularly by a group at General Dynamics (Lo-63d) and a group at Aerojet General (Ke-63b). Extensive efforts to prepare useful membranes of other substances are also underway. The growth of the field is illustrated in the successive Annual Reports of the Office of Saline Water, which sponsored Reid's pioneering work and whose support is responsible for much of the current interest; the 1963 issue (OSW-63a) has many more references to research in this area than those of earlier years.
The mechanism of rejection by cellulose acetate and other organic materials of zero (or negligible) charge density is not yet settled. Rejection by membranes having fixed ionizable groups is better understood, at least to a first approximation, but there has been much less work on hyperfiltration with ion-exchange materials in spite of the fact that the first materials showing rejection apparently contained ion-exchange groups. M c K e l v e y et al. (Mc-57, Mc-59, Mc-64) tried several commer
cial anion- and cation-exchange membranes; they found rejections as high as 9 0 % with 0.1 Μ NaCl and an anion-exchange membrane.
Rates of flow through the membranes giving appreciable rejection were low, however, usually less than 0.1 cm/hr at 1000 psi pressure.
Hyperfiltration is related to many traditional fields of chemistry and physiology. Studies of membranes both of biological and synthetic types are particularly pertinent; the contributions of such men as Michaelis, Teorell, Meyers and Sievers, Barrer, Cole, Elford, and Sollner readily come to mind. The pertinence to the subject at hand of results obtained in these fields, as well as the extensive literature on dialysis, has been only superficially evaluated, and it is beyond the scope of this review to remedy this. W e shall, however, list some general references.
Proceedings of symposia on membrane phenomena have been publish
ed under the editorship of Clarke (Cl-53) and Shedlovsky (Sh-55).
The book by Clarke contains a particularly interesting paper by Kirkwood (Ki-53) on the application of irreversible thermodynamics to transport through membranes. A series of papers by Kedem, Katchalsky, and co-workers also deals with the phenomenological aspects of transport through membranes [see e.g., (Ke-58), ( K e - 6 1 ) , and (Ka-62)]. Their development is similar to that used by Spiegler (Sp-58) in his analysis of transport through ion-exchange membranes. The proceedings of a Faraday Society Symposium on membrane phenomena are available
(FSS-56), as are those of a 1960 symposium in Prague (PS-61). A recent book by Tuwiner has much of interest on membranes (Tu-62). The excellent monograph by Schlogl on membrane transport contains an extensive bibliography (Sc-64b). Helfferich's book (He-62) on ion- exchange provides much useful background information. A book by Harris (Ha-60a) deals with biological systems. Pappenheimer (Pa-53) has reviewed transport from the point of view of the physiologist.
Teorell (Te-62) has recently summarized his work on membrane excitability.
With respect to literature more directly pertinent to desalination, bibliographies have been compiled by McCutchan (Mc-61) and by Mangan et al. (Ma-63b); the status was reviewed at the 1961 Woods Hole Conference (DRC-63) and the 1962 Athens Conference (We-62); research reports devoted to desalination symposia have appeared in the American Chemical Society Advances in Chemistry Series (ACS-60, A C S - 6 3 ) . Besides the annual reports [see, e.g., ( O S W - 6 2 ) and (OSW-63a)] summarizing work sponsored by the Office of Saline Water, a variety of topical reports are issued by that organiza- tion (available through the Office of Technical Services) and by the Water Resources Center of the University of California.2
While interest in research in hyperfiltration is very high at present, development and testing of economical devices for the large-scale removal of salts from water lags far behind other desalination methods such as distillation, electrodialysis, and freezing. Thus, only a single paper specifically on hyperfiltration was presented at the 1962 desalination conference in Athens (Lo-62b) compared with 23 papers on distillation, 16 on electrodialysis, and 9 on freezing.
Thus this chapter, by necessity, will deal principally with the scientific aspects of the subject and can contribute little to the engineering aspects.
W e have included some discussion of economic considerations. These, however, are highly speculative at present, a reflection of the undeveloped state of research and engineering in this field. However, the enthusiasm of the many people now engaged in this work seems to us well founded.
W e share their optimism and believe that the probabilities are high that with continued intensive research, hyperfiltration will establish itself in the not-too-distant future as another practical and versatile technique for desalination.
2 Footnote added in proof. A n excellent review of the field can also be obtained from the Proceedings of the First International S y m p o s i u m on W a t e r Desalination which was held in Washington, D . C , October 1965. Several papers were presented at this conference dealing with various aspects of reverse osmosis (Br-65a, G l - 6 5 , K e - 6 5 a , M a - 6 5 a , M e - 6 5 , So-65).
III. Conceptual Design
Some of the aspects of hyperfiltration are illustrated in Fig. 8.1, where some terms and symbols are also defined.
F L U X O F W A T E R
PRODUCT
BACKING MATERIAL M£MBftANE
FEED
C0 , 7Γ
2α ' α ' α
czf ,irf, Pf
F I G . 8.1. Hyperfiltration (conceptual).
Consider a salt solution (two-component system) with salt concentra
tion c2(f) (moles/liter) or m2(f) (moles/1000 g of solvent) and with osmotic pressure ZJTy , placed against a membrane (suitably supported by a backing material). If pressure is applied and if the membrane can reject salts while allowing water to pass, a more dilute salt solution will leave the membrane at the low-pressure side at concentration c2u) (or m2J) and osmotic pressure Πω , at steady state. If the pressure drop occurs only across the membrane, Pf = Px; and if the system is well stirred, cf = ca and nf = Πα; the subscript α indicates properties at the entrance interface. The flux of water J1 (kg cm~2 s e c- 1) or j \ (moles c m- 2 s e c- 1) through the membrane is, as a first approximation,3 proportional to the effective pressure, which we define as
^err = (P. - Ρω) - (Πα - Πω) =ΔΡ- ΔΠ^ΡΛ- ΔΠ. (8.1) Permeation rates (/χ) would ideally be proportional to Pe f f if the solution is sufficiently dilute. It should be noted that with real membranes ΔΠ goes to zero as ΔΡ and Jx go to zero.
3 A more complete representation is given in Eqs. (8.25) and (8.28).
The expression for flux of salt through the membrane is more com
plicated (see Section VI, B). Suffice it to say here that the steady-state salt rejection
R = Κ - = 1 - (™J"U ™ 1 - (cjca) (8.2) must be zero at zero flux because then equilibrium exists between the
solutions on the two sides of the membrane and ma = τηω . As the flux is increased, R increases and may reach an asymptotic limit characteristic of the rejection ability of the membrane.
The diagram of Fig. 8.1 is greatly oversimplified. If the inflowing solution is not stirred (and if there is no convection), and if the system is operated at a reasonable transmission rate (v0) of water, a rapid build-up of rejected salts against the membrane face occurs; ca becomes much larger than the feed concentration cf since diffusion of salt away from the surface is slow. In a matter of minutes or even seconds, this salt build-up, or concentration polarization, may be so severe that, with a membrane of constant and finite rejection, the effluent concentration εω approaches the bulk inflowing concentration, cf. The rate of approach of εω to cf is, at constant transmission rate, v0 , dependent on the rejection R of the membrane and, indeed through analysis of the effluent from such an unstirred system the rejection characteristics of a membrane may be determined conveniently (Ra-65a).
Figure 8.2 gives for various values of R the ratio cjcf of effluent concentration to feed concentration as a function of the dimensionless parameter τ defined by the equation
τ = v0HI$2, (8.3)
where v0 is the transmission rate of the membrane in centimeters per second, t is time in seconds, and Sf2 is the diffusion coefficient of the salt in the solution in contact with the membrane, in square centimeters per second. The curves of Fig. 8.2 were computed on the assumption that R and Sf2 are independent of the concentration of the contacting solution. The extent of concentration polarization in this unstirred system is also illustrated in Table 8.1 for sodium chloride solutions with ^2 = 1.5 Χ 1 0 "5 c m2 sec"1. At a flow rate of 10 gal ft"2 d a y -1 and 95 % salt rejection, cjcf has increased by 50 % in 10 sec. At a trans
mission rate of 2 0 gal f t- 2 d a y- 1 this has occurred in a few seconds, and at 100 gpd/ft2 in about 0.1 sec.
Clearly, in hyperfiltration effective stirring must be provided to combat this rapid concentration polarization and to utilize to the maximum extent the rejection of the membrane. The conceptual design
0 Ό 0 0
10 2 0 3 0 4 0 5 0 6 0 7 0 8 0 9 0 100 110 120
F I G . 8.2. Breakthrough curves for an unstirred hyperfiltration system. (Numbers are per cent rejection of membrane.)
FEED CHANNEL WITH MEMBRANE AND BACKING MATERIAL PUMP ^
AND ( ) P R E S S U R I Z E R ^
PRODUCT
'TURBINE"
INTAKE WASTE F I G . 8.3. Hyperfiltration—conceptual design.
of hyperfiltration equipment thus must be of the type illustrated in Fig. 8.3, where the solution is pumped rapidly through the hyperfiltra
tion cells. In a practical system it may be desirable to recover the energy of the reject solution, e.g., by discharging it through a turbine.
IV. Energy Requirements
The energy consumption in hyperfiltration may be divided into the following five parts:
(1) Minimum thermodynamic energy.
(2) Increase in energy requirement because with concentration polarization ca > cf and Πα > TIf.
(3) Excess pressure used for producing practical flow rates through the membrane.
(4) Unrecovered energy in reject stream.
(5) Pumping (circulation) requirements to minimize concentration polarization.
There are, of course, also other pumping requirements (e.g., bringing the saline water to the plant), but these will not be discussed here.
The five topics listed are discussed below under the indicated numbers.
(1) The minimum thermodynamic energy requirement in hyper
filtration, as in any other desalination technique, is determined by the ratio of the activity of water, ax, in the saline medium (feed) to that in the effluent or product, and the per cent recovery of water.
The relationship between free energy and activity is
Free energy per mole = — RT ln ax (8.4)
if pure water is removed from a reservoir of essentially infinite size.
(For values of RT in various units, see Table 8.2.) For a reservoir of finite size the energy required is obtained through integration of curves of activity of water as a function of salt concentration by the relationship
Free energy per mole of water = — RT f ln ax dnx . (8.5)
J ο
The activity of water in many two-component systems may readily be computed from tables of osmotic coefficients φ by the relation
l n ^ = -(vm2/55.51)<£, (8.6)
where is the number of moles of ions per mole of salt' and t n2 its molality. For salt mixtures, e.g., sea water, Eq. (8.6) becomes
1ηΛχ = - ( Z W 5 5 . 5 1 t yf (8.7)
where the summation is to be carried out over all solute species / including ions.
If there is a single predominant salt, the value of φ for this salt at
CONCENTRATION POLARIZATION IN AN UNSTIRRED S Y S T E M (Sodium chloride, ^2 = 1.5 χ 1 0 -δ cm2/sec)
Transmission rate c(x>\cf f °r s al t rejection of
Gal ft"2 day"1 cm/: sec T i m e , sec τ 99% 95% 90% 80% 60% 40% 20%
10 4.72 x i o -4 0.0 0 0.0100 0.0500 0.100 0.200 0.400 0.600 0.800
0.1 0.00148 0.0104 0.0521 0.104 0.207 0.410 0.610 0.807
1 0.0148 0.0114 0.0568 0.113 0.223 0.433 0.633 0.821
10 0.148 0.0151 0.0739 0.144 0.276 0.507 0.700 0.862
100 1.48 0.0322 0.150 0.277 0.476 0.726 0.866 0.949
1000 14.8 0.154 0.555 0.789 0.944 0.993 0.998 1.000
20 9.43 χ i o -4 0.0 0 0.0100 0.0500 0.100 0.200 0.400 0.600 0.800
0.1 0.00593 0.0109 0.0543 0.108 0.214 0.421 0.621 0.814
1 0.0593 0.0130 0.0644 0.127 0.247 0.467 0.664 0.841
10 0.593 0.0219 0.105 0.200 0.364 0.613 0.786 0.910
100 5.93 0.0756 0.319 0.528 0.760 0.927 0.975 0.992
1000 59.3 0.455 0.946 0.996 1.000 1.000 1.000 1.000
50 2.36 χ i o -3 0.0 0 0.0100 0.0500 0.100 0.200 0.400 0.600 0.800
0.1 0.0371 0.0123 0.0611 0.121 0.236 0.453 0.651 0.833
1 0.371 0.0188 0.0911 0.175 0.326 0.569 0.752 0.892
10 3.71 0.0546 0.242 0.419 0.650 0.863 0.946 0.982
100 37.1 0.321 0.845 0.971 0.998 1.000 1.000 1.000
1000 371 0.975 1.000 1.000 1.000 1.000 1.000 1.000
100 4.72 χ i o -3 0.0 0 0.0100 0.0500 0.100 0.200 0.400 0.600 0.800
0.1 0.148 0.0151 0.0739 0.144 0.276 0.507 0.700 0.862
1 1.48 0.0322 0.150 0.277 0.475 0.726 0.866 0.949
10 14.8 0.154 0.555 0.789 0.944 0.993 0.998 1.000
100 148 0.774 0.999 1.000 1.000 1.000 1.000 1.000
1000 1480 1.000 1.000 1.000 1.000 1.000 1.000 1.000
Hyper filtration (Reverse Osmosis) 355
TABLE 8.2
RT AND RTjVx ( W A T E R ) IN V A R I O U S U N I T S AS A FUNCTION OF TEMPERATURE*
RT
kw-hr/
kw-hr/ 1 0 0 0 gal, RTIVX = P(at) T e m p . ° C / atm/mole cal/mole kw-hr/mole metric ton 2 5 ° C for water
0 2 2 . 4 1 5 542.8 6.309 x 10" - 4 35.02 132.2 1 2 4 4 10 23.235 562.7 6.540 χ l ο- 4 3 6 . 3 0 137.0 1 2 8 9 2 0 2 4 . 0 5 6 582.6 6.771 χ ίο- 4 37.58 141.8 1333 25 2 4 . 4 6 6 592.5 6.886 χ ι o-- 4 38.22 144.2 1 3 5 4 30 2 4 . 8 7 6 602.4 7.002 χ l ο- 4 38.87 146.7 1375 5 0 2 6 . 5 1 8 642.2 7.464 x ι ο- 4 4 1 . 4 3 156.4 1454 75 2 8 . 5 6 9 6 9 1 . 9 8.041 x ι o-- 4 44.63 168.4 1 5 4 6 1 0 0 30.620 7 4 1 . 5 8.619 χ l ο- 4 47.84 180.6 1 6 2 9 125 32.672 7 9 1 . 2 9 . 1 9 6 χ ι ο- 4 5 1 . 0 4 192.6 1703 1 5 0 34.723 840.9 9.773 χ ι o-- 4 54.25 204.8 1768 175 36.775 890.6 10.351 χ ι ο- 4 57.45 2 1 6 . 8 1821 2 0 0 38.826 940.3 10.928 χ ίο - 4 6 0 . 6 6 228.9 1 8 5 9
° Conversion factors and data used:
R = 82.057 c m3 atm m o l e "1 d e g -1
= 1.9872 cal m o l e - M e g "1
= 2.3096 X 1 0 -e k w - h r m o l e -1 d e g -1 3.7742 kg H20 = 1 U . S . gal at 2 5 ° C 5.5506 Χ 1 04 moles H20 = 1 metric ton
Vi computed with densities of water from "Lange's Handbook" ( 1 9 6 1 ) .
the ionic strength of the mixture is a suitable approximation. For many salt solutions, and particularly dilute salt solutions (brackish waters), φ is sufficiently close to unity to be neglected in many useful approximations. The approximation φ = 1 is nearly the same as assuming that Raoult's law holds.
For sea water and its concentrates, calculations of φ have been carried out recently by Stoughton and Lietzke ( S t - 6 4 , S t - 6 5 ) who combined literature data on NaCl with a Debye-Huckel expression modified to deal with salt mixtures. Typical minimum energy requirements based on these calculations are given in Table 8 . 3 . Through similar calculations minimum energy requirements for NaCl solutions have been determined.
Typical values are given in Table 8 . 4 .
T A B L E 8.3
M I N I M U M ENERGY REQUIREMENTS FOR D E S A L T I N G S E A W A T E R "
(kilowatt-hours per metric ton of w a t e r )5
Percent recovery T e m p . ,
°C 0 25 5 0 75 1 0 0
25 0.71 0.82 0.99 1.36 3.1
50 0.77 0.89 1.08 1.49 3.4
75 0.83 0.96 1.16 1.60 3.7
1 0 0 0.88 1.01 1.23 1.69 3.9
125 0.92 1.07 1.30 1.78 4.1
150 0.96 1.11 1.35 1.84 4.3
175 1.00 1.15 1.39 1.90 4.5
2 0 0 1.03 1.18 1.43 1.93 4.7
a F r o m ( S t - 6 5 ) . T h e numbers listed in this table and in Table 8.5 are slightly revised from those in ( S t - 6 5 ) . Recent osmotic coefficient measurements of synthetic sea salt solutions at 2 5 ° C (R. M . Rush, unpublished results) indicate that better sea water osmotic coefficients are computed by inserting total ionic strength in the concentration terms of empirical equations for osmotic coefficients of NaCl, rather than half the sum of the ionic molalities, the basis of the computations in ( S t - 6 5 ) .
b For conversion to kw-hr/1000 gal (25°C), multiply by 3.774.
T A B L E 8.4
M I N I M U M ENERGY REQUIREMENTS FOR D E S A L T I N G N a C l SOLUTIONS'*
(kilowatt-hours per metric ton of water)6
Percent recovery
- - - A p p r o x .
wN a C l T e m p . , °C 0 25 50 75 1 0 0 p p m NaCl
1.0 25 1.292 1.497 1.828 2.541 4 . 4 5 4 6 0 , 0 0 0 100 1.611 1.869 2 . 2 8 6 3 . 1 7 8 5.687
0.5 25 0 . 6 3 7 0 . 7 3 4 0.888 1.201 2.671 3 0 , 0 0 0 100 0.789 0 . 9 1 0 1.103 1.497 3.395
0.1 25 0 . 1 2 9 0 . 1 4 8 0 . 1 7 8 0.236 0 . 7 4 0 6,000 100 0 . 1 5 9 0 . 1 8 3 0 . 2 2 0 0 . 2 9 2 0.933
0.05 25 0.065 0.075 0 . 0 9 0 0 . 1 1 9 0 . 4 1 5 3,000 1 0 0 0.081 0.093 0 . 1 1 1 0 . 1 4 7 0 . 5 2 2
0.02 25 0.026 0 . 0 3 0 0 . 0 3 6 0.048 0 . 1 9 0 1,200 1 0 0 0.033 0.038 0.045 0 . 0 6 0 0 . 2 3 9
a F r o m (St-65).
" F o r conversion to kw-hr/1000 gal (25°C), multiply by 3.774.
In Tables 8 . 3 and 8 . 4 , the minimum energies refer to processes in which pure water is the product. In hyperfiltration, as well as in many other processes, the product will contain some salt, and estimation of minimum energies from the tables is somewhat cumbersome. A more convenient method, suggested to us by Professor George Scatchard, utilizes a graph of the total free-energy function G/RT>
G/RT = ln ax + (m2/55.5) ln a2 = (vm2/55.5)(ln m2y ± - φ) ( 8 . 8 )
as a function of solute concentration. Such a graph for NaCl at 2 5 ° and 1 0 0 ° C , constructed from activity and osmotic coefficients ( L i - 6 1 ) , is given in Fig. 8 . 4 . W e illustrate its use by estimating the minimum free
: • l ' ι • ι 1 1 1 1 τ 1 : / /
/ /
I ι I ι I . I ι I . I ι
0 1 2 3 4 5 6 M O L A L I T Y O F N a C l
F I G . 8.4. Total free energy of NaCl solutions.
energy at 2 5 ° C for producing a unit weight of water, concentration 0 . 1 m, from a 1 m feed, the reject being 3 m. With the specified concentrations, the feed must contain 1 . 4 5 units of water and the reject 0 . 4 5 . From Fig. 8 . 4 ,
AGjRT = (1.00)(-0.01255) + (0.45)(-0.316) - (1.45)(-0.0488) = 0.0440, A indicating the sum of product and reject minus feed. Multiplication by the value of RT in Table 8 . 2 appropriate to the units desired for the answer, e.g., RT = 3 8 . 2 2 kw-hr/metric ton, gives 1 . 6 8 kw-hr/metric
ton of product for this example of ~ 69 % recovery of 0.1 m NaCl product from 1 m feed.
The values of GjRT at 100°C are not greatly different from those at 25°, and the differences of minimum energies for the two temperatures (Tables 8.3 and 8.4) thus stem mostly from the differences in RT.
[It should perhaps be emphasized that the initial and final temperatures (assumed the same) of the feed, product, and reject determine the minimum energy, not the temperature at which the separation actually takes place.] The ideal curve, computed for φ = 1 and unit activity coefficients of solute at all concentrations of NaCl, is different from those computed with variations in φ and γ± considered, but good estimates of minimum free energy can nevertheless be made from it.
In the example cited, a minimum free energy of 1.73 kw-hr/metric ton of product would be computed from the ideal curve.
From tables of activity of water ax or of φ, the osmotic pressures of solutions may be calculated with good approximation from the equation
Π = -(RT/VJ ln ax = (RT/VJivmJ 55.5\)φ, (8.9) which assumes that the partial molal volume ( Fx) of water is independent
of pressure and concentration and equal to the molal volume Vx . Values of RT/V1 are given as a function of temperature in Table 8.2.
For aqueous solutions Eq. (8.9) becomes at 25°C
Π κ 24Ανηι2φ, (8.10)
where Π is in atmospheres.
Stoughton and Lietzke computed from their values of ax the osmotic pressure of sea-salt solutions; typical values are summarized in Table 8.5;
T A B L E 8.5
O S M O T I C PRESSURES OF S E A S A L T S O L U T I O N S0'6 (atmospheres)
W t . % salts T e m p . , -
°C 1.0 2.0 3.45 5.0 7.5 10.0 15.0 2 0 . 0 2 5 . 0
25 7.1 14.3 25.1 37.5 59.3 84 145 2 3 0 3 5 0
4 0 7.4 14.9 26.3 39.3 6 2 . 4 89 153 2 4 0 3 6 0 6 0 7.8 15.7 27.7 4 1 . 5 65.9 9 4 162 2 5 0 3 8 0 80 8.1 16.4 28.9 4 3 . 3 68.8 9 8 168 2 6 0 3 9 0 1 0 0 8.4 16.9 29.9 4 4 . 7 7 1 . 1 101 173 2 7 0 4 0 0
α F r o m ( S t - 6 5 ) ; see also footnote (a), Table 8.3.
b Assumes that no salts precipitate on concentration.
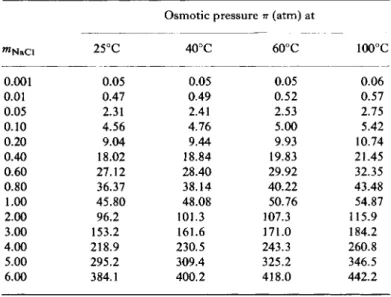
Table 8 . 6 gives Π for sodium chloride solutions of a variety of concentra
tions. In these calculations, variations of Vx with composition and temperature were taken into consideration.
T A B L E 8.6
O S M O T I C PRESSURE OF S O D I U M CHLORIDE S O L U T I O N S0
mN a C l
Osmotic pressure (atm) at
mN a C l 2 5 ° C 4 0 ° C 6 0 ° C 1 0 0 ° C
0.001 0.05 0.05 0.05 0.06
0.01 0.47 0.49 0 . 5 2 0.57
0.05 2.31 2.41 2.53 2.75
0 . 1 0 4 . 5 6 4 . 7 6 5.00 5.42
0.20 9.04 9.44 9.93 10.74
0 . 4 0 18.02 1 8 . 8 4 19.83 2 1 . 4 5
0 . 6 0 2 7 . 1 2 2 8 . 4 0 29.92 32.35
0 . 8 0 36.37 3 8 . 1 4 4 0 . 2 2 4 3 . 4 8
1.00 4 5 . 8 0 4 8 . 0 8 50.76 54.87
2.00 96.2 1 0 1 . 3 107.3 1 1 5 . 9
3.00 153.2 1 6 1 . 6 1 7 1 . 0 184.2
4 . 0 0 2 1 8 . 9 230.5 243.3 2 6 0 . 8
5.00 295.2 309.4 325.2 346.5
6.00 384.1 4 0 0 . 2 4 1 8 . 0 4 4 2 . 2
a F r o m (St-65).
(2) W h e n significant concentration polarization occurs in hyper
filtration the energy requirements are increased, because the activity of water of interest is that adjacent to the membrane face (α-interface) rather than the bulk (feed) solution. Concentration polarization, however, is determined by design variables which should be included in optimiza
tion procedures. From the point of view of energy requirements, greater concentration polarization is permissible for low-salinity waters than for sea water. Detailed discussion of concentration polarization may be found in Section VIII.
( 3 ) T o achieve finite rate of flow through a hyperfiltration membrane, there must be a pressure difference (A Ρ = Pf — Ρω = Ρα — Ρω) across it which must be larger than the osmotic pressure difference ΑΠ = 7 7Α — Πω; in a well-stirred system ΑΠ is (IJf — Πω). The difference between ( Ρα — Ρω) and ( 7 7Α — Πω) was defined [Eq. ( 8 . 1 ) ] as the effective pressure Pe f f . The energy consumption corresponding to this excess pressure is given by Peft^i · With current membranes
and sea water this excess energy consumption is several times larger than the minimum energy requirement. Thus, a typical operating pressure for sea water is ca. 100 atm. This corresponds, at 25°C, to ca. 2.8 kw-hr/ton water (10.6 kw-hr/1000 gal). The osmotic pressure for sea water is only 25 atm (see Table 8.5) and hence in this case four times as much energy is consumed in making water flow through the membrane at a reasonable rate as is needed for the reversible work.
As PEU and JX increase, the membrane area required for a given output of water decreases but the excess energy consumption increases.
In a proper economic analysis of the hyperfiltration process, PETT thus is a primary variable which should be included in the optimization calculations. This point is discussed further in Section X.
With water flux across a given membrane depending primarily on
Pe f f and with PETF usually much larger than ΔΠ> the energy consumption
for transport of water across the membrane is a relatively insensitive function of the salinity of the feed. This could be considered a major deterrent to the use of hyperfiltration in treatment of low-salinity waters and a serious disadvantage of this method compared with electrodialysis, where excess energy requirements vary rapidly with salinity. Future research on membranes should thus include the search for families of membranes which permit operation under conditions where the ratio Petf/An can be kept reasonably invariant with salinity. Since with less saline solutions, requirements for salt removal are usually less than for sea water, this increased rate of transport may be achieved through relaxation of the rejection requirements of the membranes. Significant progress has been made in this direction by Loeb (Lo-63b), who through modification of casting procedures developed cellulose acetate mem
branes for use with brackish waters which show much higher permeation rates than those used for sea water, but which also reject salt less effectively. Another route, which seems promising to us, is to develop porous ion-exchange membranes, which should give reasonable rejection rates with low salinity waters at pore diameters large enough to permit good flow at low pressures (Dr-63a).
(4) So far we have only talked about the energy consumed in moving the product stream from a region of high pressure to a region of low pressure. In hyperfiltration, the total feed stream has to be pressurized, and therefore a free-energy loss is associated with the reject stream.
Since this reject stream may well have a larger volume than the product stream, the free-energy consumption in the reject portion of the process may actually be larger than in the hyperfiltration step itself unless provisions are made to recover the energy, e.g., by discharging the reject stream through a turbine. While this requires additional equipment, it is
believed (Mc-63, Do-60) that with reasonably sized plants the recovery of the free energy of the reject stream can be done economically.
(5) Since intolerable concentration polarization occurs in an unstirred system (see Section III) there must be rapid flow of feed solution past the membrane face. The energy consumed in this pumping operation is an important design variable which should be included in optimization procedures. W e shall discuss this point further in Section VIII.
V. Thermodynamic Relations
Hyperfiltration is a flow process and is properly analyzed in terms of the thermodynamics of irreversible processes. However, the driving forces in the flux equations, which involve gradients or differences of chemical potentials, are given by equilibrium thermodynamics. Further, equilibrium thermodynamics needs to be considered because, even in a flowing system, local equilibrium is substantially maintained, and in particular, distribution of salts and water between the phases at the entrance (a) side of the membrane and at the exit (ω) side is given by the equilibrium distribution coefficient D*. The shape of the pressure- rejection curve depends strongly on the (equilibrium) distribution coefficient Z)*. Also, through equilibrium considerations a correlation between certain aspects of membrane behavior and other systems, such as model solutions, ion-exchange resins, etc., can be achieved.
A. DISTRIBUTION BETWEEN SOLUTIONS AND MEMBRANES
Consider a membrane which is immersed in a salt solution and at equilibrium with it. The condition of equilibrium is that the chemical potential of each distributable component J (including water) is the same in both phases. Since we shall select the same standard state for each J in each phase, the conditions of equilibrium become
<*j = aj(r), ( 8 . 1 1 )
where the subscript (r) designates the membrane phase. When J is an electrolyte, Eq. ( 8 . 1 1 ) becomes
aj = την+ηΐ_-γ±ν = <+ω^ _ "ω/± ω = m^m**^ (8.12) where m is concentration and γ is activity coefficient. Since we shall be
interested mainly in relative concentrations of salts and water in the two phases, we shall select as our concentration units in both phases moles
per kilogram of water and use the symbol /n* to designate these con
centration units for J in mixed solvents and membranes. Equations (8.11) and (8.12) hold whether or not the membrane contains ion-exchange groups. They apply for systems with a single salt and for salt mixtures, but the values of the activity coefficients, in general, differ for these different cases. Some rules regarding effect of one salt on the activity coefficient of another are given by Harned and Owen [(Ha-58), Chap. 14].
W h e n the membrane does not contain fixed charges, Eq. (8.12) becomes simply
where Z)y* is the distribution coefficient of J and Tj = y*//y±/ is the activity coefficient ratio. Good (equilibrium) salt exclusion by an uncharged membrane thus is equivalent to values of much larger than unity. This, in general, requires special organic materials and low water content (Kr-64). As a first approximation, y jy, for a given water- organic system, increases with decreasing dielectric constant (Sc-64a, La-65) and, at low water content, is exceedingly sensitive to water content. In general, y *7 at high water content does not differ much from y ± J . At low water content, however, y *7 may increase with decreasing water content and may go through a maximum; it then goes to zero, since at vanishing water content becomes infinite ( K r - 6 4 ) . For further discussion see Section VII, E.
While with an uncharged membrane good equilibrium salt exclusion requires large values of Γ, this is not a prerequisite for ion-exchange membranes because with the latter salt exclusion should occur because of co-ion exclusion. While the following considerations apply to cation and anion exchangers, we shall consider here a salt M X6 , distributing between a solution and an anion exchanger with capacity C0 (moles/liter) or C0* (moles/kg water in exchanger). Salt invasion is measured by the cation (or generally the co-ion) concentration of the membrane and the distribution coefficient is given by
m//mj = Dj* = y–j\yZj = , (8.13)
Dj* =
m J
mM*
m (m/)b y *v
(C
0* + bm
M*f
(bnij γ 1 _1 I C0*/ (1 + bmj*/C0*)b P"
(8.14) where ν — b + 1. Equation (8.14) reduces to
(8.15)
d log Dj*/d log m j = b — vd log Γ/d log m/, (8.16)
when C0* > bmM*. For a 1 : 1 electrolyte (e.g., NaCl) Eqs. (8.15) and (8.16) simplify to
Distribution coefficients with ion-exchange membranes thus should vary with salt concentration of the medium even when ˆ does not (Te-35, Me-36); with uncharged membranes, Z)*, under these condi
tions, would be substantially invariant with concentration. Further, while equilibrium salt rejection by uncharged materials requires suitable organic compounds and moderately low water content, such restrictions need not be imposed on ion-exchange membranes, which, depending on the surrounding medium, can reject at high water content. In fact, even porous ion-exchange bodies with relatively large pores may exhibit substantial salt rejection.
According to Eq. (8.16) the slope d log D*jd log ntj should equal b (for the salt M X6) when ˆ is constant; constancy of ˆ would seem a reasonable assumption at low concentrations. Thus, very small values of D * should occur for dilute solutions (e.g., brackish waters). Unfortunate
ly, real membranes do not follow this prediction; the gradient d log D*/d log rrij is much smaller than b, and observed salt rejection in dilute salt solutions is only moderate (Ba-65). Glueckauf (Gl-62) proposes that the small observed slopes result from nonhomogeneity of the membranes.
Because of their possible importance in future hyperfiltration mem
branes, we shall discuss nonhomogeneous ("porous") ion-exchange bodies in some detail. This discussion is largely based on references (Dr-63a), (Dr-63b), and (Dr-65), which limit themselves to the effect of long-range electrostatic forces.
Consider a membrane with water inclusions (pores) which are large compared with molecular dimensions. The surfaces of these inclusions are electrically charged because of the ion-exchange groups they contain.
Counterions are attracted to the pore surfaces, co-ions are repelled to the pore centers, and a double layer of the type familiar in colloid chemistry appears on the pore surfaces. In this double layer the ionic concentrations and the electric potential are highly nonuniform.
The net effect of these nonuniformities is to enhance salt invasion of a nonhomogeneous ion-exchange membrane over that of a homogene
ous membrane with the same ion-exchange capacity. (For "theoretical"
capacities of porous bodies as a function of pore radius, see Table 8.7.) Thus the presence of "large" pores will worsen salt exclusion (and presumably also salt rejection) of an ion-exchange membrane, but at
Dj* = K/c/xi/zy,
d log Dj*/d log nij = 1 — 2d log ˆ/d log mj.
(8.15a) (8.16a)
the same time it will improve its permeability to water. It will be interesting to see if porous ion-exchange membranes can be made which strike a good compromise between salt rejection and permeability.
T A B L E 8.7
Ι Ο Ν - E X C H A N G E C A P A C I T Y OF POROUS BODIES ( C Y L I N D R I C A L PORES)
Pore diam. A
Surface area m2/ml (pore)
Capacity (moles/liter pore volume) at Pore
diam. A
Surface area
m2/ml (pore) 1 0 0 A2/ c h a r g e 5 0 A2/charge 2 5 A2/charge
1 0 0 0 2 X 1 0 0.033 0.067 0 . 1 3
5 0 0 4 X 1 0 0.067 0.13 0.27
2 0 0 1 χ 1 02 0 . 1 7 0.33 0.67
1 0 0 2 x 1 02 0.33 0.67 1.33
9 0 2.22 χ 1 02 0.37 0.74 1.48
8 0 2.5 x 1 02 0.42 0.83 1.67
7 0 2.86 χ 1 02 0.48 0.95 1.91
6 0 3.33 χ 1 02 0.56 1.11 2.22
5 0 4 χ 1 02 0.67 1.33 2.67
4 0 5 χ 1 02 0.83 1.67 3.33
3 0 6.67 χ 1 02 1.11 2.22 4.45
2 0 1 χ 1 03 1.67 3.33 6.67
1 0 2 χ 1 03 3.33 6.67 13.3
Shown in Fig. 8.5 are the calculated (Dr-65) (room temperature) distribution coefficients of NaCl between an external solution and the liquid in a pore with radius r = 50 A, whose walls carry a surface charge of 1.7 X 10~7 meq/cm2 (about 0.01 charges per square angstrom).
In this calculation, the only departure of y±* from unity considered was that due to long-range electrostatic effects in the pore; for con
venience the mean activity coefficient in the external phase was taken to be unity. The average concentration of counterions necessary to just neutralize the ion-exchange groups in the pore walls was taken as 0.7 equiv./liter of enclosed volume (or ca. 0.7 equiv./kg water). Also shown in Fig. 8.5 is the calculated distribution coefficient of NaCl for a homogeneous ion-exchange membrane with a capacity of 0.7 equiv./kg water; for it Γ was taken to be unity. In the left half of the figure, the two curves are parallel and the distribution coefficients differ by about a factor of 5; as the concentration of the external solution increases, both curves asymptotically approach unity.
The straight-line part of the curves corresponds to circumstances under which salt invasion is small. This limiting case has been analyzed for charged microcapillaries by Dresner and Kraus (Dr-63a). The
1.0 I 1 1 "| ' M M
0 . 0 1 J l ι I ι ι ι ι I ι ι ι L L
0 . 0 1 0 . 1 0 . 7 c o n c e n t r a t i o n o f t h e e x t e r n a l s o l u t i o n
F I G . 8.5. Theoretical distribution of a 1:1 electrolyte between a solution and an ion exchanger with a capacity of 0.7 moles/kg water. (Porous exchanger: cylindrical pores, 5 0 - A radius; homogeneous exchanger: ˆ = \.)
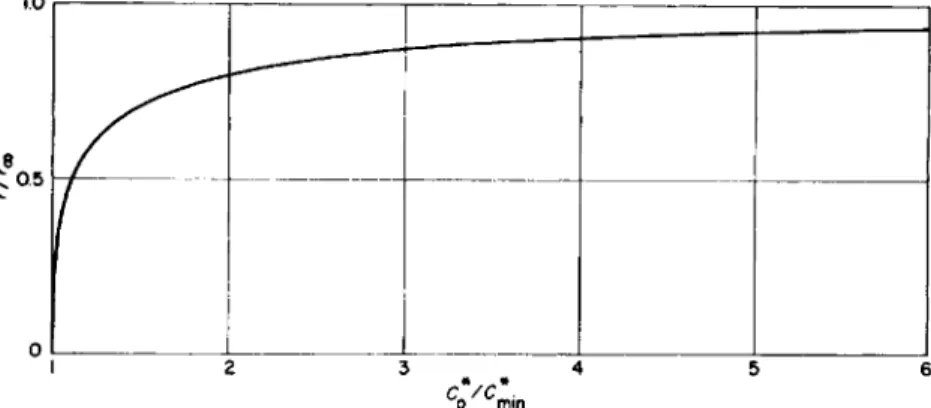
relevant relations may be described as follows: Suppose we have a feed solution of NaCl with concentration trij and wish to find what pore radius and fixed charge density will result in a specified distribution coefficient Z)*. According to (8.15a),
Note that C0* is in terms of the weight of pore liquid, not in terms of membrane volume. From our assumptions, (y±*)2 ^ 1 for a porous body, and the minimum capacity C *i n that the porous body must have is given when y±* = 1:
(This also corresponds to our assumed "homogeneous" case.) When C0* < C *i n , the porous body cannot give the desired exclusion (/)*) at the fixed concentration nij . On the other hand, when C0* is larger than C *i n , the pore radius r that is necessary depends on the ratio C0* / C *i n . When this ratio is only slightly larger than unity, r must be very small; as the ratio C0* / C *i n increases, so does r, ultimately ap-