Carpathian Journal of Earth and Environmental Sciences, August 2019, Vol. 14, No. 2, p. 483 - 494; DOI:10.26471/cjees/2019/014/097
INVESTIGATING THE ROLE OF GREEN INFRASTRUCTURE IN SUSTAINABLE URBAN WATER MANAGEMENT, A CASE STUDY IN
SZEGED
Ákos Kristóf CSETE
1& Ágnes GULYÁS
11University of Szeged, Department of Climatology and Landscape Ecology, Urban Climate Research Group, 2-6 Egyetem Street, Szeged, Hungary, email: cseteaki@gmail.com, agulyas@geo.u-szeged.hu
Abstract: Water problems arising from the negative effects of climate change will cause serious challenges to cities in the near future. Sudden, heavy rainfall in a short time as well as the summer drought periods can be a major concern for urban water management systems. In addition to overloading the urban sewer system, urban flash floods caused by large amounts of precipitation can lead to serious damage in connection with surface runoff; furthermore, this significant amount of water is removed from the water cycle of the city without utilization (infiltration, storage). Various water management and hydrology models, such as UFORE-Hydro used in our analyses, can serve as suitable tools for investigating these processes.In our research, we examined the role of vegetation covered areas in urban water cycle, paying special attention to their impact on surface runoff.
The results of modeling in Szeged sample areas show that vegetation can considerably reduce the volume and amplitude of surface runoff. In the scenario studies, vegetation has always changed the rate of runoff in a favorable direction, thus our findings support the necessity of green infrastructure developments.
Keywords: sustainable water management, UFORE-Hydro, green infrastructure, surface runoff, interception
1. INTRODUCTION
Nowadays and in the near future, the impacts of climate change will pose major challenges for the cities in connection with water and precipitation. As urban population and urbanized areas grow, the catchments of these areas are exposed to considerable anthropogenic pressure, which extend beyond the administrative boundaries of cities, so it is important to interpret and analyze water problems affecting the city and its environment as a complex system (Gayer
& Ligetvári, 2007; Jha et al., 2012).
The problem of the urban water cycle is highly diverse and significantly different from natural areas.
On the one hand, natural processes – heavy rainfall events, floods, droughts – can have a significant impact on the life of the citizens and the quality of life in the city. On the other hand, urban water is exposed to significant anthropogenic effects, both spatial and physical-chemical (pollution, potable water treatment) impacts. The high proportion of impervious surfaces and the drainage of water into artificial channels all contribute to urban hydrological processes characterized by rapid runoff with high
amplitude (Buzás, 2012; Haidu & Ivan, 2016). Urban planning needs to moderate these processes, preferably in a sustainable manner (which requires a better understanding of these processes) (United Nations Environment Program, 2009; Romnée et al., 2015).
Figure 1. The impact of changed land cover on hydrological processes based on FISRWG, 1998
Nowadays, more and more countries are
recognizing that urban green surfaces can be important means of reducing the negative impact of urbanization on the water cycle. With these means, urban water management can be made more sustainable and cost-effective, as well as cities can become more livable for their citizens. The role of green infrastructure lies primarily in its ability to buffer, and its use can combine artificial and natural infrastructure elements (Berland et al., 2017; Kuehler et al., 2017).
There are several examples of planning systems with a longer history related to urban water management. For example, LID (Low Impact Development) which was developed in the United States at the turn of the 1970s and 80s; SUDS (Sustainable Urban Drainage Systems) was introduced in the 1990s; and WSUD (Water Sensitive Urban Design) began to be used in Australia in the 1990s (Dietz, 2007; Credit Valley Conservation, 2010; Fletcher et al., 2015). Contemporary major initiatives – such as "Sponge City" in Asia's major cities and in Berlin or some parts of the Smart Cities projects – can play an important role in spreading these solutions (Liu et al., 2015; Raymond et. al., 2017). These solutions, partly due to different territorial and planning traditions, differ in lots of respects, but they also have several common elements in terms of their goals. Their primal goal is to restore the balance of the hydrological cycle of the city, to retain and store larger volumes of water (collecting and storing rainwater), preserving water quality (minimizing pollutants) and reducing interference (US EPA 2007). In these systems, green infrastructure solutions play a main role in replacing artificial engineering elements partially or completely (Johnstone et al., 2012).
In connection with the green infrastructure and the sustainable urban water management, it is important to highlight the role of the blue infrastructure. In the sustainable water management systems, it is hardly possible to separate the blue and the green infrastructure, because they form a complex whole. The blue infrastructure phrase refers to natural and semi-natural elements of the water network system, and with the green infrastructure, these can be form an organic environment in the artificial, urban habitat (Haase 2015; Raymond et al., 2017).
The background of these sustainable infrastructure elements described in many case, nevertheless the outstanding solutions can be found in the practice of ecosystem services and the nature-based solutions (NBS) (Frantzeskaki 2019). Nowadays the nature- based solutions are popular in the city planning in Europe. These mimic the natural processes, also inspired by them and use solutions which supported
by nature. The most important aim in the urban sustainable water management to restore the flows and routes of the cities to a semi-natural state. So, in the future, Blue-Green Urbanization will play an increasingly important role in urban planning, and it can be achieved through good water management (Brears, 2018). If the city planners take into consideration the nature-based solutions, they can improve the cities resilience. In this process, it need to take into consideration about the citizens well- being and the necessary infrastructure (Iojă et al., 2014). The ecosystem services (eg.: as the water/green surfaces cultural/social services, the green infrastructure buffering effect) and the NBSs can support to achieve these goals (Frantzeskaki, 2019).
Urban green areas can be important for the local citizens through their benefits. Green areas can provide positive effect (e.g.: microclimate and air quality improvement as well as shading). On the other hand they have some various benefits, that are also important for city dwellers. These areas can function as a venue of recreation, sports, and other types of social activities. Therefore, it is specifically important to harmonize the water management role of green spaces and the citizens’ interests (Kolcsár & Szilassi, 2018).
Urban environments are not characterized by large unified vegetation surfaces, therefore all types of vegetation are important parts of the urban ecosystem. By their size and complexity, trees can play a prominent role in this system (Herrera Environmental Consultants Inc., 2008; Fazio, 2010;
Holder & Gibbes, 2016; Huang et al., 2017). On the one hand, during heavy rainfall, interception (temporary water retention on leaf and stem surfaces) reduces the amount of water reaching the surface, thereby reducing the intensity of surface runoff and urban flash floods due to a longer time distribution (Bahmani et al., 2012). On the other hand, in low precipitation periods, the microclimatic environment can be positively influenced by evaporation and transpiration (Berland et al., 2017). During rainfall, they improve the possibility of infiltration, and reduce surface runoff. The changed landcover in urban areas can cause significant differences in the efficiency of the green surfaces. In a natural-state area, the infiltration and the evapotranspiration works on high efficiency with a low surface runoff. Nevertheless, in an urbanized area these processes work inversely.
Because of the impervious surfaces and the low proportion of the vegetation, infiltration and evaporation work with low efficiency and the volume of the surface runoff drastically increased (Fig. 1).
Therefore, modeling of surface runoff and
precipitation interactions of vegetation is an important research issue. However, the models are diverse in structure, only few can handle the two problems together. The most well-known complex models are SWMM (Storm Water Management Model), developed by EPA, and UFORE-Hydro, developed by the USDA Forest Service (Jayasooriya
& Ng, 2014). In our research, UFORE-Hydro was used and adapted in Hungary.
2. SAMPLE AREA
We carried out our investigation on a 0.19 km2 sample area located in the densely built downtown region of Szeged. Szeged is the largest city in the Southern Great Plain region of Hungary (168,000 inhabitants (KSH, 2011), and it also has special features due to its climatic and urban structure. The area is characterized by low annual precipitation (497 mm), high sunshine duration and consequently high drought sensitivity. Rainfall intensity is very variable, and during the long drought periods, there are frequent heavy rainfalls in the summer, and it will show an even more extreme distribution based on the trends of climate change (Péczely, 1979; Balázs, 2008; Mezősi et al., 2016). In connection with these processes, the use of various green solutions concerning drainage and water retention as well as the preparation of basic data will become more and more important. Due to the reconstruction after the 1879
“Great Flood”, the avenue-boulevard structure influenced later urban planning processes.
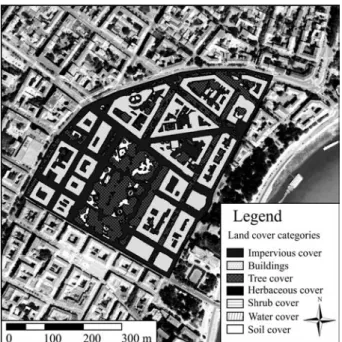
Figure 2. The study area within Szeged
The downtown areas are largely built-up and mostly covered with impervious surfaces. The downtown drainage system is undersized, obsolete, and does not
really use green infrastructure solutions.
Our study area is also located in a similar area, which includes the Széchenyi Square and the surrounding building blocks (Fig. 2). The green area in the square is crossed by pedestrian streets in several places, most of which are covered with impervious surface (which is also typical of the rest of the sample area). There are narrow street canyons between building blocks, thus precipitation is regularly accumulated along the edges of the pavement, and it cannot infiltrate into the soil, so it remains on the surface as excess water (Unger & Gál, 2017). The woody vegetation of the sample area is rich in 'urban species' (e.g. London plane (Platanus x hybrida), large-leaf linden (Tilia plathyphyllos), common hackberry (Celtis occidentalis), etc. For the international use of the model (at present), it is necessary to select a reference city located in the USA, whose main climatic parameters are similar to the sample area. Considering these aspects and the Köppen climate classification (Szeged is on the border of Cfa and Cfb (Szelepcsényi et al., 2009), Goodland in the State of Kansas, became the reference city for our project.
3. MATERIALS AND METHODS
The advantage of UFORE-Hydro, which we used in our research, compared to other hydrology models is that it pays special attention to the interaction between vegetation and rainwater. The output results give a detailed overview of the total runoff, its components (baseflow, impervious flow, pervious flow), and the process of interception, throughfall, evaporation, storage in hourly resolution (Wang et al., 2008).
The model can be run by using the computer interface of the i-Tree Hydro program (referred to as Hydro hereafter). Newer versions of Hydro (e.g. v5.1, v6) also consider the effect of solid precipitation, which is an important step forward in the investigation of evaporation and interception processes of the winter season. Hydro works with a lot of input parameters: annual precipitation, land cover ratio, evergreen vegetation ratio, surface elevation, soil physics and chemical characteristics.
An important input parameter is the leaf surface index (LAI) and its seasonal variability as it greatly influences interception and evaporation processes. In addition to the leaf surface index, the model uses the bark surface index (BAI), which serves to refine the volume of stem flow volume. These two indices together form the total area index (TAI) that indicates the total surface area of the tree. The Fleaf included in the equation is a built-in metric to consider the change
of canopy extension within a year (Equation (1)).
Consequently, the model handles the interception process in a more complex way than if it was to consider LAI only (Wang et al., 2008; Hirabayashi, 2013).
TAI=LAI×Fleaf+BAI (1)
Three major stages can be separated during the canopy storage process. The first phase is called wetting phase, when water falls on the dry canopy, and is completely absorbed by it. At that time, there is no canopy dripping, as the canopy storage capacity has not reached its maximum. In the saturation phase, whereby the canopy reaches its maximum storage capacity, the excess water drips from the canopy or flows down on the stem to the surface.
Finally, in the drying phase, after the rainfall is over, the typical process is the evaporation, during which the stored water quantity begins to evaporate, and this process lasts until the beginning of the next rain event (Gash, 1979; Móricz et al., 2009; Yaokui & Li, 2014).
These three phases properly describe the processes in the canopy during interception (Xiao & McPherson 2002, 2011).
The model calculates the Base Case results based on real land cover rates. Furthermore, different input data can also be given, which can be used to estimate the effect of a future square renovation or greening. In Alternative Case 1 (referred to as AC1), we focused on the increase of vegetation (we increased the coverage of the vegetation), while in Alternative Case 2 (referred to as AC2), we analyzed the effect of the increased impervious surfaces (the coverage of the vegetation was reduced) (Table 1, Fig. 3).
The major input parameters of the model include the percentage of real land cover. For this process, we used the eCognition 9.1 Developer, which used segmentation-based classification procedures (multi-resolution) to define different categories. For the Hydro, the ratio of trees, shrubs (including the proportion of evergreens), herbaceous cover, open soil surface and impervious surfaces should be defined. In addition, it is necessary to define the cover types beneath tree canopy, which is required for defining the areas involved in infiltration.
The preparation of the main categories was based on a 4-band Ultra Cam X orthophoto (June 2015), with a geometric resolution of 0.4 m. In order to define the evergreens and the cover types beneath tree canopy, we used a leafless orthophoto from March 2011 (with a geometric resolution of 0.1 m). In addition to the two orthophotos, we derived NDVI images from them, and we added a building database and a digital terrain model (DTM) with relative heights (Fig. 3) to
the definition.
The accuracy of the categorization was improved by manual classification; thus the total accuracy of each class was over 85%.
Figure 3. Land cover categories spatial distribution
4. RESULTS AND DISCUSSION
In 2012, 417.7 mm of precipitation fell on Szeged, which is 87% of the average of many years (it means 82,350 m3 of water for the study area). In the same year, the time distribution of precipitation was different than usual, the spring was particularly dry, especially in March, and the precipitation maximum (140 mm) appeared in autumn (compared to the usual late-spring, early-summer average).
According to the average trend, the summer months were the driest period (with only 85 mm of precipitation), and the low precipitation months of winter also corresponded to the average for many years. During the year, monthly precipitation values ranged from 6.7 to 73.80 mm (Fig. 4).
4.1. Base Case results
The total runoff, one of the main outputs of the model, consists of several different components. On the one hand, it contains the baseflow, which can be defined as the water supply from groundwater during the rainless period (Wang et al., 2008).
On the other hand, it includes two components of the surface runoff, including pervious flow and impervious flow. The total runoff volume depends largely on the period's precipitation and land cover, as vegetation-covered surfaces can considerably modify the precipitation volume (interception, evaporation).
Table 1. The land cover categories in the different cases
Trees Herbaceous Shrubs Impervious surfaces Soils Water surfaces
Base Case 22,5% 3,1% 0,1 73,7% 0,5% 0,1%
AC1 35% 14,7% 1% 48,7% 0,5% 0,1%
AC2 17,5% 2,1% 0,1% 79,7% 0,5% 0,1%
Figure 4. The annual rainfall and total runoff
The total runoff on the sample area during the investigation period was 46,336 m3, which is 56% of the annual precipitation arriving in the sample area (Fig. 4).
Total runoff values are strongly related to the precipitation volume; thus the seasonal trends are very similar. The largest runoff volume occurred during the autumn months, of which October was the
Figure 5. The components of annual total runoff
most considerable with its 10,100 m3 of precipitation, which is nearly a quarter of the total annual precipitation. The baseflow was 500 m3 during the year, of which volume was more considerable only in March, because this month there was minimal precipitation, the drainage could only be renewed by
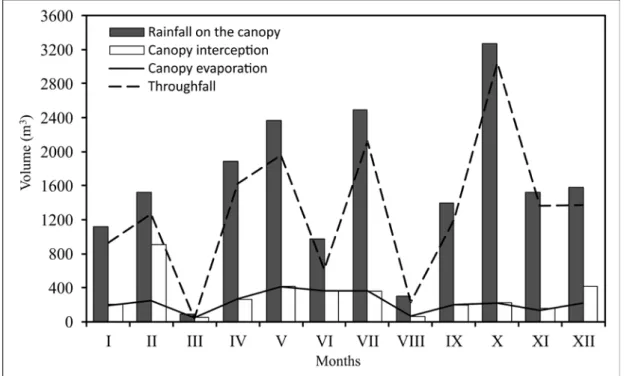
Figure 6. The tree canopy processes related to precipitation
the baseflow. Of the surface runoff, the impervious flow was higher (32.000 m3), which was 69% of the total runoff and 40% of the total volume of precipitation falling on the area. Less than half of this volume (13,000 m3) characterized the pervious surfaces, which is 15.9% of the total precipitation.
Both types of surface runoff reached the minimum during the summer and the maximum in the autumn.
This may be because the moderating processes of vegetation work with high efficiency in the summer as compared to the autumn months, when the vegetation prepares for the winter rest period (Fig. 5).
The model provides hourly resolution data on the process of interception and evaporation. When studying these processes, vegetation was divided into two categories: trees and other vegetation (shrubs, herbaceous). 25.6% of the total precipitation fell on the surface of the vegetation, and 22.5% of the total precipitation reached the tree canopy. It also shows that the impact of other vegetation types on the hydrological processes examined is considerably lower than that of the trees. During interception, trees catch almost 4% of the total annual precipitation (3,600 m3), which is considerable in relation to the area ratio (Fig. 6). The precipitation volume that was not caught by the trees flows as surface runoff, it passes through the canopy without obstacles, and infiltrates into the deeper layers of the soil. The interception efficiency of the trees were outstanding in April and July. It was supported by the fact that the end of the spring and early summer are the most active periods of vegetation and, at the same time, its surface reaches its maximum. The outstanding interception values in February were caused by a larger amount of snow, which was intercepted by the canopy more easily. The model handles solid precipitation differently, so higher interception values are often typical in such cases. The leaf surface evaporation of trees can be significantly influenced by current meteorological parameters (temperature, wind speed, etc.). The months from April to July can be considered as the most active months of the vegetation, the efficiency of evaporation reaches its peak in this period, similarly to the interception processes. The autumn and winter months are balanced, at which time the average monthly evaporation varied between 150-250 m3 (the annual evaporation was 14.7% of the rainfall on the canopy) (Fig. 6). 19.6% of the precipitation (3,600 m3) became part of the interception, so it reached the surface of the canopy. The precipitation reaching the canopy during interception is not fully stored, but a small part of it (about 4.8%) reaches the ground as canopy drop or stemflow. This process is most characteristic of the saturation phase.
The total volume of precipitation reaching the entire tree canopy is 18,500 m3, which includes the precipitation volume captured by the canopy, and the throughfall. During a rainfall event, a major part of the precipitation falls onto the soil or the impervious surface through the gaps of the canopy structure, which is called throughfall. Approximately 80% of the precipitation reaching the canopy becomes part of the throughfall. The rate of interception was the lowest in August, but the highest rate of throughfall happened also this month (Fig. 6).
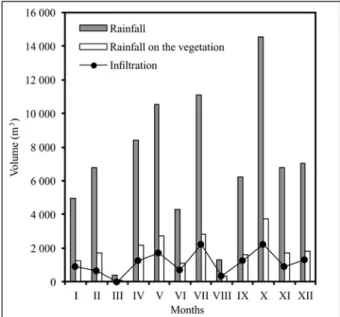
Figure 7. The connection between infiltration and precipitation
The monthly distribution of infiltration was very varied, with values above 60% in the average months, but in some months (March, August), when low precipitation was characteristic, it could vary from positive to negative values considerably. In July, September and December, the results showed an infiltration of over 75%, so there could be a considerable difference depending on precipitation and season (Fig. 7).
4.2. Alternative Cases results
As a result of the changes in AC1, the annual volume of the total runoff would decrease to 35,000 m3 (24.4% decrease), whereas in AC2, it would increase to more than 49,000 m3 (5.7% increase) (Fig 8). Increasing vegetation would lead to decreasing runoff volume, which is illustrated by the change in the annual volume of total runoff. In the Base Case, the pervious flow was 13,000 m3, which increased to 20,000 m3 in AC1, as a result of the higher vegetation rate. It has a basically positive effect on the urban hydrological cycle as the vegetation surfaces have
indirect microclimate modifying effects as well. The positive effect of vegetation on runoff (runoff decreasing) is well illustrated by the fact that the impervious flow in AC1 decreased by nearly a third (14,000 m3), while considerable growth was observed in AC2 (38,000 m3) (Fig. 8).
Figure 8. The runoff components in different cases
Figure 9. The runoff components in different cases (m3/m2)
In addition to absolute data, useful information could be provided by comparing the ratio of the runoff volume and the area of surface type per case. In this research, this ratio did not exceed 0.6 m3/m2 in any case.
Figure 9. shows clearly visible difference between the cases, and the same is true for absolute data analysis.
The value of the total runoff in any cases does not exceed 0.25 m3/m2, but changes in the two components of runoff ratios can be observed, which result from the
modification of the ratio of pervious surfaces and the pervious surfaces beneath the canopies.
There is a considerable change in pervious flow within the total runoff, which is due to changes in the proportion of vegetation surfaces as well as the proportions of pervious and impervious surfaces beneath the canopy. The high m3/m2 values of pervious surfaces are due to the fact that the total area of pervious surfaces (together with the pervious surfaces below the canopy) is low, but it associated with a high runoff value. Another cause of the high runoff value is the fact that despite the high percentage of tree canopy, there is not necessarily a pervious surface beneath the canopy. The ratio of pervious surfaces beneath the canopy (in real landscape cover conditions) was 38.4%, which was left unchanged in each scenario (Fig. 9).
The interception of trees in AC1 would increase to 5,600 m3 as a result of the increase of canopy cover, and the vegetation could catch 6.4% of the total precipitation compared to the 4.4% of the Base Case. Higher interception would contribute to an increase in evaporation, which would be as high as 4,200 m3. As a result of the decrease in vegetation ratio in AC2, less interception would occur (3.4%), and evaporation would also decrease (2,100 m3) (Figs. 10 and 11).
Figure 10. The percentage of tree canopy interception and evaporation in different cases
Compared to the Base Case values, the throughfall volume in the AC1 would increase, but this volume would reach the surface even in the Base Case without being stopped by the canopy. In AC2, throughfall would decrease parallel to decreasing interception, however, in this Case a higher amount of precipitation would reach the surface without the
braking effect of the canopy. The positive effect of the canopy is not only reducing the volume of precipitation reaching the surface, but also modifying its temporal distribution. Due to the braking effect, not the whole amount of precipitation reaches the surface at the same time, thus the chance of urban flash floods is reduced (to a smaller extent). The throughfall rate was 15,700 m3 in the Base Case, while in AC1 it would increase to 24,500 m3, and to around 12,300 m3 in AC2. However, when compared to the change of interception and evaporation values, then AC1 results are the most favorable from the point of view of urban water management. When we compare the precipitation volume falling through the canopy in each case as well as the amount of water infiltrated through the pervious surfaces, AC1 proves to be more effective again. In the Base Case, 15,700 m3 of precipitation fell through the canopy, of which 13,600 m3 infiltrated through the pervious surfaces (beneath the canopy), and only 15% was the runoff. In the AC1, out of the total amount of throughfall (24,600 m3), 24,000 m3 infiltrated, there was only a 2% runoff difference.
Concerning AC2, the difference is 9.5% (Fig. 11).
Figure 11. Comparison of processes in cases
On the whole, AC1 exhibits positive changes in terms of water management when several parameters are taken into account. As the proportion of trees increases, the volume of interception and evaporation also increases, hence reducing the amount of water.
The infiltration volume of pervious surfaces is also more considerable here. By increasing the proportion of vegetation, an increase both in pervious flow and throughfall can be observed. Yet, when comparing opposing processes, the processes improving urban water management are more significant. In the AC2, where vegetation was decreased, those processes are more considerable which can change water management processes in a undesired direction.
4.3. Interaction of vegetation during a rainfall event
As the Hydro model allows the analysis of the precipitation and related processes (interception,
evaporation, etc.) in hourly resolution, it is possible to analyze heavy rainfall events as well. In our example, we examined a period of 72 hours, from July 24, 0:00 to 23:00 July 26, in 2012 (the following figures are in UTC, and Szeged is in CEST: UTC+2).
The reason for its selection was that there was no precipitation before and after the rainfall event for a long time, thus there were no "distorting" effects on the recharge and discharge of the storage capacity.
The active rainfall event lasted for 17 hours (between July 24 13:00 and July 25 6:00), it was the 5th largest continuous rainfall event in the year. During this time.
3,825 m3 (20.13 mm) of liquid precipitation fell. The examined period can be divided into two parts, in the first one there were several smaller rainfall, while in the second there was a larger rainfall of 1,600 m3 (which fell on the sample area in about 1 hour).
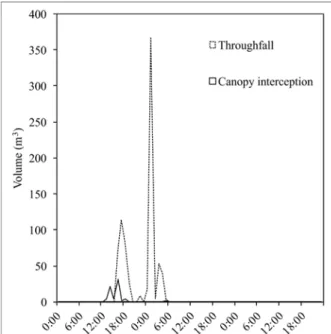
Figure 12. Canopy processes during a heavy rainfall event
22% of the total precipitation reached the surface of the tree canopy, so this volume was the basis for further processes. At the beginning of the rainfall event, directly after the precipitation had reached the surface of the canopy, the interception processes also became active. The precipitation volume affecting the canopy and interception are equal until the canopy storage of the trees reaches its maximum, which was 56 m3 in this case. After reaching maximum storage capacity, interception was reduced, and the excess water became part of the throughfall. It can be observed at two points of time, at 15:00 and 17:00 (Fig. 12). During the 1,600 m3 rainfall, leaf surface was already saturated and could not absorb any excess precipitation.
This condition continued until the end of the rainfall event, after which the stored water volume
started to empty, which took 14 hours.
Figure 13. Canopy storage during a heavy rainfall event Approximately 48 hours elapse between the beginning of the interception and the end of the drainage during a similar rainfall event, which depends largely on the condition and complexity of the canopy and the main meteorological parameters. The volume of stored water depends on the volume of water reaching the leaf surface during interception, so there is a very close relationship between the two processes (Fig. 13). Hydro calculates the storage cumulatively, so its quantity and duration exceed that of interception. Draining the stored water quantity is a several-hour-long process that can begin after the rainfall is over. The volume of stored water becomes steady after the storage capacity has reached its maximum at 56 m3, and this condition is maintained until there is precipitation (Fig. 13). If there is a longer time period between two rain events, the stored water volume can reach the level at which the vegetation will again be able to intercept water. In Hydro, the evaporation and interception volumes are the same during the examined period, but the time distribution of the two processes is different (Fig. 13). In the interception, there is a sudden, sharp increase at the beginning of the rainfall event. Evaporation occurred during the whole examined period, it reached its peak after the end of the rainfall, as the rainfall no longer inhibited the evaporation.
If throughfall is compared with interception and storage, we can get an overview of the process of the saturation of the canopy. The process of throughfall becomes a major process from the time when the canopy starts to reach its maximum storage capacity. At the very beginning of the rainfall, interception was fully effective, but at 16:00 a part of
the rain had already fallen through the canopy. At 0:00, the canopy was already in the saturation phase and its storage capacity reached its maximum, so the precipitation fell through the canopy then.
In addition to the Base Case, the alternative scenarios illustrate the difference between the effect of changed land cover conditions on a certain rainfall event. 35% of the total precipitation in AC1 fell onto the canopy surface.
Figure 14. Canopy processes during a heavy rainfall event at AC1
In the AC1, the processes have a run similar to those of the Base Case. Nevertheless, the maximum storage capacity increased to 90 m3 and the interception volume rose to 50 m3. This 1.5-time increase characterizes the effect of canopy coverage increase well in relation to the reduction of surface runoff. The characteristics of the three main phases of canopy storage are also reflected in the course of the rainfall event (Fig. 14). The characteristic feature of the wetting phase is that the volume of storage increases together with the proportion of interception, but evaporation processes also work. The canopy storage capacity reached its maximum in the saturation phase, and as a result, the canopy could not absorb and evaporate any excess precipitation during the interception or evaporation. In the drying phase, the volume of water stored in the canopy began to drain at the end of the rainfall, due to evaporation, and the canopy drip induced by gravity.
5. CONCLUSION
The undesirable effects of climate change are already causing major problems in the everyday life of cities, where urban waters and their environmental impacts are important factors. The specific feature of
urbanization processes is the increasing amount of impervious surfaces, which contributes to increased surface runoff. In addition to discharging and storing the waters in the urban watershed, it is important that their integration is implemented in a sustainable manner. The role of green infrastructure and vegetation (especially woody vegetation) in urban water management has been a scientific area that has been neglected for a long time, although the overload of sewer system can be reduced with their application.
Various water management and hydrology models, such as UFORE-Hydro used in our study, can serve as suitable tools for examining processes. Our study focused on the role of vegetated surfaces in urban water balance, paying particular attention to their impact on runoff. In order to produce the basic data needed to run the model, we prepared a detailed land cover map using segmentation-based classification.
In addition to the Base Case, which was based on real land cover, changes in the proportion of vegetation and impervious surfaces were illustrated by the Alternative Cases. The cases presented in the study support the assumptions that vegetation can considerably contribute to the reduction of surface runoff.
Reducing green surfaces and increasing impervious surfaces can lead to unfavorable hydrological effects, and they can also considerably reduce the moderating mechanisms of vegetation.
Within the vegetation, the largest amount of water was captured by the trees, which was the result of their spatial proportions as well as their structural characteristics. Interception was more effective at the end of spring and in early summer, as this period is the most active period of the vegetation. The throughfall is basically higher in those periods when the precipitation volume is lower, but frequent, heavy rainfall events are more typical. The comparison between the cases show that increasing vegetation surfaces can move the processes in the right direction from the point of view of water management, as the increased interception and evaporation contribute to the reduction of runoff.
Examining shorter rainfall events which last less than 72 hours, the canopy can be saturated within a relatively short time, but it can still capture significant amounts of rainwater. Similar studies can provide an overview of the processes occurring in the vegetation during rainfall events, and later we have the opportunity to make seasonal comparisons.
Based on our and other studies the blue-green infrastructure can play a major role in the urban water management. The vegetation in urban environment is not available in the adequate quantity and quality;
even so it can make significant contribution to
improve the urban hydrological cycle artificial state.
The vegetation contributes to the infiltration efficiency with its roots and it reduce the volume of surface runoff. With the process of interception and evaporation the vegetation can reduce the amplitude of surface runoff, thus indirectly decreases the soil erosion on watershed also. The vegetation as a part of the blue-green infrastructure system annually can make a major contribution for a nature-based system.
The urban planners need to recognize the green and blue infrastructure only work effectively if we utilize it as a complex network.
The impact of vegetation can also be detected on a smaller sample area, but the analysis can be interpreted on a larger scale (when taking into account more sample areas in Szeged), extending the scope of green infrastructure to support urban planning.
REFERENCES
Bahmani, S. M., Attarod, P., Bayramzadeh, V., Ahmadi, M. T. & Radmehr, A., 2012.
Throughfall, stemflow, and rainfall interception in a natural pure forest of chestnut-leaved oak (Quercus castaneifolia C.A. Mey.) in the Caspian Forest of Iran. Annals of Forest Research 55(2):197-206.
Balázs, B., 2008. Az átlagos városi hősziget területi szerkezetének modellezése és a modell kiterjesztése.
Doctoral dissertation, Szeged
Berland, A., Shiflett, S. A., Shuster, W. D., Garmestani, A. S., Goddard, H. C., Herrmann, D .L., &
Hoptonc, M. E., 2017. The role of trees in urban stormwater management. Landscape and Urban Planning 162 167–177.
Brears, R. C,. 2018. Blue and Green Cities. Palgrave Macmillan. p. 318.
Buzás, K., (ed.) 2012. Települési csapadékvíz- gazdálkodás. Budapest: TERC Kereskedelmi és Szolgáltató Kft, 148 p.
Credit Valley Conservation, 2010. Low impact development stormwater management planning and design guide (Version 1.0) Credit Valley Conservation, Toronto and Region Conservation Authority
Dietz, M. E., 2007. Low Impact Development Practices: A Review of Current Research and Recommendations for Future Directions, Water Air Soil Pollut 186:351–363
Fazio, J. R., 2010. How Trees Can Retain Stormwater Runoff. Tree City USA Bulletin No. 55.
Federal Interagency Stream Restoration Working Group (FISRWG), 1998. Stream Corridor Restoration: Principles, Processes, and Practices.
By the (15 Federal agencies of the US gov't).
Fletcher, T. D., Shuster, W., Hunt, W. F., Ashley, R., Butler, D., Arthur S., Trowsdale, S., Barraud, S., Semadeni-Davies, A., Bertrand-Krajewski, J-L.,
Mikkelsen, P. S., Rivard, G., Uhl, M., Dagenais, D. & Viklander, M., 2015. SUDS, LID, BMPs, WSUD and more – The evolution and application of terminology surrounding urban drainage. Urban Water Journal, 12:7, 525-542.
Frantzeskaki, N., 2019. Seven lessons for planning nature-based solutions in cities. Environmental Science & Policy, Volume 93, P. 101-111.
Gash, J. H., 1979. An analytical model of rainfall interception by forests. Q.J.R. Meteorol. Soc., 105:
43-55.
Gayer, J., & Ligetvári, F., 2007. Települési vízgazdálkodás csapadékvíz elhelyezés.
Környezetvédelmi és vízügyi minisztérium, Budapest
Haase, D., 2015. Reflections about blue ecosystem services in cities. Sustainability of Water Quality and Ecology 5, 77–83. 61
Haidu, I., & Ivan, K., 2016. The assessment of the impact induced by the increase of impervious areas on surface runoff. Case study the city of Cluj-Napoca, Romania. Carpathian Journal of Earth and Environmental Sciences, Vol. 11, No 2, p. 331 – 337.
Herrera Environmental Consultants Inc., 2008. The effects of trees on stormwater runoff. Herrera Environmental Consultants, Inc., Seattle.
Hirabayashi, S., 2013. i-Tree Streets/Design/Eco rainfall interception model comparisons. Retrieved from http://www.itreetools.org/eco/resources/iTree Streets Design Eco Rainfall Interception Model Comparisons.pdf (30.01.14).
Holder, C. D., & Gibbes, C., 2016. Influence of leaf and canopy characteristics on rainfall interception and urban hydrology. Hydrological Sciences Journal – Journal Des Sciences Hydrologiques, 62:2, 182-190 Huang, J. Y., T. A., Black, Jassal, R. S. & Les
Lavkulich, L. M., 2017. Modelling rainfall interception by urban trees. Canadian Water Resources Journal / Revue canadienne des ressources hydriques, 42(4), 336–348.
Iojă, C. I., Grădinaru, S. R., Onose, D. A., Vânău, G. O.
& Tudor, A. C., 2014. The potential of school green areas to improve urban green connectivity and multifunctionality. Urban Forestry & Urban Greening, Volume 13, Issue 4, P. 704-713.
Jayasooriya, V. M. & Ng, A.W. M., 2014. Tools for Modeling of Stormwater Management and Economics of Green Infrastructure Practices: a Review, Water Air Soil Pollut (2014) 225: 2055.
Jha, A. K., Bloch, R. & Lamond, J., 2012. Cities and Flooding : A Guide to Integrated Urban Flood Risk Management for the 21st Century. World Bank.
Johnstone, P., Adamowicz, R., de Haan F. J., Ferguson, B. & Wong, T., 2012 Liveability and the Water Sensitive City ‐ Science ‐ Policy Partnership for Water Sensitive Cities. Melbourne, Australia:
Cooperative Research Centre for Water Sensitive Cities
Kolcsár, R. A., & Szilassi, P., 2018. Assessing
accessibility of urban green spaces based on isochrone maps and street resolution population data through the example of Zalaegerszeg, Hungary, Carpathian Journal of Earth and Environmental Sciences, Vol. 13, No. 1, p. 31 – 36 Központi Statisztikai Hivatal (KSH)., 2013. 2011. évi
népszámlálás, Központi Statisztikai Hivatal Kuehler, E., Hathaway, J. & Tirpak, A., 2017.
Quantifying the benefits of urban forest systems as a component of the green infrastructure stormwater treatment network. Ecohydrology. 2017;10:e1813.
Liu, C. M., Chen, J. W., Hsieh, Y. S., Liou, M. L. &
Chen, T. H., 2015. Build Sponge Eco-cities to Adapt Hydroclimatic Hazards. In: Leal Filho W.
(eds) Handbook of Climate Change Adaptation.
Springer, Berlin, Heidelberg
Mezősi, G., Blanka, V., Ladányi, Zs., Bata, T., Urdea, T., Frank, A. & Meyer, B. C., 2016. Expected mid- and long-term changes in drought hazard for the south-eastern Carpathian Basin. Carpathian Journal of Earth and Environmental Sciences, Vol.
11, No 2, p. 355 - 366
Móricz, N., Gálos, B. & Gribovszki, Z., 2009. Az erdők intercepciójának mérési és modellezési lehetőségei. Hidrológiai Közlöny. 89. (4) 35–45.
Péczely. Gy., 1979 Éghajlattan. Nemzeti tankönyvkiadó, Budapest
Raymond, C.M., Berry P., Breil,, M., Nita, M.R., Kabisch N., de Bel, M., Enzi, V., Frantzeskaki, N., Geneletti, D., Cardinaletti, M., Lovinger, L., Basnou, C., Monteiro, A., Robrecht, H., Sgrigna, G,. Munari, L. & Calfapietra, C., 2017. An Impact Evaluation Framework to Support Planning and Evaluation of Nature-based Solutions Projects.
Report prepared by the EKLIPSE Expert Working Group on Nature-based Solutions to Promote Climate Resilience in Urban Areas. Centre for Ecology & Hydrology
Romnée, A., Evrard, A. & Trachte, S., 2015.
Methodology for a stormwater sensitive urban watershed design, Journal of Hydrology, Volume 530, Pages 87-102.
Szelepcsényi, Z., Breuer, H., Ács, F. & Kozma, I., 2009.
Biofizikai klímaklasszifikációk 2. rész:
magyarországi alkalmazások, LÉGKÖR – 54. Évf.
4. Szám
Unger, J., & Gál, T., 2017. Városklíma: Szeged városklimatológiai vonatkozásai. Szeged, GeoLitera, 256 p.
United Nations Environment Program., 2009.
Rainwater harvesting: a lifeline for human well- being.
United States Environmental Protection Agency, (US EPA)., 2007. Reducing Stormwater Costs through Low Impact Development (LID) Strategies and Practices. Report No. EPA 841-F-07-006.
Washington, D.C.
Wang, J., Endreny, T. A., & Nowak, D. J., 2008.
Mechanistic simulation of tree effects in an urban water balance model. Journal Of The American
Water Resources Association Vol. 44, No. 1 Xiao, Q., & McPherson, E. G., 2011. Rainfall
interception of three trees in Oakland, California.
Urban Ecosyst 14:755–769
Xiao, Q., & McPherson. E. G., 2002. Rainfall interception by Santa Monica’s municipal urban forest. Urban Ecosystems, 6: 291–302
Yaokui, C. & Li, J., 2014. A Modified Gash Model for Estimating Rainfall Interception Loss of Forest Using Remote Sensing Observations at Regional Scale. Water (2014), 6
Received at: 07. 05. 2019 Revised at: 28. 06. 2019
Accepted for publication at: 22. 07. 2019 Published online at: 24. 07. 2019