Electrosynthesis and Properties of Crystalline and Phase-Pure Silver Orthovanadate
Abbas Vali, Peter S. Toth, Hyung-Woo Jee, Farinaz Firouzan, Csaba Janáky, Ki-Jung Paeng, Noseung Myung, and Krishnan Rajeshwar*
Cite This:https://dx.doi.org/10.1021/acs.jpcc.0c05421 Read Online
ACCESS
Metrics & More Article Recommendations*
sı Supporting InformationABSTRACT: Interest in silver-based semiconductors dates to the early years of analog photography. On the other hand, the recent discovery of new silver oxide-based ternary semiconductors has caused a resurgence of interest in these compounds for new technologies. In this vein, the present study provides a counter example to the two perennial issues confronting the electrosyn- thesis of compound semiconductor films, namely, those of crystallinity and phase purity. It is shown here, for the first time, that a two-step electrosynthesis strategy yields crystalline and phase-pure α-Ag3VO4 films on transparent, conductive oxide substrates under very mild process (ambient temperature and pressure) and time-efficient (minutes synthesis duration) con-
ditions. A complementary suite of experimental methods and thermodynamics/kinetics analyses facilitated a deep understanding of the electrosynthesis mechanism, optoelectronic behavior, semiconductor band structure, thermal and electrochemical stability, and electrochemical/photoelectrochemical attributes.
1. INTRODUCTION
Silver oxide-based semiconductors are attractive for a variety of important technological applications.1Therefore, much recent fundamental and practical interest has focused on ternary silver vanadates generated from the two binary oxide components, namely, Ag2O and V2O5. These vanadates exhibit a fascinating range of Ag2O:V2O5stoichiometries (1:7, 1:2, 1:1, 2:1, 3:1; see Figure 1 in ref2). In particular, Ag3VO4with the highest ratio of Ag2O: V2O5 (3:1) has attracted considerable interest.3−8 Further, attesting to the practical importance of this material, a variety of heterojunctions and composites derived from Ag3VO4have been deployed for solar energy conversion and photocatalytic remediation of environmental pollutants.9−27 Other potential applications in the sensor and bactericidal/
virucidal areas portend a bright future for this material.
Silver orthovanadate (Ag3VO4) exhibits up to three different polymorphs, namely,α,β, andγphases.28,29Theα-phase (α- Ag3VO4) is the stable form at room temperature.28,29 α- Ag3VO4is converted toβ-Ag3VO4reversibly at 110°C.29The famatinite-phase (β-Ag3VO4) is stable in the temperature range 110−414 °C, while γ-Ag3VO4 is stable in the temperature range 414−530 °C.29 α-Ag3VO4 has a monoclinic structure with space group C2/c, while β-Ag3VO4 has a tetragonal famatinite (Cu3SbS4-type) structure withI4̅2mspace group.29 The γ-form adopts a cubic structure with space groupF4̅3m and has been rarely studied.29However, the crystal structure
aspects of theα- andβ-polymorphs are well described in the literature.28,29
Semiconductor type (whether n- or p-type), optical band gap, band edge positions, quantum efficiency, or chemical/
electrochemical/photoelectrochemical stability are all crucial factors in many technological applications such as those identified above. Barring a theoretical study28 on the semiconductor behavior ofα-Ag3VO4, based onfirst-principles electronic structure calculations, that predicted p-type behavior for α-Ag3VO4, very little exists on the above factors in the relevant literature. This gap mainly prompted the present study.
Silver orthovanadate has been synthesized using a variety of methods including hydrothermal (most common), solid state (ceramic), precipitation, successive ionic layer adsorption and reaction (SILAR), combinatorial sputtering, anodic oxidation, or pulsed laser deposition.1−8,30Conspicuous by its absence is the use of electrodeposition31−35 for Ag3VO4 film synthesis.
Given the versatility and recent popularity of electrosynthetic procedures in general,31−35this omission is rather surprising.
Received: June 15, 2020 Revised: July 27, 2020 Published: August 17, 2020
© XXXX American Chemical Society A
https://dx.doi.org/10.1021/acs.jpcc.0c05421 J. Phys. Chem. CXXXX, XXX, XXX−XXX
Downloaded via UNIV OF SZEGED on September 9, 2020 at 11:18:48 (UTC). See https://pubs.acs.org/sharingguidelines for options on how to legitimately share published articles.
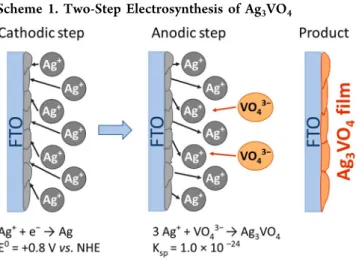
This paper therefore describes the application of a two-step, hybrid cathodic−anodic approach (Scheme 1) for the
electrodeposition ofα-Ag3VO4films on transparent, conduct- ing oxide glass (fluorine-doped tin oxide or FTO) substrates. A companion study from our group2 on the 1:1 Ag2O−V2O5 ternary compound, namely AgVO3, recently appeared, and overlapping aspects are identified below. By judicious variation of the electrodeposition medium pH in the second step and considering Pourbaix-type36 speciation of the vanadium species, the product could be routed to the targeted α- Ag3VO4 phase instead of the AgVO3 composition studied earlier. We believe this to be one of the many innovative aspects of this study, which is the first report on Ag3VO4 electrosynthesis. We show below that it is possible to electrosynthesize α-Ag3VO4 with a high hole concentration;
this result is significant in the light of a materials design study28 that had predicted a near-perfect stoichiometry and an experimentally verified low conductivity limit.
2. METHODS
2.1. Materials. Silver nitrate [AgNO3 (Alfa Aesar)] and sodium orthovanadate [Na3VO4(Alfa Aesar)] were used as Ag and V source, respectively, for the electrodeposition bath.
Acetonitrile [CH3CN (Sigma-Aldrich)] and double-distilled water (H2O) were used as the solvent to make up the various electrolytes used in this study. Other chemicals were as
detailed in ref 2. All the chemicals were used as received without further purification.
2.2. Electrosynthesis ofα-Ag3VO4 Film.The substrate supporting thefilm was FTO (cf.,Scheme 1) (details of FTO in ref2) in all the experiments discussed below. Potentiody- namicfilm growth was used in thefirst step, and the potential was swept 10 times from +0.15 to−0.80 V at 25 mV/s scan rate and 20 s resting time between cycles. Other procedural details associated with thefirst step were given in ref2. In the second step, the prepared silver thinfilm on the FTO substrate served as the working electrode. The silver thin film was stripped anodically in sodium orthovanadate solution (40 mM) to generate Ag+ and instigate subsequent in situ deposition (Scheme 1). An alkaline medium (pH: 12.2) enabled speciation of V as VO43−, and this step is further elaborated below.
2.3. Physical and Electrochemical/Photoelectrochem- ical Characterization. Instrumentation for voltammetry, photoelectrochemistry experiments, electrochemical quartz crystal microgravimetry (EQCM), X-ray diffraction (XRD), energy-dispersive X-ray analysis (EDX), diffuse reflectance spectroscopy (DRS), surface photovoltage spectroscopy (SPS), and ambient pressure UV photoelectron spectroscopy (AP- UPS) is detailed elsewhere.2,37−41
The morphology of the electrodeposited Ag3VO4 samples was investigated by using scanning electron microscopy (SEM) with an APREO C SEM microscope (ThermoFisher Scientific), operating at 10 kV. Particle size histogram analyses were performed on a pool of 300 particles from the SEM images using ImageJ software. Transmission electron micros- copy (TEM) was performed on a FEI Tecnai G220 X-Twin microscope, operating at an acceleration voltage of 200 kV.
Samples for TEM were prepared by scratching the as- deposited Ag3VO4 layer from the FTO substrate and subsequently dispersing the nanoparticles in ethanol. This suspension was drop cast onto a carbon-coated copper grid (Electron Microscopy Sciences). Fast Fourier transform (FFT) images from different areas of the TEM images were obtained using ImageJ software. Laser Raman spectra of samples were acquired on a Senterra II Compact Raman microscope (Bruker), using an excitation line of 532 nm (2.33 eV) with a 50× objective and an incident power of ≤2.5 mW. Peaks werefitted with Lorentzian shape functions.
Scheme 1. Two-Step Electrosynthesis of Ag3VO4
Figure 1.(a) Linear sweep voltammmogram () and the corresponding EQCM frequency change (···) for the electrodeposition of silver orthovanadate at 20 mV/s potential scan rate. (b) A Sauerbrey plot derived from the EQCM−voltammetry data.
https://dx.doi.org/10.1021/acs.jpcc.0c05421 J. Phys. Chem. CXXXX, XXX, XXX−XXX B
3. RESULTS AND DISCUSSION
3.1. Mechanistic Insights into the Two-Step Electro- deposition ofα-Ag3VO4.Mechanistic details of cathodic Ag thinfilm growth on the FTO substrate (Scheme 1) were given elsewhere2 and need not be repeated here.
In the second anodic step (Scheme 1), this silverfilm was stripped anodically to generate Ag+(reaction 1) in an aqueous solution of sodium orthovanadate (pH: 12.2 via base hydrolysis). Subsequent in situ precipitation of these ions with VO43−, driven by the low solubility product for Ag3VO4 (Ksp= 1.0 ×10⁻²⁴)42yielded a brownish yellow Ag3VO4film on the substrate(reaction 2).
E
Ag(s)→Ag(aq)+ +e− 0= +0.800 V vs NHE (1)
K
3Ag(aq)+ +VO43−(aq) →Ag VO3 4(s) sp=1.0 ×10⁻²⁴ (2) Figure 1a contains a linear sweep voltammogram (solid line) and the corresponding EQCM frequency change (dotted line) during anodic stripping. The frequency decrease along the oxidation wave domain is diagnostic of mass gain and the electrodeposition of a film (presumably Ag3VO4) on the Pt- coated quartz surface. Further insight into the deposition mechanism can be gleaned by combining the EQCM and coulometric data for the oxidation:43−45
i kjjj y{zzz
Q nFk
M f
= − Δ
(3) whereQis the charge consumed,Fis the Faraday constant,Δf is the frequency change,kis the Sauerbrey constant,43−45and Mis the molar mass of the deposit. By constructing aQversus
−Δf “Sauerbrey plot” (Figure 1b), one can calculate the electron stoichiometrynfrom the slope. The calculatednvalue from the least-squaresfitted slope was 3.05, very close to the value expected from the following reaction:
E
3Ag VO Ag VO 3e
0.326 V vs NHE
(s) 4
3
(aq) 3 4(s)
0
+ → +
= −
− −
(4) The slight lag in the mass gain or frequency change onset relative to the currentflow onset inFigure 1a is reminiscent of the trend seen earlier for AgVO3 and signals the fact that deposition and nucleation/growth of Ag3VO4 is also a slow process. Figure S1 shows a photograph of the color change associated with the silver→silver orthovanadate conversion.
A high pH aqueous medium (pH: 12.2) is needed for the anodic stripping step to provide the dominant VO43− species needed for subsequent Ag3VO4film growth. For example, in the pH range from 9 to 12, V2O74−species will be dominant, and in the pH range from 6 to 9, VO3− species will be dominant.46 However, meriting scrutiny is the possible formation of silver hydroxide (AgOH) as a side product because of the preponderance of OH−in high pH media (15.9 mM OH− at pH: 12.2) by in situ precipitation of Ag+ with OH−(reaction 5). Nonetheless, the EQCM results presented above and the physical characterizations (discussed in the next section) are consistent with a phase-pure Ag3VO4 film from electrodeposition.
Thermodynamics and kinetics provide the answer to the dichotomy of possible AgOH formation. When Ag+ is produced during anodic stripping, in situ precipitation of Ag+
with OH− (reaction 5) and subsequent reaction(reaction 6) can produce Ag2O:
K
Ag(aq)+ + OH(aq)− →AgOH(s) sp=2.0×10⁻⁸ (5) G
2AgOH Ag O H O 21.98 kJ/mol
(s)→ 2 (s)+ 2 (l) Δ °= −
(6) The sum of reactions 1, 5, and 6 produces the Ag2O formation reaction as
E
2Ag 2OH Ag O H O 2e
0.343 V vs NHE
(s) (aq) 2 (s) 2 (l)
0
+ → + +
= −
‐ −
(7) When Ag+is produced during anodic stripping, both VO43−
and OH− compete to capture the silver cation (reaction 2vs reaction 5). Because the solubility product constant (Ksp) of Ag3VO4 (1.0 × 10⁻²⁴)42 is significantly lower than that of AgOH (2.0 × 10⁻⁸)47 and the concentration of VO43− (40 mM) is higher than that of OH− (15.9 mM, see above), the possibility of formation of Ag3VO4will be significantly higher than that of Ag2O. Our experimental results bear out these expectations.
3.2. Physical Characterization of the Silver Orthova- nadate Film.Morphological examination of the as-prepared sample by SEM revealedfilm nucleation/growth in the form of semispherical nanoparticles (see Figure 2). The electro-
deposited films had a mesoporous structure (Figure 2A), reflecting the formation of the semiconductor particles through precipitation in the second electrochemical step. The high- resolution image (Figure 2B) suggested a relatively broad size distribution of the as-prepared particles. Upon statistical analysis, the mean diameter of the particles was in the range of 90 to 110 nm, as deduced from the histogram presented in Figure S2.
Elemental EDX maps (not shown) indicated uniform film deposition across the entire FTO surface. Specifically, no regions rich in silver could be found, for example. Composi- tional EDX assays averaged from different spots of sample were consistent with the Ag/V ratio: 2.92± 0.02; a representative EDX trace is shown in Figure S3 inSupporting Information.
Transmission electron microscopy (TEM) images (Figure S4A) complemented the SEM data in Figure 2 on the morphology of the as-deposited Ag3VO4 nanoparticles in the film being composed of raspberry-like structural domains.
Selected area electron diffraction (SAED) pattern revealed the crystalline features (Figure S4B) to be poly- rather than single crystalline. A lattice-resolved high-resolution TEM image (Figure 3A) and the corresponding fast Fourier transform Figure 2. Representative scanning electron micrographs of an as- prepared silver orthovanadate film on FTO substrate at different magnifications. Representative top-view (A) and high-resolution (B) images.
https://dx.doi.org/10.1021/acs.jpcc.0c05421 J. Phys. Chem. CXXXX, XXX, XXX−XXX C
(FFT) patterns (Figure 3B,C) showed (301) and (202) crystal planes with 0.161 and 0.190 nm d-spacing, respectively.29,48 These results underline that the electrodeposited Ag3VO4was highly crystalline and had a monoclinic structure.
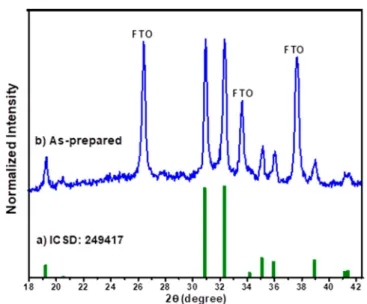
Significantly, XRD data on the as-preparedfilm (Figure 4) supported the TEM data in that the synthesized film was
crystalline (even without thermal anneal) in phase-pure α- Ag3VO4form. In other words, thefilms were crystalline even though the electrodeposition was performed at room temper- ature. Nonoptimalfilm morphology (amorphous nature) and contamination with side products are perennial Achilles heels of the electrosynthesis approach.31,37−41 Clearly, the present study demonstrates that these handicaps are not always problematic and that good crystallinity can be obtained even under mild process conditions.
The as-prepared silver vanadate samples were analyzed by laser Raman spectroscopy to investigate the degree of structural order−disorder, as well as to confirm phase purity.
Figure 5shows laser Raman spectra of α-Ag3VO4synthesized under optimal conditions, a Ag4V2O7containing specimen, and
a AgxVOy sample, corresponding to a nonstoichiometric composition. Two B2g Raman-active modes at 810 and 830 cm−1correspond to the vibration of the distorted tetrahedral [VO4] cluster, derived from the symmetric-stretching.49 The Raman spectra of Ag4V2O7characterized by one single band at about 870 cm−1typical of tetrahedral andfive-fold coordinated vanadates. Additionally, the active vibration bands at higher Raman shifts (around 900, and 950 cm−1)50correlate well with octahedrally coordinated vanadate species. These data further confirm our conclusions from the XRD data on the phase purity of the electrodepositedα-Ag3VO4films.
The as-prepared α-Ag3VO4 film was annealed at four different temperatures (150, 200, 250, and 300 °C) for 1 h to map the effect of anneal temperature on crystallinity and thermal stability of the as-prepared sample. The XRD results (Figure S5) showed that the crystalline phase of the as- prepared sample after annealing at 150°C and 200°C was not altered, and thefilm remained in theα-Ag3VO4form. On the other hand, the XRD pattern of the annealed sample at 250°C showed that the α-Ag3VO4 peaks had disappeared. Further increasing the anneal temperature to 300 °C completely decomposed the α-Ag3VO4 film to Ag4V2O7and Ag (Figure S5). The morphological and elemental EDX maps of the annealed sample at 350°C (Figures S6 and S7) showed that uniform dispersed semispherical nanoparticles of as-prepared Ag3VO4had transformed to semispherical microparticles and nanobars. The EDX elemental maps (Figures S8 and S9) showed that the semispherical microparticles were composed of pure silver. The nanobars were composed of Ag4V2O7with a Ag/V ratio: 1.92± 0.02.
Thermodynamic calculations for possible Ag3VO4 decom- position reactions (reactions 8−12) showed that the decomposition of Ag3VO4 was endothermic in all the cases.
However, the pathway forming Ag4V2O7and Ag(reaction 8) had the lowest Gibbs free energy (ΔG0), consistent with the above experimental observations.
G Ag VO 1
2Ag V O Ag 1
4O 0.609 eV
3 4 4 2 7 2
→ + + Δ o = +
(8) Figure 3.High-resolution TEM (A) and FFT (B, C) images from
different areas of the Ag3VO4 specimen. Different crystal planes are marked by red dashed (301) and blue solid (202) lines in A, respectively. Scale bars in B and C correspond to 5 nm−1.
Figure 4. XRD patterns for (a) reference α-Ag3VO4 and (b) electrodeposited sample.
Figure 5.Laser Raman spectra of as-prepared silver vanadate samples (α-Ag3VO4, Ag4V2O7, and AgxVOy). The Raman-active modes are indicated by the dashed lines.
https://dx.doi.org/10.1021/acs.jpcc.0c05421 J. Phys. Chem. CXXXX, XXX, XXX−XXX D
G Ag VO AgVO 2Ag 1
2O 0.643 eV
3 4 3 2
→ + + Δ o= +
(9) G
Ag VO 3
2Ag O 1
2V O 0.808 eV
3 4 → 2 + 2 5 Δ o= +
(10) G
Ag VO 3Ag 1
2V O 3
4O 1.07 eV
3 4 2 5 2
→ + + Δ o= +
(11) G
Ag VO3 4 →3Ag+V+2O2 Δ o = +8.39 eV (12) Standard Gibbs free energy data for the above reactions were culled from thermodynamic data compilations in the literature.46,47
3.3. Optical Behavior.The UV/visible spectrum of an as- prepared sample (after transformation of the DRS data, ref52) showed an absorption onset wavelength of ∼575 nm (see Figure S10).Table 1presents a comparison of this value with
those reported in the literature for samples prepared using other synthesis methods. There is some scatter in the reported values due to the uncertainty in the estimation of the onset value from the spectral information (for example, note the presence of a “tail” in Figure S10). This issue has been addressed by us and other authors elsewhere.52,53Nonetheless, a safe conclusion can be made that the onset wavelength cutoff for electrodepositedα-Ag3VO4is in the range of 560−580 nm (the two values of 613 and 615 nm from refs25 and 14are outliers).
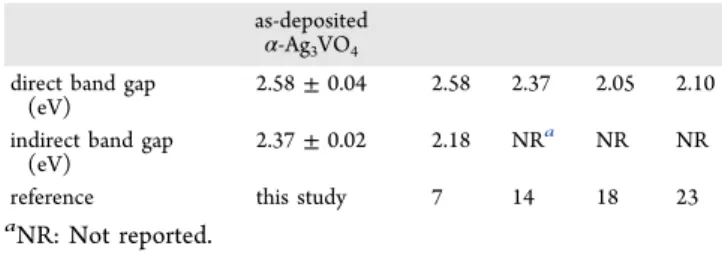
Tauc plots51−53were constructed from the UV/visible DRS data. Figure 6a,b contains these plots for direct and indirect optical transitions in the as-deposited α-Ag3VO4 sample; the corresponding energy band gaps were 2.58±0.04 eV and 2.37
±0.02 eV, respectively.Table 2presents a comparison of these values with those reported in the literature for samples derived from other synthesis methods. There is some scatter in the
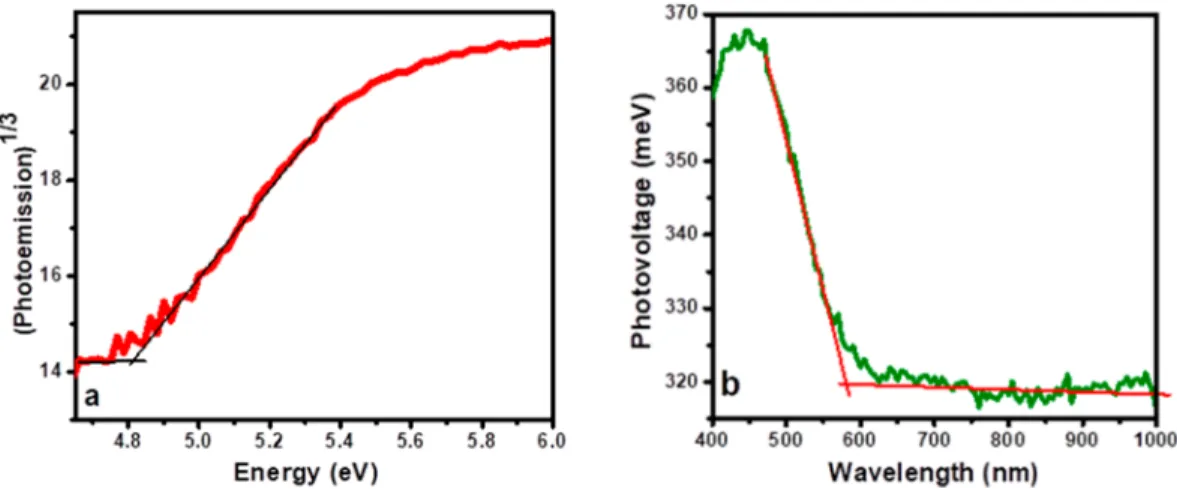
reported values of the energy band gaps (Table 2). Once again, this issue has been discussed by us and others elsewhere.52,53 3.4. Electronic Band Structure ofα-Ag3VO4.Ambient- pressure UV photoelectron spectroscopy (AP-UPS) was used to map the valence band maximum (VBM) in α-Ag3VO4. Figure 7a contains the data; the VBM is located at the intercept of the plot. The value of VBM is−4.82±0.03 eV on the vacuum energy scale. Surface photovoltage spectroscopy (SPS) was deployed to measure the (surface) band gap of as- prepared α-Ag3VO4. Figure 7b contains the data; from the intercept of this spectrum, the band gap was measured as 2.16
± 0.03 eV. Note that the measured photovoltage onset wavelength (∼620 nm) is higher than the measured absorbance onset wavelength (∼575 nm, see above) by the DRS method. This difference possibly originates from the variant sensitivity of SPS and DRS to the surface properties.
Specifically, sub-band gap energy levels are important on the semiconductor surface, and SPS is more sensitive to the surface properties than DRS.54 The net result is that the measured photovoltage onset wavelength (∼620 nm) is higher than the absorption onset wavelength (∼575 nm).
The positive photovoltage polarity at energies higher than band gap (Figure 7b) is diagnostic of p-type semiconductor behavior forα-Ag3VO4.55This is in good agreement with the theoretical results.28 The Fermi level (EF) of α-Ag3VO4 was measured by using Kelvin-probe spectroscopy. Figure S11 contains the resultant contact potential difference data; from these, the measuredEFvalue translates to−4.61±0.01 eV on the vacuum energy scale. Using the obtained VBM,EF, and the surface band gap values, the surface band structure of α- Ag3VO4was constructed (Scheme 2). The purple dashed line in Scheme 2 shows that the Fermi level is located 0.21 eV above the valence band, as expected for moderately doped p- type semiconductors. The valence band position is not Table 1. Absorption Onset Wavelength Value forα-Ag3VO4
along with Literature Data
absorption onset wavelength (nm)
575 567 580 560 615 560 613 560
reference this study 2 4 7 14 20 25 27
Figure 6.Tauc plots forα-Ag3VO4film on FTO. Frames a and b contain the plots analyzed for direct and indirect optical transitions, respectively.
Table 2. Energy Bandgap Values forα-Ag3VO4(cf.,Figure 6) along with Literature Data
as-deposited α-Ag3VO4 direct band gap
(eV)
2.58±0.04 2.58 2.37 2.05 2.10 indirect band gap
(eV)
2.37±0.02 2.18 NRa NR NR
reference this study 7 14 18 23
aNR: Not reported.
https://dx.doi.org/10.1021/acs.jpcc.0c05421 J. Phys. Chem. CXXXX, XXX, XXX−XXX E
favorable for water photooxidation because it lies above the thermodynamic threshold value of +1.23 V (vs NHE). On the other hand, the conduction band minimum (CBM) is thermodynamically favorable for hydrogen evolution (HER) and oxygen reduction reactions. Significantly, the CBM lies at
considerable overpotentials above the HER threshold of 0 V (vs NHE).
3.5. Electrochemical and Photoelectrochemical (PEC) Behavior of α-Ag3VO4. Many practical applications of α- Ag3VO4 would demand knowledge of the charge transfer efficacy of its surface. This can be performed using a quasi- reversible redox probe. Therefore, dark polarization experi- ments were conducted using the probe redox couple, Fe(CN)63−/4−. Figure 8a contains the data; for comparison, Pt and FTO electrodes were also included in these experiments. The results show that the valence band holes (majority carriers) in the p-Ag3VO4 semiconductor electrode oxidized Fe(CN)64− species on application of positive overpotentials (forward bias regime). The anodic polarity of the dark currentflow in the forward bias regime also diagnoses thefilm to behave as a p-type semiconductor55in conformity with the discussion earlier on this aspect.
The kinetics of majority carrier charge transfer in the dark can be assessed by converting the polarization curve (ivsE) to a Tafel plot (logivsE).56Such Tafel plots for Pt, FTO, and Ag3VO4are shown inFigure 8b (logivsη).Figure 8a,b shows that Pt, FTO, and Ag3VO4reached the mass transfer limited peaks or plateau for overpotentials (η) less than 118 mV.
Therefore, Tafel analyses were not optimal for these three Figure 7. (a) Ambient-pressure UV photoelectron spectroscopy (AP-UPS) data-derived plot and (b) surface photovoltage spectroscopy (SPS) data-derived plot for as-preparedα-Ag3VO4.
Scheme 2. Surface Energy Band Positions for As-Prepared α-Ag3VO4Constructed from AP-UPS, Kelvin Probe Microscopy, and SPS Data. Purple Dashed Line Shows the Fermi Level Position.
Figure 8.(a) Forward-bias current−potential polarization curves in the dark for the oxidation of Fe(CN)64−species in 50 mM K4Fe(CN)6, 50 mM K3Fe(CN)6, and 0.5 M KNO3. Purple dashed line shows anodic polarization of Ag3VO4in 0.5 M KNO3without redox species. (b) Tafel plots constructed from anodic polarization data.
https://dx.doi.org/10.1021/acs.jpcc.0c05421 J. Phys. Chem. CXXXX, XXX, XXX−XXX F
electrodes under the present experimental conditions. In addition, no clear linear behavior was observed in the kinetically controlled charge transfer regime at higher over- potentials (Figure 8b). Therefore, instead of the Tafel plot, an alternative equation proposed by other authors (eq 13)56,57 was deployed:
i
kjjj y
{zzz i
e i F
log RT
1 log
f 0 2.3
α η
− = −
η (13)
i0=FAk Co * (14)
Ineqs 13and14,f=F/RT,i0is the exchange current,kois the standard heterogeneous rate constant,Ais the electrode area, C*is the redox concentration, and the symbolsRandThave their usual significance.
The constructed plots for the three electrodes usingeq 13 and the polarization data are shown inFigure 9for Pt, FTO,
and Ag3VO4, respectively. Unlike the Tafel plots inFigure 8b, these plots were considerably more linear and thei0parameter could be extracted easily from the intercept of the linear part of the plot for overpotentials in the range from 10 mV to 40 mV
(see dashed vertical lines inFigure 9). The correspondingko value could be calculated usingeq 14. The calculated standard rate constant (koin cm/s) for Pt, FTO, and Ag3VO4were 3.44
×10−4, 1.72×10⁻⁴, and 5.84×10⁻⁵, respectively. This trend in relative charge transfer efficacy can be rationalized based on surface density of states (SDOS) arguments.56
The surface density of states (SDOS) is a crucial factor in dictating the kinetics of charge transfer, both for metal and for semiconductor electrodes.55,56 In general, the SDOS follows this trend: metal > degenerately doped semiconductor >
nominally doped semiconductor. Thus, in the present case, Pt is a metal, FTO is a degenerately doped semiconductor, andα- Ag3VO4is a nominally doped semiconductor. Consistent with this, the above derived standard rate constants for the oxidation of Fe(CN)64−redox species were ordered as follows:
Pt > FTO >α-Ag3VO4. This order is entirely consistent with the corresponding SDOS trend.
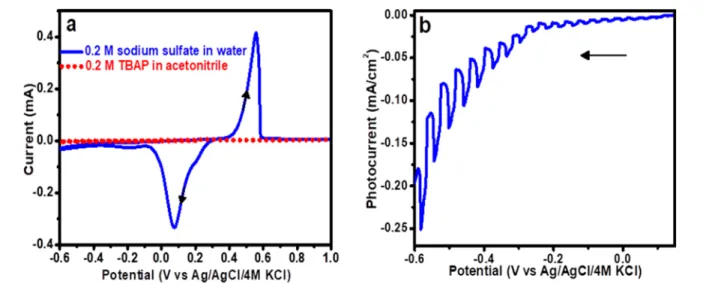
To probe the electrochemical stability of α-Ag3VO4 in the dark (again, an important prerequisite for many practical device applications), cyclic voltammetry experiments were performed in aqueous and nonaqueous solutions;Figure 10a contains the data. In aqueous 0.2 M sodium sulfate, the as- preparedα-Ag3VO4 electrode showed a cathodic wave upon scanning negatively from the open circuit potential; an anodic wave was seen on the return scan. These reduction and oxidation waves were not observed in the nonaqueous medium. The cathodic wave in aqueous electrolyte is diagnostic of (cathodic) corrosion of α-Ag3VO4 in the presence of water.
Therefore, an as-prepared α-Ag3VO4 sample was electro- chemically reduced in aqueous medium to probe the elemental composition and crystalline structure of the product on the film surface after cathodic corrosion. Figures S12 and S13 contain the results of EDX and XRD analyses, respectively, after cathodic corrosion; these confirm the presence of elemental silver on the film surface. Therefore, the anodic wave inFigure 10a may be assigned to oxidative stripping of silver and generation of Ag+ species. The cathodic corrosion reaction is given as follows:
Figure 9.Log [i/(efη−1)] vsηplots from anodic polarization data.
Figure 10. (a) Cyclic voltammograms of as-prepared Ag3VO4 film in 0.2 M sodium sulfate in water () and 0.2 M tetrabutylammonium perchlorate in acetonitrile (---), 5 mV/s potential scan rate. (b) Linear sweep photovoltammogram forα-Ag3VO4 in dioxygen-purged 0.2 M tetrabutylammonium perchlorate in acetonitrile, 1 mV/s potential scan rate.
https://dx.doi.org/10.1021/acs.jpcc.0c05421 J. Phys. Chem. CXXXX, XXX, XXX−XXX G
E
Ag VO H O 3e 3Ag
VO 2OH 0.195 V vs NHE
3 4(s) 2 (l) (s)
3 (aq) (aq) 0
+ + →
+ + = +
−
− −
(15) The standard potential for the above reaction was calculated from thermodynamic data culled from the literature on standard Gibbs free energies of formation.46,47
Given the poor electrochemical stability of α-Ag3VO4 in a nonaqueous electrolyte (Figure 10a), photoelectrochemical (PEC) experiments were conducted using dioxygen as an electron acceptor in a nonaqueous electrolyte. Figure 10b contains the corresponding photovoltammetry55 data for as- preparedα-Ag3VO4. In a photovoltammetry experiment, both the dark current (electrochemical features) and the photo- currents are generated in a single scan.55 Note that these experiments were conducted in thereverse-biasregime unlike in the (forward-bias) kinetics experiments inFigure 8a. Thus, the photocurrents are generated by minority carriers which are electrons for a p-type semiconductor.55 Consistent with this notion, the photocurrent polarity is cathodic in the traces in Figure 10b in line with the p-type semiconductor behavior of α-Ag3VO4(see above).
Unfortunately, there was significant dark currentflow upon applying negative overpotentials as shown in Figure 10b, suggesting that the α-Ag3VO4 film−electrolyte junction was
“leaky”. The dark current is attributed to the reduction of (adventitious) dioxygen in the electrolyte. A parallel possibility is that the residual traces of water in acetonitrile could participate in the corrosion reaction (Reaction 15 under photoirradiation but not in the dark in the experimental potential window. The PEC reduction reaction (photo- corrosion counterpart of reaction 15) presumably occurs at less negative overpotentials than those required to drive this reaction on a pure conductive electrode.55 This notion is entirely reasonable within the PEC conceptual framework.55
While the above data demonstrate thatα-Ag3VO4has good stability in the dark in an optimized (nonaqueous) electrolyte, considerable improvement in the quality of the Ag3VO4/ electrolyte junction would be needed under irradiation even in the same electrolyte (see below). These data point out the need for further studies on the possible use of this p-type semiconductor for practical device applications.
4. CONCLUSIONS
This first report on α-Ag3VO4 underlines the immense potential of electrosynthesis as a film preparation strategy that is environmentally benign, time-efficient, and scalable.
Crystalline, phase-pure, and stoichiometric α-Ag3VO4 films could be obtained even without postdeposition thermal annealing. Importantly, a high hole concentration could be secured in the film notwithstanding predictions from a materials design study.28 The present data acquired from a wide array of experimental techniques and thermodynamics/
kinetics analyses showed that practical applicability in electrochemical/photoelectrochemical scenarios would require further optimization of junction quality to suppress minority carrierflowin the dark. Approaches revolving around chemical modification of an electrodeposited α-Ag3VO4 film surface and/or multilayered electrodeposited configurations could prove to be profitable avenues worthy of further pursuit. The many multilayered examples involving α-Ag3VO4 as one component in previous studies (using other synthesis approaches)9−27indeed bolster this notion.
■
ASSOCIATED CONTENT*sı Supporting Information
The Supporting Information is available free of charge at https://pubs.acs.org/doi/10.1021/acs.jpcc.0c05421.
Color change during film transformation; histogram analyses of SEM data; XRD data; SEM/EDX data; TEM data; DRS data; contact potential difference (PDF)
■
AUTHOR INFORMATION Corresponding AuthorKrishnan Rajeshwar−Department of Chemistry&
Biochemistry, The University of Texas at Arlington, Arlington, Texas 76109-0065, United States; orcid.org/0000-0003- 4917-7790; Email:rajeshwar@uta.edu
Authors
Abbas Vali−Department of Chemistry&Biochemistry, The University of Texas at Arlington, Arlington, Texas 76109-0065, United States
Peter S. Toth−Department of Physical Chemistry and Materials Science, University of Szeged, Szeged ju H-6720, Hungary
Hyung-Woo Jee−Department of Chemistry, Yonsei University, Wonju, Kangwon 26493, Korea
Farinaz Firouzan−Department of Chemistry&Biochemistry, The University of Texas at Arlington, Arlington, Texas 76109- 0065, United States
Csaba Janáky− Department of Physical Chemistry and Materials Science, University of Szeged, Szeged ju H-6720, Hungary; orcid.org/0000-0001-5965-5173
Ki-Jung Paeng− Department of Chemistry, Yonsei University, Wonju, Kangwon 26493, Korea
Noseung Myung−Department of Energy&Materials, Konkuk University Glocal Campus, Chungju, Chungbuk 27478, Korea Complete contact information is available at:
https://pubs.acs.org/10.1021/acs.jpcc.0c05421
Notes
The authors declare no competingfinancial interest.
■
ACKNOWLEDGMENTSThis research was partially supported by the“Szechenyi 2020́ ” program in the framework of GINOP-2.3.2-15-2016-00013
“Intelligent materials based on functional surfaces−from syntheses to applications” project.
■
(1) Galante, M. T.; Sotelo, P.; Hossain, M. K.; Vali, A.; Raamann, A.;REFERENCES Longo, C.; Macaluso, R. T.; Rajeshwar, K. Silver Oxide-Based Semiconductors for Solar Fuels Production and Environmental Remediation: A Solid-State Chemistry Approach.ChemElectroChem 2019,6, 87−96.(2) Vali, A.; Sarker, H. P.; Jee, H.-W.; Kormányos, A.; Firouzan, F.;
Myung, N.; Paeng, K.-J.; Huda, M. N.; Janáky, C.; Rajeshwar, K.
Electrodeposition of Silver Vanadate Films: A Tale of Two Polymorphs.ChemPhysChem2019,20, 2635−2646.
(3) Huang, C.-M.; Pan, G.-T.; Li, Y-C. M.; Li, M.-H.; Yang, T. C-K.
Crystalline Phases and Photocatalytic Activities of Hydrothermal Synthesis Ag3VO4and Ag4V2O7under Visible Light Irradiation.Appl.
Catal., A2009,358, 164−172.
(4) Hu, X.; Hu, C. Preparation and Visible-Light Photocatalytic Activity of Ag3VO4Powders.J. Solid State Chem.2007,180, 725−732.
https://dx.doi.org/10.1021/acs.jpcc.0c05421 J. Phys. Chem. CXXXX, XXX, XXX−XXX H
(5) Belver, C.; Adán, C.; García-Rodríguez, S. G.; Fernández-García, M. F. Photocatalytic Behavior of Silver Vanadates: Microemulsion Synthesis and Post-Reaction Characterization. Chem. Eng. J. 2013, 224, 24−31.
(6) Huang, C.-M.; Cheng, K.-W.; Pan, G.-T.; Chang, W.-S.; Yang, T.
C-K. CTAB-Assisted Hydrothermal Synthesis of Silver Vanadates and Their Photocatalytic Characterization.Chem. Eng. Sci.2010,65, 148− 152.
(7) Chemelewski, W. D.; Mabayoje, O.; Mullins, C. B. SILAR Growth of Ag3VO4 and Characterization for Photoelectrochemical Water Oxidation.J. Phys. Chem. C2015,119, 26803−26808.
(8) Pan, G.-T.; Lai, M.-H.; Juang, R.-C.; Chung, T.-W.; Yang, T. C- K. Preparation of Visible-Light-Driven Silver Vanadates by a Microwave-Assisted Hydrothermal Method for the Photodegradation of Volatile Organic Vapors.Ind. Eng. Chem. Res. 2011,50, 2807−
2814.
(9) Wang, G.; Ren, Y.; Zhou, G. J.; Wang, J. P.; Cheng, H. F.; Wang, Z. Y.; Zhan, J.; Huang, B. B.; Jiang, M. H. Synthesis of Highly Efficient Visible Light Ag@Ag3VO4 Plasmonic Photocatalysts. Surf. Coat.
Technol.2013,228, S283−S286.
(10) Zhang, J.; Ma, Z. Flower-Like Ag3VO4/BiOBr n-p Hetero- junction Photocatalysts with Enhanced Visible-Light-Driven Catalytic Activity.Mol. Catal.2017,436, 190−198.
(11) Ran, R.; Meng, X.; Zhang, Z. Facile Preparation of Novel Graphene Oxide-Modified Ag2O/Ag3VO4/AgVO3 Composites with High Photocatalytic Activities under Visible Light Irradiation. Appl.
Catal., B2016,196, 1−15.
(12) Golzad-Nonakaran, B.; Habibi-Yangjeh, A. Photosensitization of ZnO with Ag3VO4and AgI Nanoparticles: Novel Ternary Visible- Light-Driven Photocatalysts with Highly Enhanced Activity. Adv.
Powder Technol.2016,27, 1427−1437.
(13) Zhang, J.; Ma, Z. Ag3VO4/AgI Composites for Photocatalytic Degradation of Dyes and Tetracycline Hydrochloride under Visible Light.Mater. Lett.2018,216, 216−219.
(14) Gao, L.; Li, Z.; Liu, J. Facile Synthesis of Ag3VO4/β-AgVO3
Nanowires with Efficient Visible-Light Photocatalytic Activity.RSC Adv.2017,7, 27515−27521.
(15) Jonjana, S.; Phuruangrat, A.; Thongtem, S.; Wiranwetchayan, O.; Thongtem, T. Preparation and Characterization of Ag3VO4/ Bi2MoO6Nanocomposites with Highly Visible-Light-Induced Photo- catalytic Properties.Mater. Lett.2016,180, 93−96.
(16) Nualkaew, P.; Phuruangrat, A.; Dumrongrojthanath, P.;
Thongtem, S.; Thongtem, T. Synthesis of Ag3VO4 Nanoparticles Loaded on Bi2MoO6 Nanoplates as Heterostructure Visible Light Driven Photocatalyst by Sonochemical Method. J. Ceram. Soc. Jpn.
2016,124, 1157−1160.
(17) Wang, P.; Tang, H.; Ao, Y.; Wang, C.; Hou, J.; Qian, J.; Li, Y.
In-Situ Growth of Ag3VO4 Nanoparticles onto BiOCl Nanosheet to Form a Heterojunction Photocatalyst with Enhanced Performance under Visible Light Irradiation.J. Alloys Compd.2016,688, 1−7.
(18) Zhang, L.; He, Y.; Ye, P.; Qin, W.; Wu, Y.; Wu, T. Enhanced Photodegradation Activity of Rhodamine B by Co3O4/Ag3VO4under Visible Light Irradiation.Mater. Sci. Eng., B2013,178, 45−52.
(19) Zhang, L.; He, Y.; Ye, P.; Wu, Y.; Wu, T. Enhanced Photodegradation Activity of Rhodamine B by MgFe2O4/Ag3VO4 under Visible Light Irradiation.Catal. Commun.2013,30, 14−18.
(20) Wang, J.; Ruan, H.; Li, W.; Li, D.; Hu, Y.; Chen, J.; Shao, Y.;
Zheng, Y. Highly Efficient Oxidation of Gaseous Benzene on Novel Ag3VO4/TiO2 Nanocomposite Photocatalysts under Visible and Simulated Solar Light Irradiation. J. Phys. Chem. C 2012, 116, 13935−13943.
(21) Yan, Y.; Shi, W.; et al. The Fabrication of a Novel Ag3VO4/ WO3Heterojunction with Enhanced Visible Light Efficiency in the Photocatalytic Degradation of TC.Phys. Chem. Chem. Phys.2016,18, 3308−3315.
(22) Zhang, L.; He, Y.; Ye, P.; Wu, Y.; Wu, T. Visible Light Photocatalytic Activities of ZnFe2O4 Loaded by Ag3VO4 Hetero- junction Composites.J. Alloys Compd.2013,549, 105−113.
(23) Kiantazh, F.; Habibi-Yangjeh, A. Ag3VO4/ZnO Nanocompo- sites with an n−n Heterojunction as Novel Visible-Light-Driven Photocatalysts with Highly Enhanced Activity.Mater. Sci. Semicond.
Process.2015,39, 671−679.
(24) Xie, Y.; Dai, Y.; Yuan, X.; Jiang, L.; Zhou, L.; Wu, Z.; Zhang, J.;
Wang, H.; Xiong, T. Insight on the Plasmonic Z-Scheme Mechanism Underlying the Highly Efficient Photocatalytic Activity of Silver Molybdate/Silver Vanadate Composite in Rhodamine B Degradation.
J. Colloid Interface Sci.2018,530, 493−504.
(25) Ren, C.; Fan, J.; Liu, S.; Li, W.; Wang, F.; Li, H.; Liu, X.;
Chang, Z. One-Step Hydrothermal Synthesis of Novel Ag3VO4/ Ag4V2O7 Composites for Enhancing Visible-Light Photocatalytic Performance.RSC Adv.2016,6, 95156−95164.
(26) Yan, M.; Wu, Y.; Yan, Y.; Yan, X.; Zhu, F.; Hua, Y.; Shi, W.
Synthesis and Characterization of Novel BiVO4/Ag3VO4 Hetero- junction with Enhanced Visible-Light-Driven Photocatalytic Degra- dation of Dyes.ACS Sustainable Chem. Eng.2016,4, 757−766.
(27) Padervand, M. Visible-Light Photoactive Ag−AgBr/α-Ag3VO4 Nanostructures Prepared in a Water-Soluble Ionic Liquid for Degradation of Wastewater.Appl. Nanosci.2016,6, 1119−1126.
(28) Trimarchi, G.; Peng, H.; Im, J.; Freeman, A. J.; Cloet, V.; Raw, A.; Poeppelmeier, K. R.; Biswas, K.; Lany, S.; Zunger, A. Using Design Principles to Systematically Plan the Synthesis of Hole-Conducting Transparent Oxides: Cu3VO4and Ag3VO4as a Case Study.Phys. Rev.
B: Condens. Matter Mater. Phys.2011,84, 165116.
(29) Cloet, V.; Raw, A.; Poeppelmeier, K. R.; Trimarchi, G.; Peng, H.; Im, J.; Freeman, A. J.; Perry, N. H.; Mason, T. O.; Zakutayev, A.;
et al. Structural, Optical, and Transport Properties of α- and β- Ag3VO4.Chem. Mater.2012,24, 3346−3354.
(30) Hirono, T.; Yamada, T.; Nishi, T. Photochromic Silver Complex Oxide Thin Films Synthesized by Anodic Oxidation. J.
Appl. Phys.1986,59, 948−950.
(31) Rajeshwar, K. Electrosynthesized Thin Films of Group II-VI Compound Semiconductors, Alloys and Superstructures.Adv. Mater.
1992,4, 23−29.
(32) Schlesinger, T. E.; Rajeshwar, K.; de Tacconi, N. R.
Electrodeposition of Semiconductors. In Modern Electroplating;
Schlesinger, M., Paunovic, M., Eds.; Springer: New York, 2010;
Chapter 14, pp 383−411.
(33) Rajeshwar, K.; de Tacconi, N. R.; Chenthamarakshan, C. R.
Semiconductor-Based Composites: Preparation, Properties, and Performance.Chem. Mater.2001,13, 2765−2782.
(34) Janáky, C.; Rajeshwar, K. The Role of (Photo)Electrochemistry in the Rational Design of Hybrid Conducting Polymer/Semi- conductor Assemblies: From Fundamental Concepts to Practical Applications.Prog. Polym. Sci.2015,43, 96−135.
(35) Janáky, C.; Kescenovity, E.; Rajeshwar, K. Electrodeposition of Inorganic Oxide/Nanocarbon Composites: Opportunities and Challenges.ChemElectroChem2016,3, 181−192.
(36) For example: Pourbaix, M.Atlas of Electrochemical Equilibria in Aqueous Solutions (translated from the French by Franklin, J. A.);
Pergamon Press: New York, 1974.
(37) Myung, N.; Ham, S.; Choi, B.; de Tacconi, N. R.; Rajeshwar, K.
Electrosynthesis of Cadmium Sulfide on Sulfur or Thiol-Modified Polycrystalline Gold Electrode.J. Electroanal. Chem.2005,574, 367−
373.
(38) Ham, S.; Choi, B.; Myung, N.; de Tacconi, N. R.;
Chenthamarakshan, C. R.; Rajeshwar, K.; Son, Y. Electrodeposition of CdTe Thin Films on Te-Modified Polycrystalline Gold Substrates.
J. Electroanal. Chem.2007,601, 77−82.
(39) Myung, N.; Ham, S.; Choi, S.; Chae, Y.; Kim, W.-G.; Jeon, Y. J.;
Paeng, K.-J.; Chanmanee, W.; de Tacconi, N. R.; Rajeshwar, K.
Tailoring Interfaces for Electrochemical Synthesis of Semiconductor Films: BiVO4, Bi2O3, or Composites. J. Phys. Chem. C 2011, 115, 7793−7800.
(40) Jee, H.-W.; Paeng, K.-J.; Myung, N.; Rajeshwar, K. Electro- deposition of Cobalt Selenide Thin Films: An Electrochemical Quartz Crystal Microgravimetry Study.J. Electrochem. Soc.2017,165, D1−
D5.
https://dx.doi.org/10.1021/acs.jpcc.0c05421 J. Phys. Chem. CXXXX, XXX, XXX−XXX I
(41) Jee, H.-W.; Paeng, K.-J.; Myung, N.; Rajeshwar, K. Electro- chemical Deposition of Metal-Organic Framework and Subsequent Conversion to Cobalt Selenide.ACS Appl. Electronic Mater.2020,2, 1358−1364.
(42) Britton, H. T. S.; Robinson, R. A. Physicochemical Studies of Complex Acids. Part IV. The Vanadates of Silver.J. Chem. Soc.1930, 0, 2328−2343.
(43) Ham, S.; Jeon, S.; Park, M.; Choi, S.; Paeng, K.-J.; Myung, N.;
Rajeshwar, K. Electrodeposition and Stripping Analysis of Bismuth Selenide Thin Films Using Combined Electrochemical Quartz Crystal Microgravimetry and Stripping Voltammetry. J. Electroanal. Chem.
2010,638, 195−203.
(44) Deakin, M. R.; Buttry, D. A. Electrochemical Applications of the Quartz Crystal Microbalance. Anal. Chem. 1989, 61, 1147A−
1154A.
(45) Buttry, D. A. Applications of the Quartz Crystal Microbalance to Electrochemistry. In Electroanalyitcal Chemistry: A Series of Advances; Bard, A. J., Ed.; Marcel Dekker: New York, 1991; Vol.17.
(46) Baes, C. F.; Messmer, R. E.The Hydrolysis of Cations; John Wiley & Sons: New York, 1976; Chapter 10, pp 197−210.
(47) Zhutaeva, G. V.; Shumilova, N. A.; Israel, Y. Silver and Vanadium. In Standard Potentials in Aqueous Solution; Bard, A. J., Parsons, R., Jordan, J., Eds.; Marcel Dekker: New York, 1985; Chapter 11, pp 295−296, Chapter 17, pp 508−513.
(48) Zhang, J.; Ma, Z. Ag3VO4/BiOIO3 Heterojunction with enhanced visible-light-driven catalytic activity.J. Taiwan Inst. Chem.
Eng.2018,88, 177−185.
(49) de Oliveira, R. C.; Gracia, L.; Assis, M.; Li, M. S.; Andres, J.;
Longo, A.; Cavalcante, L. S. Disclosing the Electronic Structure and Optical Properties of Ag4V2O7Crystals: Experimental and Theoretical Insights.CrystEngComm2016,18, 6483−6491.
(50) Zheng, J.; Calvillo, L.; Valero-Vidal, C.; Marega, C.; Sekar, P.;
Shuang, S.; Girardi, L.; Agnoli, S.; Rizzi, G. A.; Granozzi, G. Ag- Vanadates/GO Nanocomposites by Aerosol-Assisted Spray Pyrolysis:
Preparation and Structural and Electrochemical Characterization of a Versatile Material.ACS Omega2017,2, 2792−2802.
(51) Murphy, A. B. Band-Gap Determination from Diffuse Reflectance Measurements of Semiconductor Films, and Application to Photoelectrochemical Water-Splitting.Sol. Energy Mater. Sol. Cells 2007,91, 1326−1337.
(52) Roy, D.; Samu, G.; Hossain, M.; Janáky, C.; Rajeshwar, K. On the Measured Optical Bandgap Values of Inorganic Oxide Semi- conductors for Solar Fuels Generation.Catal. Today2018,300, 136−
144.
(53) Viezbicke, B. D.; Patel, S.; Davis, B. E.; Birnie, D. P. Evaluation of the Tauc Method for Optical Absorption Edge Determination:
ZnO Thin Films as a Model System.Phys. Status Solidi B2015,252, 1700−1710.
(54) Baikie, I. D.; Grain, A. C.; Sutherland, J.; Law, J. Ambient Pressure Photoemission Spectroscopy of Metal Surfaces.Appl. Surf.
Sci.2014,323, 45−53.
(55) Rajeshwar, K. Semiconductor Electrodes and Photoelectro- chemistry. InEncyclopedia of Electrochemistry; Licht, S., Ed.; Wiley- VCH: Weinheim, 2001; Chapter 1, pp 3−53.
(56) Bard, A. J.; Faulkner, L. R. Electrochemical Methods:
Fundamentals and Applications; John Wiley & Sons: New York, 2001; Chapter 3, pp 100−104,125, Chapter 18, pp 152−153.
(57) Allen, P. A.; Hickling, A. Electrochemistry of Sulphur. Part 1.
Overpotential in the Discharge of the Sulphide Ion.Trans. Faraday Soc.1957,53, 1626−1635.
https://dx.doi.org/10.1021/acs.jpcc.0c05421 J. Phys. Chem. CXXXX, XXX, XXX−XXX J