European Journal of Mechanics / A Solids 81 (2020) 103950
Available online 13 January 2020
0997-7538/© 2020 The Authors. Published by Elsevier Masson SAS. This is an open access article under the CC BY-NC-ND license
(http://creativecommons.org/licenses/by-nc-nd/4.0/).
Prediction of earing of aluminium sheets from {h00} pole figures
Marton Benke
a,*, Adrienn Hlavacs
a, Imre Piller
b, Valeria Mertinger
aaUniversity of Miskolc, Institute of Physical Metallurgy Metalforming and Nanotechnology, Miskolc-Egyetemvaros, H3515, Hungary
bUniversity of Miskolc, Institute of Mathematics, Miskolc-Egyetemvaros, H3515, Hungary
A R T I C L E I N F O Keywords:
Aluminium Anisotropy Texture Earing Pole figure
A B S T R A C T
Earing of deep drawn cups is a result of non-uniform formability caused by crystallographic anisotropy. The prediction of earing is of interest since the rise of the rolling process. Today’s prediction methods are based on theoretical material behaviour functions and apply only within a certain sheet geometry range. In this manu- script, a new and simple method is presented which can be used to calculate the earing of aluminium sheets showing four-fold earing if only texture data is available. The method was applied on 0.3 and 3 mm thick cold rolled 1050 type aluminium sheets subjected to annealing heat treatments for different time intervals to promote recrystallization processes and obtain different earing behaviour. Predicted cup heights are validated with measured data obtained from the performed deep drawn tests. Average earing is also predicted and validated. It is shown that the proposed method is able to predict the type and magnitude of earing with satisfactory results for both 0.3 and 3 mm sheet thicknesses.
1. Introduction
Crystallographic texture strongly affects the uniformity of form- ability of aluminium sheets (Hutchinson and Ekstr€om, 1990; Engler and Hirsch, 2002). As a result of different radial elongations in different directions of the sheet, undesired wavy cup rims form during deep drawing, which is called earing. The highest parts are called ears, while the lowest regions are troughs. In most cases, four ears form in the 45�þ (n*90�) or the 0�þ(n*90�) directions with respect to rolling direction (RD), as a result of rolling or recrystallization texture, respectively (Sheppard and Zaidi, 1982; Kao, 1985; Van Houtte et al., 1987; Engler, 2012). If the balanced combination of the two is achieved, an even cup height is obtained (Hutchinson et al., 1989; Cheng, 2001). Over a couple of decades, many models have been established to predict earing on the basis of the results of texture measurements. Fukui and Kudo (1950) found that earing can be estimated based on the Lankford value Δr¼ (r0þr90)/2-r45. Sowerby and Johnson (1974) predicted earing from the anisotropy of mechanical properties using slip-line theory. Tucker (1961) predicted earing based on crystallography and Schmid’s law considering single slip for single crystalline sheets. This analytical treatment was extended to polycrystalline case by Kanetake et al. (1983) supposing that neighbouring grains do not affect each other and with the assumption that the radial stress component is tensile, the tangential is compressive and the normal component is zero. This model used
empirical values of work-hardening and was suitable to calculate both the positions and height of ears. Da Costa Viana et al. (1978) proposed a method based on the combination of ODF data and yield locus calcu- lations. They presumed inversely proportional relation between radial strains and yield stress. A more sophisticated approach was proposed by Pochinetto et al. (1981) based on stress equilibrium. This was further improved by Rodrigues and Bate (1985), however, their method could only deal with four-fold earing. Grewen (1971) showed that under such conditions, the amount of earing is proportional to the variation of strain ratios in the transverse and the thickness direction during tensile tests with different angles with rolling direction (RD). Van Houtte et al.
(1987) used a similar approach. He assumed that the ratio of radial and tangential stress is related to the drawing ratio, being 0.2 for 1.68 drawing ratio. The model was refined by Murakami and Senuma (1998) who predicted earing in ultra-low carbon steel with accuracy. Nowa- days, to save time and reduce costs by comparison with traditional methods, earing is predicted through finite element (FE) calculations of which first attempts were made by Lee and Kobayashi (1973), Gotoh and Ishise (1978). Here, the plastic behaviour is often described through phenomenological yield functions (Yoon et al., 2007; Padmanabhan et al., 2007; Barros et al., 2013; Zein et al., 2014; Reddy et al., 2015).
With this approach, unsatisfactory results originate from inaccurate description of the material behaviour. Soare and Barlat (2011) showed that an adequate calibration of the yield surface model is required for
* Corresponding author.
E-mail address: fembenke@uni-miskolc.hu (M. Benke).
Contents lists available at ScienceDirect
European Journal of Mechanics / A Solids
journal homepage: http://www.elsevier.com/locate/ejmsol
https://doi.org/10.1016/j.euromechsol.2020.103950
Received 19 September 2019; Received in revised form 9 January 2020; Accepted 11 January 2020
European Journal of Mechanics / A Solids 81 (2020) 103950 appropriate predictions. Furthermore, some models fail when more complex anisotropy, namely, six or eight-fold earing is observed. This has been solved by methods such the ones proposed by Yoon et al.
(2006) and Aretz et al. (2010). Texture-based polycrystal-plasticity model has been proposed and applied in the works of Engler et al.
(Engler and Kalz, 2004; Engler and Hirsch, 2007; Engler et al., 2007, 2011). The aim of the present paper is to propose a new method to predict earing in aluminium alloys with four-fold earing which has the following advantages over the currently available methods. First, qual- itative information (type and relative magnitude) regarding earing can be obtained rapidly, only from texture data. If quantitative data (abso- lute measure of earing) is demanded, only one additional deep drawing test is required. Other than these, there is no need to perform a series of mechanical tests or FE calculations. Secondly, since the proposed method relies solely on texture data, it is possible to be combined with non-destructive (sample cutting-free) pole figure measurements described by Sepsi et al. (2019). This can open new possibilities in cases when only non-invasive measurements are allowed, such as the exami- nation of high value, unique products or the field of archaeometry.
Third, the new method is simple. It is free from limitations regarding sheet geometry, boundary conditions for stress states and yield theories, which, in some cases, can lead to inaccurate results. Thus, the simple method can be generally applied for different sheet thicknesses.
2. Material and methods
The examined 0.3 mm and 3 mm thick, 1050 type aluminium sheets were provided by ARCONIC-Kofem Hungary Ltd. The received cold rolled sheets were subjected to annealing heat treatments for various durations. Deep drawing tests were carried out by ARCONIC-Kofem Hungary Ltd in a similar manner to the work of B�eres et al. (2019).
Fig. 1.Deep drawn cup parameters for the average earing calculation.
Fig. 2. Poles of the main texture components (C, S, B, Cube, G) on the {h00}
pole figure as published earlier by Benke et al. (2018a)
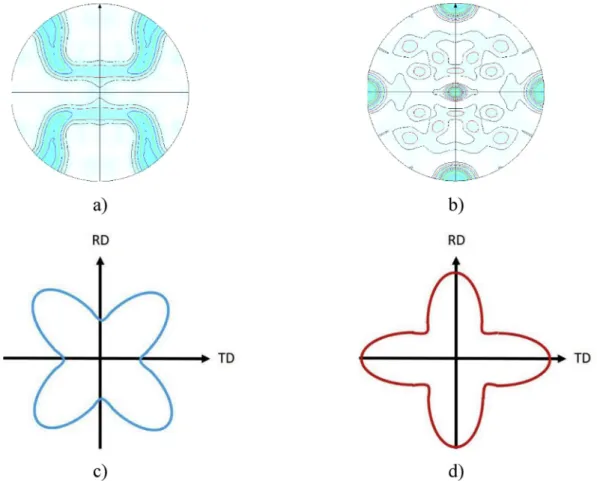
Fig. 3. {h00} pole figure of a) cold rolled 3003 type aluminium, b) recrystallized copper, c) observed earing directions after cold rolling, d) after recrystallization published earlier by Benke et al. (2018b).
M. Benke et al.
Fig. 4.Steps of the relative cup height variation prediction method. a) measured {200} pole figure, b) recalculated {200} pole figure with a CHI-cut, c) CHI-cut with the fitted function and Gaussian functions, d) weighted {200} intensity versus PHI function.
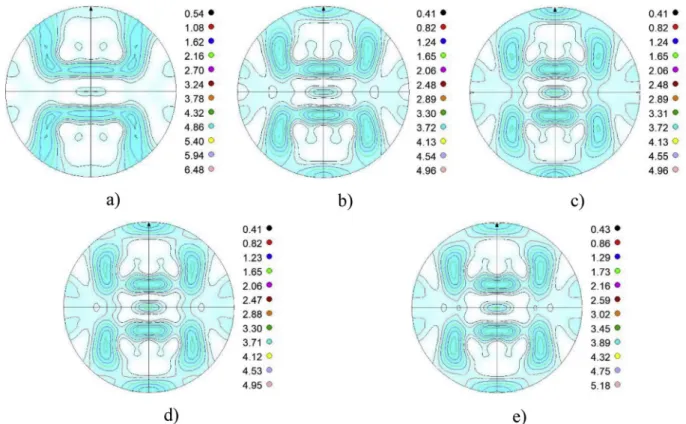
Fig. 5. Recalculated {200} pole figures of the 1050 type 0.3 mm thick aluminium sheets annealed for a) 15 min, b) 30 min, c) 45 min, d) 60 min, e) 120 min at 300 �C.
European Journal of Mechanics / A Solids 81 (2020) 103950
Average earing was calculated from measured cup heights using equa- tions (3)–(7).
hAVp ¼ hp1þhp2þhp3þ…�.
np (1)
hAVv ¼ ðhv1þhv2þhv3þ…Þ�
nv (2)
he¼hAVp hAVp (3)
hAV¼
� hAVp þhAVv
�.
2 (4)
Z¼ he
�hAV�
⋅100 (5)
where hpn is the peak height; np is the number of peaks; hAVp is the average peak height; hvn is the valley height; nv is the number of valleys;
hAVv is the average valley height; he is the average ear height; hAV is the average cup height; z is the average earing (Fig. 1). If ears appeared in the 45�þ(n*90�) directions, the value of average earing was designated with a negative sign, while if ears were found in the 0�þ(n*90�) di- rections, the average earing was positive, by definition. X-ray diffraction texture measurements were performed on 30 mm diameter samples with a Bruker D8 Advance diffractometer equipped with an Eulerian cradle.
The parameters of measurement were: CoKα source, 40 kV tube voltage, 40 mA tube current, 20 mm spot size. Three incomplete pole figures, viz.
{111}, {200} and {220}, were measured to CHI ¼75� tilting. Then, complete {h00} pole figures were obtained by recalculation using series harmonic functions with the own software of the equipment (TexEval).
3. Theory
Fig. 2 shows the {h00} poles of the main texture components of rolling (C: copper, S: silver, B: brass) and recrystallization (Cube, G:
Goss) defined by Kocks et al. (1998) and Engler and Randle (2010), within the coordinate system of rolling.
From Fig. 2, it is evident that the {h00} poles of the Cube and Goss components appear in the 0�þ(n*90�) directions, while poles of the rolling components are oriented around the 45�þ(n*90�) directions with respect to RD. These directions coincide with the observed earing of FCC metals having four-fold earing (Sheppard and Zaidi, 1982; Kao, 1985; Van Houtte et al., 1987; Engler, 2012). A rudimentary model for earing prediction has been established based on this phenomenon by the authors (Benke et al., 2018a. However, plastic anisotropy is influenced by the orientation of all grains, not solely by the main texture compo- nents. Therefore, it is a more sophisticated approach if the whole {h00}
pole figure is taken into account. Fig. 3 shows the complete {h00} pole figure of rolled and recrystallized aluminium and copper, respectively, together with the observed four-fold earing.
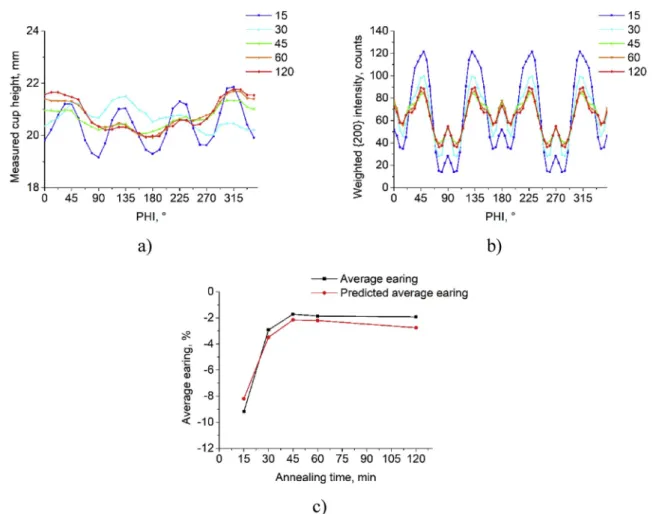
In Fig. 3 it can be seen that in the recrystallized state, if Cube texture is formed, high {h00} pole densities are found in the same directions where earing is experienced. If Goss texture also forms, its {h00} poles also appear in the same directions (Fig. 2). In the case of cold rolling, poles are closely oriented to the 45�þ(n*90�) directions of the four-fold type earing. Thus, an orientational coupling exists between {h00} pole density and observed earing of aluminium alloys having four-fold earing. The developed method is based on the above orientation coupling. As input data, complete {h00} pole figures are required. For the present case, pole figures were measured up to 75�tilting by means Fig. 6.Results of the 1050 type 0.3 mm thick aluminium sheets annealed for different durations at 300 �C a) measured cup height, b) weighted {200} intensity distribution, c) predicted average earing and average earing.
M. Benke et al.
of X-ray diffraction (Fig. 4a). Afterwards, pole figures were recalculated to obtain complete pole figures up to 90�tilting (Fig. 4b). Afterwards, CHI-cuts, which plot the recalculated intensity versus CHI (sample tilt- ing angle) must be generated for every PHI (sample rotation angle) value. The method uses the supposition that the recalculated intensity function can be estimated with the sum of a series of weighted Gaussian functions proposed by Ma et al. (2006). The approximation function, IðCHIÞcan be written according to equation (1), where giðCHIÞis the density function of normal distribution and Ai is the weight factor. On the CHI-cuts, the recalculated intensity variation is fitted with the approximation function by minimizing the square error of the curve fitting (Fig. 4c). Then, the area of each individual Gaussian function (which equals the weight factor, Ai) is determined (Benke et al., 2018b).
Afterwards, Ai is multiplied with the sin of the CHI value of its peak position (CHIMAX i). Finally, the weighted areas are summarized for the given CHI-cut and plotted as a function of PHI to yield the weighted {h00} intensity distribution which represents the relative cup height variation versus PHI (Fig. 4d). This function gives qualitative informa- tion (type and relative magnitude) regarding earing.
IðCHIÞ ¼Xn
i¼1
Ai⋅giðCHIÞ (6)
Weighted h00intensityPHI¼ Xn
i¼1
Ai⋅sinðCHIMAX iÞ (7) If the absolute measure of earing is also demanded, predicted average earing can be calculated from the weighted {200} intensities according to equations (3)–(7) and divided by a scaling factor. The application of a scaling factor is required to obtain numbers that are comparable with the average earing calculated from measured cup heights. Since predicted average earing is calculated form X-ray in- tensity, which is affected by many parameters, the scaling factor must be determined for a given measurement set up. To determine the scaling
factor, at least one deep-drawing test is required, from which average earing is calculated. Afterwards, the scaling factor can be determined by dividing the predicted average earing with average earing.
4. Results
Fig. 5 summarizes the recalculated {200} pole figures of the 0.3 mm thick 1050 aluminium sheets after the annealing heat treatments at 300
�C. It can be seen that the after 15 min annealing, the pole figure shows a strong cold rolled texture with high pole densities near the 45�þ(n*90�) directions (Fig. 5a). This texture weakens with increasing annealing time and pole densities increase in the centre of the pole figures and near the 0�þ(n*90�) directions (Fig. 5b–e).
Fig. 6 shows the results of the Al sheet cold rolled to 0.3 mm thick- ness and subsequently annealed at 300 �C for different time intervals. In Fig. 6 a, the measured cup height can be seen as a function of the rotation angle (PHI) from RD. Note that besides the four ears, a skewed cup height is obtained after 45, 60 and 120 min annealing which results from eccentricity of the sample during deep drawing. In Fig. 6 b, the weighted {200} intensity is plotted versus PHI angle. According to the figure, the measured cup height and weighted {200} intensity functions are similar. After 15 min of annealing, both cup heights and intensities have maximum values at 45�, 135�, 225�and 315�, thus, rolled earing is observed. As annealing time increases, ear heights and maximal in- tensities decrease and reach a permanent state after 60 min. The decrease of average earing with increasing annealing time can be seen in Fig. 6 c. Again, the average earing calculated from measured cup heights and the predicted average earing calculated from weighted {200} in- tensities vary similarly with annealing time. From both functions, it can be deduced that minimal average earing can be achieved after 45 min of annealing. It is worth noting that while the measured cup height versus PHI functions have 4 local maxima appearing in the rolled earing di- rections, the weighted {200} intensity functions actually have 8 local maxima. Besides the larger values in the rolled earing directions (45�, Fig. 7.Recalculated {200} pole figures of the 1050 type 3 mm thick aluminium sheets annealed for a) 10 min, b) 20 min, c) 30 min, d) 45 min, e) 60 min at 340 �C.
European Journal of Mechanics / A Solids 81 (2020) 103950
135�, 225�and 315�), smaller local maxima also appear at 0�, 90�, 180� and 270�, which correspond to the recrystallized earing directions.
However, the intensity peaks in the rolling directions are much larger, thus, the type of earing is univocal.
In Fig. 7, the recalculated {200} pole figures of the 3 mm thick 1050 aluminium sheets are presented after annealing at 340 �C. Pole figures after 10 and 20 min annealing show rolled texture with high pole den- sities near the 45�þ(n*90�) directions (Fig. 7a and b), while after 30 min, a mixture of rolled and recrystallized texture is developed (Fig. 7c).
Samples annealed for 45 min and 60 min show high pole densities near the 0�þ(n*90�) directions as cube texture developed (Fig. 7d ad e, respectively).
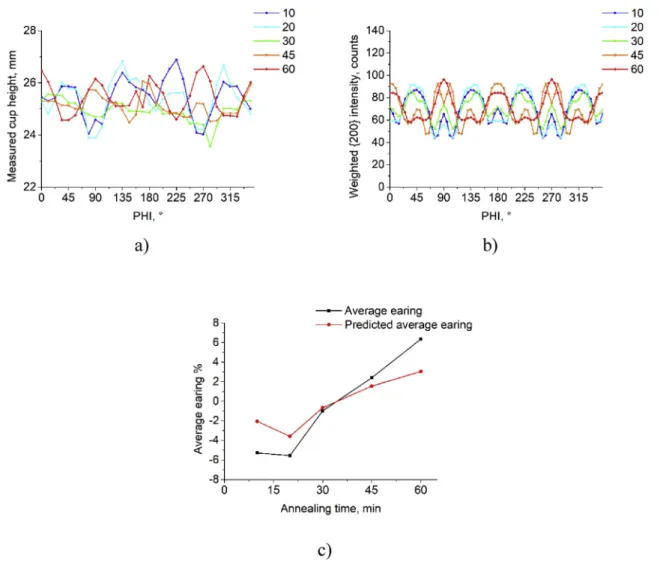
Fig. 8 shows the results of the 3 mm thick sheets annealed at 340 �C.
Again, measured cup height (Fig. 8 a) and weighted {200} intensity (Fig. 8 b) versus PHI functions gave similar results. After 10 min annealing, ears and intensity peaks are observed at 45�þ(n*90�) PHI values, the rolled earing directions. As annealing time is increased, both of them decrease until a uniform state is achieved at 30 min. After that, ears and intensity peaks start to rise at 0�, 90�, 180�and 270�meaning that recrystallized earing is formed. This can be more easily followed on the average earing versus annealing time functions plotted in Fig. 8 c. It can be read from both average earing and predicted average earing functions that the annealing time required for the weakest earing is 30 min. Again, weighted {200} intensity distribution functions actually have 8 peaks instead of 4. However, from their relative heights, the type of earing can be easily identified.
5. Discussion
It was seen that for a given sample of 1050 type aluminium, the weighted {200} intensities calculated according to the proposed method vary similarly to measured cup heights versus rotation angle (PHI) from RD. In addition, the weighted intensities and measured cup heights change simultaneously with annealing time. Furthermore, the average earing calculated form the weighted {200} intensities and the measured cup heights show similar function versus annealing time. These were observed for both 0.3 mm and 3 mm sheet thicknesses which represent the typical range of sheet thicknesses of cold rolling. Thus, it can be safely said that the positions of ears (that is, type of earing) and magnitude of earing of rolled and annealed aluminium sheets can be predicted with the presented method with satisfactory accuracy solely from texture data in case of four-fold earing. Actually, since there are no limitations regarding sample thickness, the presented method even has the potential to be applied on sheet thicknesses where deep drawing cannot be performed. Although such results cannot be validated, the new method can give some information about the earing behaviour of such sheets. Furthermore, it can also be proposed that the described method is applicable for other metals with FCC lattice if four-fold earing is observed and other deformation mechanism, such as phase trans- formation or twinning acts during plastic deformation. However, the applicability of the method for other metals and six earing cases require further researches. Finally, since there are no criteria regarding how pole figure data is obtained, it can be assumed that theoretically, the Fig. 8. Results of the 1050 type 3 mm thick aluminium sheets annealed for different durations at 340 �C a) measured cup height, b) weighted {200} intensity distribution, c) predicted average earing and average earing.
M. Benke et al.
described method can be applied on EBSD pole figures as well. This, again, can be a focal point of an upcoming research.
6. Summary
A new method was proposed to predict the relative cup height and average earing of cold rolled and annealed aluminium sheets. The method is very simple, since it requires only pole figure data for the calculations. Comparing the calculated results to those obtained from measurements it can be stated that the presented method is generally applicable for different sheet thicknesses. Consequently, the described method can also be applied for such sheet thicknesses where deep drawing tests cannot be performed.
CRediT authorship contribution statement
Marton Benke: Conceptualization, Methodology, Writing - original draft, Funding acquisition. Adrienn Hlavacs: Formal analysis, Investi- gation. Imre Piller: Formal analysis, Software. Valeria Mertinger:
Supervision, Writing - review & editing, Funding acquisition.
Acknowledgements
This work was supported by the J�anos Bolyai Research Scholarship of the Hungarian Academy of Sciences, and the NKFIH K119566 project.
References
Aretz, H., Aegerte, J., Engler, O., 2010. Analysis of earing in deep drawn cups. AIP. Conf.
Proc. 1252 (1), 417–424. https://doi.org/10.1063/1.3457585.
Barros, P.D., Oliveira, M.C., Alves, J.L., Menezes, L.F., 2013. Earing prediction in drawing and ironing processes using an advanced yield criterion. Key Eng. Mater.
554–557 2266, 2276. https://doi.org/10.4028/www.scientific.net/KEM.554 -557.2266.
Benke, M., Hlavacs, A., Petho, D., Angel, D.A., Sepsi, M., Mertinger, V., 2018a. A simple correlation between texture and earing. IOP Conf. Ser. Mater. Sci. Eng. 426, 012003 https://doi.org/10.1088/1757-899X/426/1/012003.
Benke, M., Hlavacs, A., Piller, I., Mertinger, V., 2018b. Lemezek fülesed�ese �es a {h00}
p�olus�abr�ak k€oz€otti kapcsolat. BKL 152, 36–39 (in Hungarian).
B�eres, G., Luk�acs, Zs, Tisza, M., 2019. Study on the wrinkling behavior of cylindrical deep- drawn cups. AIP Conf. Proc. 2113, 170003. https://doi.org/10.1063/
1.5112719.
Cheng, X.-M., 2001. Earing behavior and crystallographic texture of aluminum alloys during cold rolling. J. Mater. Eng. Perform. 10 (4), 399–404. https://doi.org/
10.1361/105994901770344791.
Da Costa Viana, C.S., Davies, G.J., Kallend, J.S., 1978. The prediction of earing behavior and formability limits from texture data. In: Gottstein, G., Lücke, K. (Eds.), Proc. 5th Int. Conf. Tex.Mat., pp. 447–453. Aachen.
Engler, O., 2012. Control of texture and earing in aluminium alloy AA 3105 sheet for packaging applications. Mater. Sci. Eng. A 538, 69–80. https://doi.org/10.1016/j.
msea.2012.01.015.
Engler, O., Hirsch, J., 2002. Texture control by thermomechanical processing of AA6xxx Al–Mg–Si sheet alloys for automotive applications—a review. Mater. Sci. Eng. A 336, 249–262. https://doi.org/10.1016/S0921-5093(01)01968-2.
Engler, O., Hirsch, J., 2007. Through-process simulation of texture and properties during the thermomechanical processing of aluminium sheets. Mater. Sci. Eng. A 452–453, 640–651. https://doi.org/10.1016/j.msea.2006.10.108.
Engler, O., Kalz, S., 2004. Simulation of earing profiles from texture data by means of a visco-plastic self-consistent polycrystal plasticity approach. Mater. Sci. Eng. A 373, 350–362. https://doi.org/10.1016/j.msea.2004.02.003.
Engler, O., Randle, V., 2010. Introduction to Texture Analysis, second ed. CRC Press, Boca Raton.
Engler, O., L€ochte, L., Hirsch, j., 2007. Polycrystal-plasticity simulation of six and eight ears in deep-drawn aluminum cups. Acta Mater. 55, 5449–5463. https://doi.org/
10.1016/j.actamat.2007.06.010.
Engler, O., Mertens, N., Van Dam, P., 2011. Texture-based design of a convoluted cut- edge for earing-free beverage cans. J. Mater. Process. Technol. 211, 1278–1284.
https://doi.org/10.1016/j.jmatprotec.2011.02.011.
Fukui, S., Kudo, H., 1950. The earing in deep-drawing and directionality in tension-test of sheet metal. Rep. Inst. Sci. Tech. Univ. Tokyo 4, 33.
Gotoh, M., Ishise, F., 1978. A finite element analysis of rigid-plastic deformation of the flange in a deep-drawing process based on a fourth-degree yield function. Int. J.
Mech. Sci. 20, 423–435. https://doi.org/10.1016/0020-7403(78)90032-2.
Grewen, J., 1971. Quantitative analysis of textures. Proc. Int. Seminar 195.
Hutchinson, W.B., Ekstr€om, H.-E., 1990. Control of annealing texture and earing in non- hardenable aluminium alloys. Mat. Sci. Tecnol. 6, 1103–1112. https://doi.org/
10.1179/mst.1990.6.11.1103.
Hutchinson, W.B., Oscarsson, A., Karlsson, A., 1989. Control of microstructure and earing behaviour in aluminium alloy AA3004 hot bands. Mat. Sci. Tecnol. 5, 1118–1127. https://doi.org/10.1179/026708389790340978.
Kanetake, N., Tozawa, Y., Otani, T., 1983. Calculations from texture of earing in deep drawing for fcc metal sheets. Int. J. Mech. Sci. 25, 337–345. https://doi.org/
10.1016/0020-7403(83)90012-7.
Kao, P.-W., 1985. Texture and earing behaviour of cold-rolled aluminium alloy 3004.
Mater. Sci. Eng. 74, 147–157. https://doi.org/10.1016/0025-5416(85)90428-8.
Kocks, U.F., Tom�e, C.N., Wenk, H.-R., 1998. Texture and Anisotropy, first ed. Cambridge University Press, Cambridge.
Lee, C.H., Kobayashi, S., 1973. New solutions to rigid-plastic deformation problems using a matrix method. Trans. ASME Ser. B 95 (3), 865–873. https://doi.org/10.1115/
1.3438238.
Ma, Q., Mao, W., Feng, H., Yu, Y., 2006. Rapid texture measurement of cold-rolled aluminum sheet by X-ray diffraction. Scr. Mater. 54, 1901–1905. https://doi.org/
10.1016/j.scriptamat.2006.02.007.
Murakami, H., Senuma, T., 1998. Prediction and control of earing by anaIysis of texture.
ISIJ Int. 38, 653–660. https://doi.org/10.2355/isijinternational.38.653.
Padmanabhan, R., Oliveira, M.C., Alves, J.L., Menezes, L.F., 2007. Influence of process parameters on the deep drawing of stainless steel. Finite Elem. Anal. Des. 43, 1062–1067. https://doi.org/10.1016/j.finel.2007.06.011.
Pochinetto, A., Pernot, M., Penelle, R., 1981. Deformation of Polycrystals. Riso National Laboratory, Denmark, p. 205.
Reddy, A.C.S., Rajesham, S., Reddy, P.R., Kumar, T.P., Goverdhan, J., 2015. An experimental study on effect of process parameters in deep drawing using Taguchi technique. Int.J. Eng. Sci. Techn. 7, 21–32. https://doi.org/10.4314/ijest.v7i1.3.
Rodrigues, P.M.B., Bate, P.S., 1985. Texture in Non-ferrous Metals and Alloys.
Warrendale, AIME.
Sepsi, M., Mertinger, V., Benke, M., 2019. Sample cutting-free pole figure measurement method for centreless diffractometers in modified X mode. Mater. Char. 151, 351–357. https://doi.org/10.1016/j.matchar.2019.03.031.
Sheppard, T., Zaidi, M.A., 1982. Influence of hot-working parameters on earing behaviour of Al–2Mg sheet. Met. Tecnol. 9, 368–374. https://doi.org/10.1179/
030716982803286106.
Soare, S.C., Barlat, F., 2011. A study of the Yld2004 yield function and one extension in polynomial form: a new implementation algorithm, modeling range, and earing predictions for aluminum alloy sheets. Eur. J. Mech. A Solid. 30, 807–819. https://
doi.org/10.1016/j.euromechsol.2011.05.006.
Sowerby, R., Johnson, W., 1974. Prediction of earing in cups drawn from Anisotropic sheet using slip-line field theory. J. Strain Anal. 9, 102–108. https://doi.org/
10.1243/03093247V092102.
Tucker, G.E.G., 1961. Texture and earing in deep drawing of aluminium. Acta Metall. 9, 275–286. https://doi.org/10.1016/0001-6160(61)90220-6.
Van Houtte, P., Cauwenberg, G., Aernoudt, E., 1987. Analysis of the earing behaviour of aluminium 3004 alloys by means of a simple model based on yield loci calculated from orientation distribution functions. Math. Sci. Eng. 95, 115–124. https://doi.
org/10.1016/0025-5416(87)90503-9.
Yoon, J.W., Barlat, F., Dick, R.E., Karabin, M.E., 2006. Prediction of six or eight ears in a drawn cup based on a new anisotropic yield function. Int. J. Plast. 22, 174–193.
https://doi.org/10.1016/j.ijplas.2005.03.013.
Yoon, J.W., Stoughton, T.B., Dick, R.E., 2007. Earing prediction in cup drawing based on non-associated flow rule. AIP Conf. Proc. 908, 685–690. https://doi.org/10.1063/
1.2740890.
Zein, H., El Sherbiny, M., Abd-Rabou, M., El Shazly, M., 2014. Thinning and spring back prediction of sheet metal in the deep drawing process. Mater.Design 53, 797–808.
https://doi.org/10.1016/j.matdes.2013.07.078.