IOP Conference Series: Materials Science and Engineering
PAPER • OPEN ACCESS
Deformability Tests of Pure Niobium
To cite this article: V Mertinger et al 2020 IOP Conf. Ser.: Mater. Sci. Eng. 903 012019
View the article online for updates and enhancements.
This content was downloaded from IP address 193.6.11.233 on 09/09/2020 at 13:42
12th Hungarian Conference on Materials Science (HMSC12)
IOP Conf. Series: Materials Science and Engineering 903 (2020) 012019
IOP Publishing doi:10.1088/1757-899X/903/1/012019
Deformability Tests of Pure Niobium
V Mertinger1, I Aviles Santillana2, M Benke1, A Gallifa Terricabras2, A Hlavács1, D Janovszky, V Kárpáti, Gy Krállics1, T Mikó1, A B Palotás1, M Sepsi1, G Szabó1, P Szobota1, M Szűcs1
1University of Miskolc, Faculty of Materials Science and Engineering, Miskolc, Hungary
2CERN, Geneva, Switzerland E-mail: femvali@uni-miskolc.hu
Abstract. A research team at the University of Miskolc's Faculty of Materials Science and Technology has signed a cooperation agreement with the Geneva-based European Organization for Nuclear Research (CERN) for testing of the materials employed in the Crab Cavities will be installed in the next generation of the LHC (the so-called High Luminosity Large Hadron Collider – HL-LHC). At the University of Miskolc, high purity niobium rolling experiments were carried out in conventional (unidirectional) and cross-rolled manners in order to increase the deep drawability of the final sheet. The deformability of niobium was measured by Watts- Ford and compression tests. The microstructure and anisotropy (texture) results of the initial material and the straight-rolled products are reported.
1. Introduction
Crab Cavities, SRF cavities of non-axisymmetric shape, made of ultra- high purity Nb are essential parts of the HL-LHC project. These components are submitted to complex metal sheet forming processes, especially deep drawing [1]. The initial material of deep drawing is always a cold rolled product whose technical characteristics and crystalline texture determine its deep drawability. Ideally, the properties of the plate during deep drawing are direction-independent and isotropic.
Unidirectional rolling is one of the bulk metal forming processes, where metal is plastically deformed by allowing it to flow between two rollers which rotate in opposite senses. The rolling process not only reduces the thickness associated with elongation in length, but also enhances material properties like strength, toughness and texture. The purpose of several researchers in this field is to improve the quality of the product through optimizing the process parameters [2-6]. For unidirectional or straight rolling, where it is considered as a plane strain deformation, the sample has an orthorhombic symmetry.
Symmetry is something that will bring a sample into coincidence with itself when certain operations are performed it. Orthorhombic symmetry means all the three (rolling, transverse, and normal) directions of the sample are axes of twofold symmetry. For cross rolling, where the sample is rotated by 90° after each pass, the sample symmetry becomes tetragonal, having one fourfold axis which is parallel to the normal direction [7]. That is why cross rolling is a way of reducing the directional dependency of the different properties of the rolled plate. This method can be advantageous in the case of avoiding the earing during deep drawing. [8-10].
During plastic deformation process of polycrystalline metals, the crystallographic orientation of each
12th Hungarian Conference on Materials Science (HMSC12)
IOP Conf. Series: Materials Science and Engineering 903 (2020) 012019
IOP Publishing doi:10.1088/1757-899X/903/1/012019
2
In case of unidirectional rolling, strong textures, which may lead to significantly different properties in the rolling and transverse directions, are formed in the direction of the rolling. In cross rolling, due to continuous change in rolling direction, the microstructure, the texture and the plastic anisotropy will be different than that obtained in unidirectional rolling.
Texture, generally characterized by a crystallographic plane and a crystallographic direction, can be represented graphically in pole figures and orientation distribution functions (ODF). Basically, this representation indicates the intensity of an orientation or texture component, which depends on the number of grains having same orientation [12].
The aim of the present research is to determine the deformability, reveal the developed microstructure and texture and recrystallization temperature of a niobium sheet during unidirectional rolling. The critical levels of deformation steps had been calculated by finite elements analysis as a representative of the effective plastic strain seen by the niobium sheets during deep drawing operation. The obtained results will serve as fundamental data for the upcoming cross rolling process of the examined niobium sheets.
2. Experimental
3 pieces of high purity niobium sheets of 4 mm nominal thickness, 50 mm width and 100 mm length provided by CERN (and supplied by Ningxia Orient Tantalum Industry Co. Ltd, (OTIC)) were employed in the rolling experiments. Their composition of impurities, given by certificate is presented in Table 1.
In the as received condition, the sheets have moderate grain size and distribution (Figure 1.). The sampling for different tests and the sample identification are shown in Figure 2. Samples with identification 1W2 and 1W2 were subjected to a Watts-Ford test and subsequently to microstructure investigation. The cylindrical samples with diameter of 4 mm, represented by yellow circles, were subjected to multi-step compression tests. The remaining part (20mm x 50mm) of sample ID 1, went true in unidirectional rolling as an initial test sample.
Table 1. Chemical concentration of the impurities by certificate (ppm) [1]
Ta Zr Fe Si W Ni Mo Hf Ti Cr+Co H N O C
300 5 5 10 <5 <5 <5 10 <5 <10 1 8 7 10 The rolling process was performed with a Von Roll rolling mill employing two high rolling modes at room temperature. The roll diameter and its length were 220 mm. Prior to each pass, the rolls were lubricated with a mineral oil-based lubricant (PetroPal) through nozzles. The rolling speed was kept constant at 30 m/min throughout the entire rolling process and the force and the torque were recorded for each pass. To reach the final thickness the rolling process was interrupted by intermediate samplings.
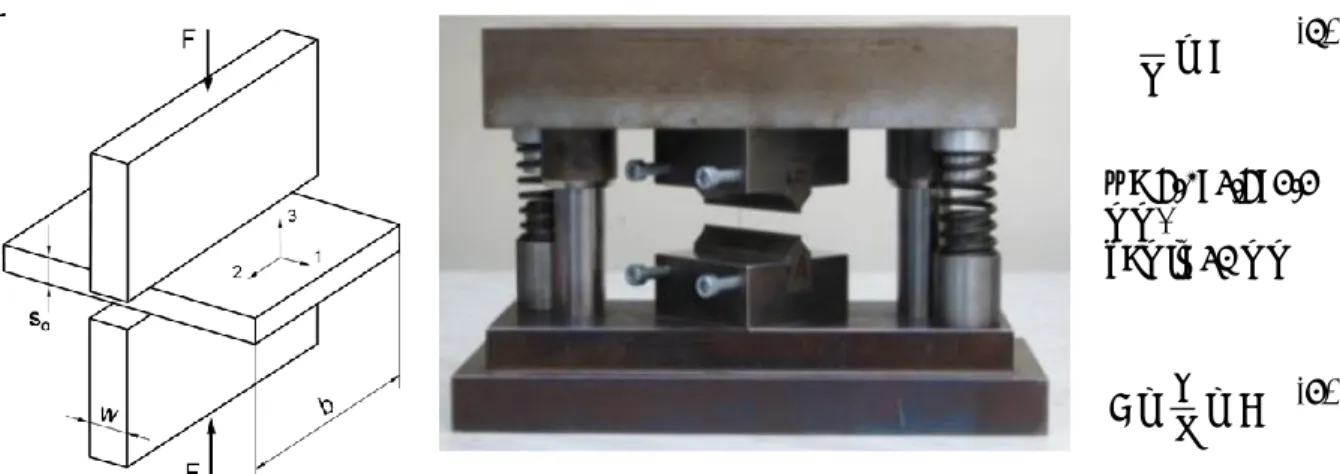
A Watts-Ford test (plain strain compression test) was performed to achieve the flow stress curve of niobium under compression. The geometric parameters and the applied tool can be seen in Figure 3.
During the test the following conditions were fulfilled:
Figure 1. Microstructure of the initial niobium sheet in the as received
condition
Figure 2. Sample identifications
12th Hungarian Conference on Materials Science (HMSC12)
IOP Conf. Series: Materials Science and Engineering 903 (2020) 012019
IOP Publishing doi:10.1088/1757-899X/903/1/012019
𝑏
𝑤≥ 5 (1)
w= 6.0; 3.6; 2.2 mm,
b=min 31 mm
2 <𝑤
𝑠 < 4 (2) Figure 3. Geometry for Watts-Ford test (s0 – initial thickness of specimen, b – initial length of
specimen, w – width of dies, F- force) and the inserted die in holder
Based on the results of the Watts-Ford test, we used finite element simulation (MSC.Marc software) to calculate the equivalent Von Mises Stress during rolling. Multi-step compression test on three cylindrical specimens by 0.5 mm reduction steps were performed by Instron 5982 type universal mechanical tester. The maximal (D1) and the minimal (D2) diameter of the samples were measured by an optical system. A ratio of D1/D2 was calculated and plotted as a function of reduction.
According to the supplier, the initial sheets have seen a light levelling operation after the last annealing treatment the texture investigation was also done not only on the rolled but also on the initial sheets. A Bruker D8 Advance diffractometer, equipped with a Eulerian cradle with CoKα radiation and line focus of 20 mm, was used for texture measurements. The {200}, {310} and {110} pole figures of the initial and rolled sheets were measured. Ferrite powder was used for defocusing correction. The pole figure recalculation was done using triclinic deformation while ODF calculation using the software, TEXEVAl, of the equipment.
Thermal analysis, in a Netzsch STA 449 F1 Jupiter Simultaneous TG-DTA/DSC (Netzsch Ltd.) apparatus at a heating rate of 0.16 K/s, was performed to determine the recrystallization temperature.
The samples for these measurements were kept in closed Al2O3 crucibles and were under a continuous 99.9999% Ar flow. Optical microscopy was used to characterize the rolled and the recrystallized (after the DSC cycle) microstructure.
3. Results and discussion
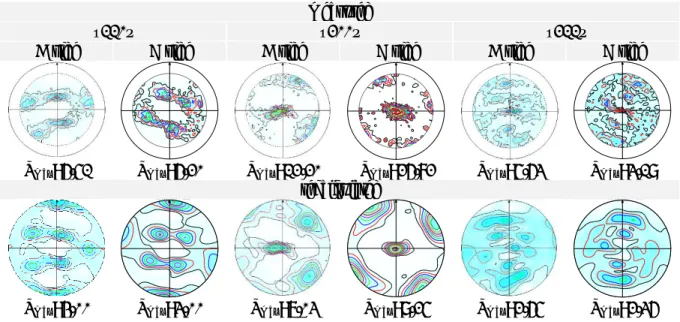
The measured and recalculated pole figures with texture numbers and calculated α fibers for both sides of the 1W1 initial samples (as received) can be seen in Figure 4. Due to the shape and the asymmetry of the curves it is obvious that a strong shear component is present in the texture. The pole figures were determined for both sides of the sheet (sides A and B) and the comparison of the pole figures shows that the initial sheet was probably cross rolled, but rolling in one direction caused more deformation than in the other direction (Figure 4). This is apparent on the α fibers as well (Figure 5). The asymmetric lubricant condition during unidirectional rolling can also be a reason for this strong shear component.
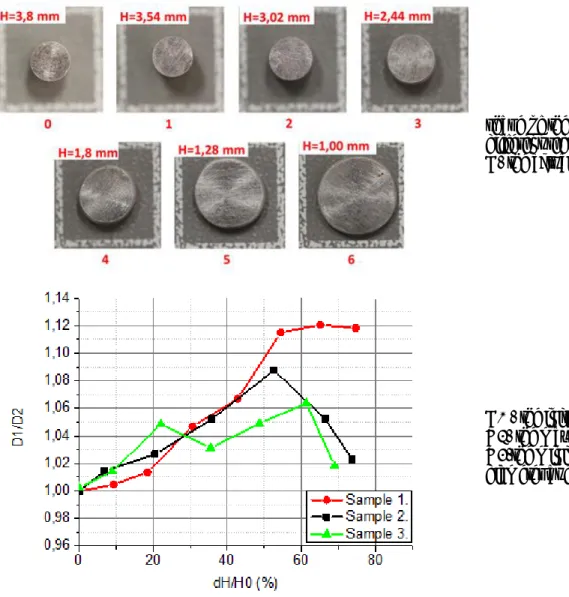
Figure 6 shows the optical view of one sample after multi step compression tests and the evaluation of D1 and D2 diameter of three parallel samples. The D1/D2 value of two samples shows a maximum in two cases. Maximum means that in the initial phase of the reduction the deformation is strongly anisotropic (ellipsoidal shape of the disk), and after the maximum the ovality decreases. This kind of behavior refers to the state of the inhomogeneous texture of the initial plate confirming the results obtained from the pole figures. This type of behavior should be kept in mind in any future interpretation of the rolling texture.
12th Hungarian Conference on Materials Science (HMSC12)
IOP Conf. Series: Materials Science and Engineering 903 (2020) 012019
IOP Publishing doi:10.1088/1757-899X/903/1/012019
4
measured
{110} {200} {211}
A side B side A side B side A side B side
Tmax: 6.51 Tmax: 6.20 Tmax: 12.20 Tmax: 26.82 Tmax: 5.63 Tmax: 3.19 recalculated
Tmax: 4.00 Tmax: 3.00 Tmax: 7.03 Tmax: 9.25 Tmax: 2.65 Tmax: 2.36 Figure 4. Measured and recalculated pole figures of the initial sample ID 1W1, sides A and B
alpha fiber, A side alpha fiber, B side
Figure 5. Alpha fiber of the initial sample ID 1W1, sides A and B
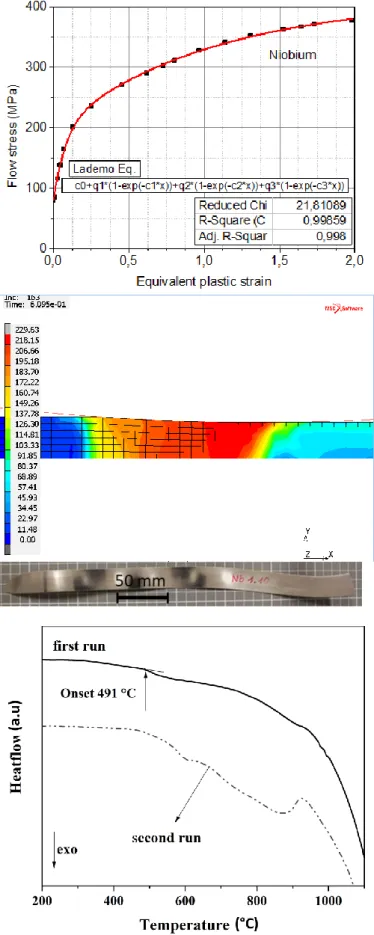
The fitted flow curve of niobium, determined by the Watts-Ford test and Lademo fitting, can be seen in Figure 7. Based on the measured equivalent plastic strain, a finite element simulation of stress distribution in the longitudinal section of niobium during one rolling pass was performed. The two- dimensional static model includes a rigid roll and the sheet sample defined as a linear elastic and nonlinear plastic material. The body of niobium sheet meshed with four noded, quad type element and the total number of finite elements was 900. The flow stress data provided by plain strain compression
Measured PF 110 Measured PF 200 Measured PF 211
Calculated PF 110 Calculated PF 200 Calculated PF 211
12th Hungarian Conference on Materials Science (HMSC12)
IOP Conf. Series: Materials Science and Engineering 903 (2020) 012019
IOP Publishing doi:10.1088/1757-899X/903/1/012019
test. The Kudo’s frictional model was applied to simulate the friction between roll and sheet material.
The difference between the values of measured and calculated force was minimized by modifying the friction factor. The average values of measured and calculated force in the first pass are respectively Fm=61.021 kN and Fc=64.989 kN. The result of the simulation for the upper half part of the niobium section is showed in Figure.8.
To test the boundary states of rolling and the friction problems, a unidirectional rolling experiment was performed on a small sample (ID1). After 10 steps of rolling with a deformation of 2.667 φ., the final thickness that was obtained was 0.28 mm. The resulting ribbon was wavy, and this is due to the small sample size (Figure 9.).
shape of the sample after different reduction, H- the actual high
H0 - the initial high, D1- the maximum, D2-the minimum diameter at each step
Figure 6. Results of multi-step compression test. Samples 1, 2 and 3 are parallel tests.
12th Hungarian Conference on Materials Science (HMSC12)
IOP Conf. Series: Materials Science and Engineering 903 (2020) 012019
IOP Publishing doi:10.1088/1757-899X/903/1/012019
6
Figure 7. Flow curve of niobium based on Watts-Ford test.
Figure 8. Finite element simulation of the equivalent Von Mises Stress during rolling in the half longitudinal section of niobium strip.
Figure 9. Rolled niobium strip.
Figure 10. DSC curve of sample 1.6 after 6 steps rolling, φ=1.435.
12th Hungarian Conference on Materials Science (HMSC12)
IOP Conf. Series: Materials Science and Engineering 903 (2020) 012019
IOP Publishing doi:10.1088/1757-899X/903/1/012019
DSC analysis showed that recovery, stress relaxation and recrystallization started at 491° C (Figure 10). An effect of the oxidization process is also visible even though shielding gas was used. The microstructures formed after the rolling and DSC are shown in Figure 11. The microstructure after the DSC cycle shows not only recrystallization but also grain coarsening.
In Figure 12, the rolling texture evaluation can be clearly seen on the pole figures and α fibers (Figure 13) of the samples subjected to 6 (φ=1.435), and 10 passes (φ=2.667). It is also apparent that the texture is sharper after 10 passes compared to 6 passes.
a)
b)
c)
Figure.11. Microstructures after a) 6 steps rolling b) after 10 steps rolling and c) after DSC test.
measured
{110} {200} {211}
No. 1.6 No. 1.10 No. 1.6, No. 1.10 No. 1.6 No. 1.10
Tmax: 1.95 Tmax: 2.49 Tmax: 4.50 Tmax: 7.43 Tmax: 1.93 Tmax: 2.06 recalculated
Tmax: 1.86 Tmax: 1.93 Tmax: 3.20 Tmax: 4.51 Tmax: 1.35 Tmax: 1.83 Figure.12. Measured and recalculated pole figures of the rolled No. 1.6 (φ=1.435) and No. 1.10
(φ=2.667) samples.
4. Conclusion
Based on the mechanical experiments, the rolling plan of the examined niobium sheet was established.
The rolling experiment was performed in 10 steps up to φ=2.667 deformation at room temperature.
Although the resulting ribbon was wavy, due to the small sample size, it was revealed that at room temperature niobium can be rolled very well. It was also found that the recrystallization of the rolled
Measured PF 110 Measured PF 110 Measured PF 200 Measured PF 200 Measured PF 211 Measured PF 211
Calculated PF 200 Calculated PF 211 Calculated PF 211
12th Hungarian Conference on Materials Science (HMSC12)
IOP Conf. Series: Materials Science and Engineering 903 (2020) 012019
IOP Publishing doi:10.1088/1757-899X/903/1/012019
8
Acknowledgement
The research was carried out at the University of Miskolc, within the framework of the Thematic Excellence Program funded by the Ministry of Innovation and Technology of Hungary. The present paper was supported through the National Research, Development and Innovation Office – NKFIH K119566 project and the new national excellence program of the ministry of human capacities. Author say thanks to Department of Materials Science and Engineering (BME) for Watts-Ford test.
alpha fiber, No. 1.6 (φ=1.435) alpha fiber, No. 1.10 (φ=2.667)
Figure.13. Measured and recalculated pole figures and alpha fiber of the rolled No. 1.6 (φ=1.435) and No. 1.10 (φ=2.667) samples.
References
[1] Gallifa Terricabras A at al 2019 Assessment of the Mechanical Properties of Ultra-High Purity Niobium after Cold Work and Heat Treatment with the HL-LHC Crab Cavities as Benchmark, Proc SRF2019. 19th International Conference on RF Superconductivity, Dresden, Germany, 27.
Jun. 2019. p 7
[2] Neugebauer at al 2002 J. Mater. Process. Tech. 125–126 856–862 [3] Li X and Al‐Samman T 2011 Mater. Des. 32 4385–4393
[4] Wronski S at al 2013 Mater. Charact. 77 116–126 [5] Huh M Y at al 2011 Mat. Sci. Eng. A A315 35–46 [6] Tang W at al 2015 J. Mater. Process. Tech. 215 320–326
[7] Davim J P 2015 Modern Manufacturing Engineering (Switzerland: Springer) [8] Fukui S and Kudo H Rep. Inst.Sci. Tech. Univ. Tokyo 4 33
[9] Tucker G E G 1961 Acta Metall. 9 275–286
[10] Engler O at al 2011 J. Mater. Process. Tech. 211 1278–1284
[11] Kocks U Fat al 1998 Texture and Anisotropy, Preferred Orientations in Polycrystals and their Effect on Materials Properties (UK: Cambridge University Press)
[12] Engler O and Randle V 2010 Introduction to Texture Analysis, macrotexture, Microtexture, and Orientation Mapping Second Edition (USA: CRC Press)
![Table 1. Chemical concentration of the impurities by certificate (ppm) [1]](https://thumb-eu.123doks.com/thumbv2/9dokorg/851460.44931/3.893.108.793.660.1013/table-chemical-concentration-impurities-certificate-ppm.webp)