Prediction of Earing of Aluminium Sheets from {111} Pole Figures
M. Benkea,*
aInstitute of Physical Metallurgy, Metalforming and Nanotechnology, University of Miskolc, Miskolc, Hungary
*e-mail: fembenke@uni-miskolc.hu
Received May 18, 2020; revised May 28, 2020; accepted June 2, 2020
Abstract—Crystallographic texture causes anisotropic formability of metal sheets, which results in the forma- tion of uneven cup heights during deep drawing, called earing. Over the past decades, several methods had been developed to predict the earing behaviour of aluminium alloys. These methods are rather complex and can only be applied within strict sheet thickness ranges. Recently, a simple method has been presented and successfully applied on different sheet thicknesses. The method relies solely on {h00} type pole figure data.
However, it is desired to be able to predict earing from other ref lections as well. In this manuscript, a method which predicts the type and magnitude of earing only from the data of {111} pole figure measurements, is pre- sented. The method was applied on a series of 0.3 and 3 mm thick cold rolled and annealed aluminium sheets, exhibiting rolling and recrystallization textures and the combination of these. It is shown that the proposed method gave similar results to those of deep drawing tests. It is concluded that using the presented method, the earing of aluminium sheets can be characterized solely from {111} pole figure measurement data.
DOI: 10.1134/S1063774520060061
INTRODUCTION
Mechanical anisotropy of aluminium sheets is gov- erned by crystallographic texture. If the texture is strong, mechanical properties such as formability will have a strong dependence on the direction of inspec- tion. This is usually characterized by deep drawing tests during which circular samples, called blanks are forced in the shape of cups. Strong texture results uneven cup heights, where height maximums, called ears, and throughs follow each other. In case of four- fold earing, ears appear in the 45° + (n × 90°) (n = 0, 1, 2, 3) with respect to in the rolling direction (RD) if the sheet exhibits cold rolling texture, while in the RD + (n × 90°) directions if recrystallization texture is developed [1, 2]. It is impossible to achieve a complete absence of ears, but by the combination of annealing texture and deformation texture, an optimal case with minimal earing can be achieved [2–5]. The simplified picture of this optimal case is the idealized earing-free case. Besides deep drawing tests, several calculation methods had been developed to predict earing. These methods require input data which either originates from mechanical tests [6, 7] or texture examinations [8, 9]. Nowadays, finite element methods are pre- ferred to reduce costs [10–13]. Most of these methods are based on idealized theoretical material behaviour, or the combination of some of those. Thus, the calcu- lation process is quite complex, and, in most cases,
their applicability is limited to certain geometries.
Recently, a new approach which relies solely on the data of pole figure measurements of {h00} type ref lec- tions has been proposed and validated [14]. The tech- nique is based on the correspondence between high intensities of {h00} pole figures and observed earing.
The method does not contain theoretical material laws; therefore, it is very simple, and it was successfully applied on sheets with different thicknesses. Theoreti- cally, such a technique could be combined with non- destructive (sample cutting-free) texture measure- ments proposed by Sepsi et al. [15]. This combination would greatly widen the applicability of earing predic- tion and reduce costs and time as it could be applied directly on industrial size coils instead of cut-out sam- ples. However, at this point, the non-destructive tex- ture measurement method cannot be realized on {h00}
type pole figures, only on {111} due to a limited 2θ examination range. On the other hand, the observed correspondence does not exist between earing and pole figures other than the {h00}. Therefore, the exist- ing earing prediction method cannot be combined with the non-destructive pole figure measurements.
The aim of the present manuscript is to develop an earing prediction method to {111} pole figures that inherits all benefits of the previous one.
EXPERIMENTAL
The examined 1050 type Al sheets were manufac- tured by ARCONIC-Kofem Hungary Ltd. The sheets were obtained in cold rolled state with 3 and 0.3 mm thicknesses. The 0.3 mm thick sheets were annealed at 300°C and the 3 mm thick sheets at 340°C for different durations. Samples were cut from the annealed sheets for deep drawing tests carried out by ARCONIC- Kofem Hungary Ltd. with the following parameters in the case of 3 mm sheet thickness blank diameter:
63.78 mm; die opening diameter: 39.79 mm; punch diameter: 32.92 mm; punch profile radius: 5 mm and in the case of 0.3 mm sheet thickness blank diameter:
60 mm; die opening diameter: 33.86 mm; punch diameter: 32.88 mm; punch profile radius: 5 mm.
Average earing (Z, %) was determined based on Eqs. (1)–(5).
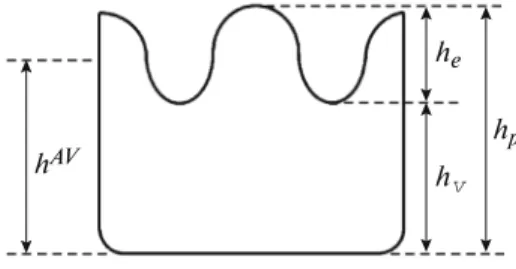
(1) (2) (3) (4) (5) where is the peak height; is the average peak height; is the valley height; is the average valley height; is the average ear height; is the average cup height; Z is the average earing (Fig. 1). By definition, rolling type earing is designated with a negative sign and recrystallized type earing with a positive sign [14].
Samples with diameter of 30 mm were cut from the annealed sheets for pole figure measurements. The examinations were carried out with a Bruker D8 Advance type X-ray diffractometer equipped with an Eulerian cradle using CoKα radiation. Incomplete {111}, {200}, and {220} pole figures were measured in the χ = 0°–75° tilting range in continuous sample rotation mode. After background subtraction and defocusing correction, calculation of complete pole
=( 1+ 2 + 3 + 4)/4,
p p p p p
h h h h h
= + + +
v ( v1 v2 v3 v4)/4,
h h h h h
= − v,
e p
h h h
=( p + v)/2,
h h h
=( / ) 100,e ×
Z h h
hpn hp
vn
h hv
he h
figures was performed for three incomplete {111}, {200}, and {220} pole figures with the original software of the device (TexEval) using series harmonic func- tions.
In Fig. 2a, Ihkl(χϕ), the intensity of a {hkl} ref lec- tion at a given tilting angle (χ) and 0° sample rotation from RD (ϕ) is shown in the pole figure coordinate system from the viewpoint of the transverse direction (TD). Here, the vertical axis is intensity and the dis- tance of the pole from the centre is equal to the tilting angle (χ). In Fig. 2b, Ihkl(χϕ) is shown in the sample coordinate system (ND is the normal direction). In this coordinate system it can be seen that weighting Ihkl(χϕ) with sinχ gives the vertical projection of Ihkl(χϕ) on the rolling plane (RD-TD). All weighted Ihkl(χϕ) intensities yields the vertical projection of the full intensity distribution function (IDF) on the rolling plane. In practice, this can be estimated as described in [14]. In short, every χ-cut (Intensity versus χ plot at a given ϕ) of the recalculated pole figure is fitted with a series of Gaussian functions. The areas of the Gauss- ian functions are weighted with the sin of their peak position. The weighted intensities are summarized for the given χ-cut. Finally, the summarized intensities are plotted as a function of ϕ.
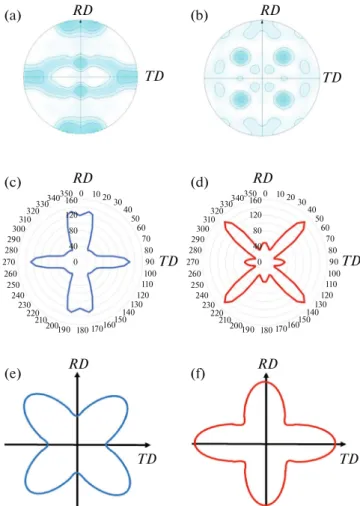
Typical cold rolled {111} pole figure of Al is shown in Fig. 3a, that of recrystallized Cu sheet is presented in Fig. 3b. Figures 3c and 3d show the vertical projec- tions of the {111} full intensity distributions on the roll- ing plane of the cold rolled Al and recrystallized Cu, respectively. The typical cold rolled earing is shown in Fig. 3e and the recrystallized earing in Fig. 3f.
In the cold rolled state, the projection of the full intensity distribution (Fig. 3c) exhibits a two-fold character, similarly to the {111} pole figure (Fig. 3a).
High intensities appear in the RD and RD + 180° directions and smaller intensity peaks are also present in the RD + 90° and RD + 270° directions (Fig. 3c).
Actually, these are the directions where throughs and
Fig. 1. Parameters used for the calculation of average ear- ing of deep drawn cups [14].
hAV
he hp hv
Fig. 2. Views of the intensity of a hkl ref lection at χ tilting angle and 0°ϕ rotation from the viewpoint of TD (a) in the pole figure coordinate system, (b) in the sample coordi- nate system.
(а) Ihkl(FM)
Ihkl(FM)sinF Ihkl(FM) F
F
F RD
Intensity ND (b)
0˚ 90˚
45° + (n × 90°) directions (Fig. 3d). Again, these are the directions, in which throughs are observed on deep drawn cups (Fig. 3f). Thus, it can be stated that the vertical projection of the {111} full intensity distribu- tion function on the rolling plane can be used to char- acterise the type of earing. Similarly to as it was shown on deep drawn cups, predicted average earing can be determined as the ratio of the average value of intensity
“ears” (intensity peaks-intensity valleys) and average intensity. Here, predicted average earing is determined from diffracted intensities and not cup heights. While the former depends on the parameters of the texture measurement (sample size, spot size, etc.), the latter depends on the parameters of the deep drawing test (blank diameter, die opening diameter, etc.). Conse- quently, the two values differ from each other. Thus, in order to obtain comparable values with those deter- mined from deep drawing tests, a scaling factor must be introduced. Since the same parameters were used for texture measurements and the deep drawing test parameters of the 0.3 and 3 mm thick sheets were close to each other, the same scaling factor could be used for all examined samples. The scaling factor can be deter- mined by dividing the values of predicted average ear- ing obtained from diffracted intensities with those derived from cup heights. In the present research the scaling factor was found to be 10. It is worth to note that the use of scaling factor is not necessary when the aim is to specify the annealing time required for mini- mal earing and not to determine the exact value of average earing. Again, rolling type intensity distribu- tion is designated with a negative sign and recrystal- lized type with a positive sign.
RESULTS AND DISCUSSION
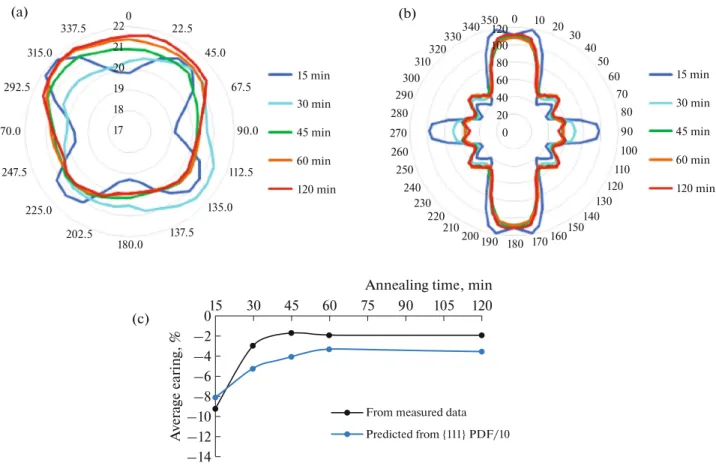
Figure 4 summarizes the results of the 0.3 mm thick sheet after annealing heat treatments at 300°C. Fig- ure 4a shows measured cup height values in the RD- TD coordinate system. It can be seen that after 15 minute annealing, ears appear in the RD + 45° + (n× 90°) directions corresponding to a notable rolling type earing. After 30 minute annealing, the rolling ear- ing is still present, but it is much weaker. After longer annealing times, measured cup heights seem to be almost completely even as a function of ϕ. In Fig. 4b, the vertical projection of the {111} intensity distribu- tion function on the RD-TD plane is presented. After 15 min annealing, high intensities appear in the RD and RD + 180° directions and somewhat lower inten- sities in the RD + 90° and RD + 270° directions resembling a strong rolling type pole distribution. This character is weaker after 30 min annealing. After 45 min and longer annealing times, the rolling type intensity
distribution is weaker, but it is still easily recognizable.
In Fig. 4c, the average earing calculated from mea- sured cup heights and from {111} IDFs are plotted ver- sus annealing time. It can be seen that the variations of average earing determined from both measured cup height data and {111} IDFs have the same tendency.
After 15 min, rolling type earing is strong, which is notably weakened after 30 min annealing. After 45 min, the rolling type earing is further weakened and reaches the minimal value after 60 min. Prolonged annealing heat treatments do not change the magnitude and type of earing.
Despite the numerical values of the functions determined from measured cup heights and {111} IDFs slightly differ, the minimal annealing time can be determined from both functions. This means that the optimal annealing time can be obtained based on {111}
Fig. 3. Comparison between rolled Al and recrystallized Cu: (a) rolled Al{111} pole figure, (b) recrystallized Cu{111} pole figure, (c) vertical projection of rolled Al{111}
intensity distribution function on the RD-TD plane, (d) vertical projection of recrystallized Cu{111} intensity distribution function on the RD-TD plane, (e) earing of rolled Al, (f) earing of recrystallized Cu.
TD
RD RD
RD RD
TD TD
TD TD
TD
(c) (d)
(e) (f)
0 40 80 120 1600 10 2030
40 50
60 70
80 90 100 110 120 130 140 160150 190 180 210200 220 230 240 250 260 270 280
290 300
310 320330340350
170
0 40 80 120 1600 10 2030
40 50
60 70
80 90 100 110 120 130 140 160150 190180 210200 220 230 240 250 260 270 280 290
300 310
320330340350
170
pole figure data without the need to perform deep drawing tests. Furthermore, it was seen in Fig. 4c that although its magnitude is small, the rolling type earing is preserved even after 60 min and 120 min annealing.
This could not be univocally seen on the measured cup height functions (Fig. 4a), but it is apparent from the {111} intensity distribution functions (Fig. 4b).
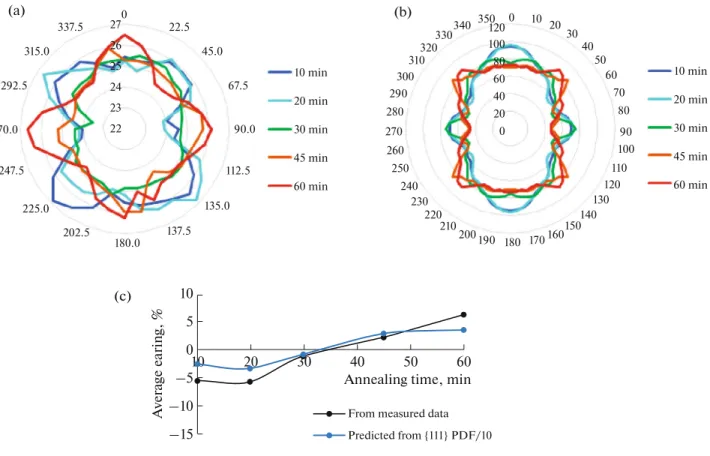
In Fig. 5, results of the 3 mm thick sheets annealed at 340°C can be seen. Figure 5a shows the measured cup height values versus ϕ. It is apparent that the roll- ing type earing turns into recrystallized type earing as annealing time is increased. After 10 min annealing strong rolling type earing is present which weakens after 20 min annealing. In the sheet annealed for 30 min negligible earing is obtained. After 45 min annealing, maximal cup heights can be found in the RD + (n × 90°) directions, meaning that recrystallized type earing is developed which strengthens after 60 min annealing. In Fig. 5b, the vertical projection of the {111} intensity distribution function on the RD–TD plane is shown. After annealing heat treatments for 10 and 20 min, high intensities are in the RD and RD + 180° directions and lower peaks appear in the RD +
90° and RD + 270° directions. No notable differences can be seen between the plots of samples subjected to 10 and 20 min heat treatments. Due to 30 min anneal- ing, the rolling type pole distribution is notably weak- ened. Intensity peaks can be observed in the RD + 45°+ (n × 90°) directions after 45 and 60 min anneal- ing, which corresponds to the recrystallization state.
In Fig. 5c, average earing functions versus annealing time are plotted. Again, similar variations can be seen between functions derived from cup height and {111}
IDF data. Rolling type earing is preserved after 10 and 20 min heat treatments, while no earing is present after 30 min annealing. If the treatment is enlength- ened to 45 min, recrystallized type earing develops, which further strengthens due to the 60 min annealing.
It can be clearly seen that the annealing time required to obtain minimal earing can be determined from both average earing plots. Thus, it can be con- firmed that the optimal time of annealing heat treat- ment can be determined based on pole figure mea- surements without performing deep drawing tests.
Fig. 4. Results of the 0.3 mm thick Al sheet annealed at 300°C for different durations, (a) measured cup heights versus ϕ on the RD-TD plane, (b) vertical projection of the {111} intensity distribution function versus ϕ on the RD-TD plane, (c) average and predicted average earing.
(а) (b)
15 min
220 0 10
2030 40
50 60
70 80 90 100 110 120 130 140 160150 210200
220 230 240 250 260 270 280 290
300 310
320
330340350
190 180 170 120 100 80 60 40 20 0 22.5
337.5
45.0 315.0
90.0
135.0 225.0
270.0
180.0
112.5 247.5
137.5 202.5
67.5 292.5
21 20 19 18 17
30 min 45 min 60 min 120 min
15 min 30 min 45 min 60 min 120 min
(c)
Annealing time, min
Average earing, %
From measured data Predicted from {111} PDF/10
–14 –12 –10 –8 –6 –4 –2
015 30 45 60 75 90 105 120
CONCLUSIONS
A method was presented which can be used to pre- dict the type and magnitude of earing of aluminium sheets solely from the data of {111} pole figures. It was found that the results obtained with the presented method gave satisfactory results when compared to the results derived from deep drawing tests. It is concluded that the proposed method is applicable to characterize the earing behaviour of aluminium sheets and to deter- mine the optimal annealing time to obtain minimal earing without the need of additional examinations or calculations.
FUNDING
This work was supported by the János Bolyai Research Scholarship of the Hungarian Academy of Sciences. Tex- ture measurements were carried out within the NKFIH K119566 project.
REFERENCES
1. T. Sheppard and M. A. Zaidi, Met. Tecnol. 9, 368 (1982).
2. O. Engler, Mat. Sci. Eng. A 538, 69 (2012).
3. W. B. Hutchinson, A. Oscarsson, and A. Karlsson, Mat. Sci. Tecnol. 5, 1118 (1989).
4. X.-M. Cheng, J. Mater. Eng. Perform. 10 (4), 399 (2001).
5. Z. Zhao, W. Mao, F. Roters, and D. Raabe, Acta Ma- ter. 52, 1003 (2004).
6. S. Fukui and H. Kudo, Rep. Inst. Sci. Tech. Univ. To- kyo 4, 33 (1950).
7. R. Sowerby and W. Johnson, J. Strain Anal. 9, 102 (1974).
8. C. S. Da Costa Viana, G. J. Davies, and J. S. Kallend, in Proceedings of the Fifth International Conference on Textures of Materials (Aachen, 1978), p. 447.
9. P. Van Houtte, G. Cauwenberg, and E. Aernoudt, Mat.
Sci. Eng. 95, 115 (1987).
10. O. Engler and S. Kalz, Mat. Sci. Eng. A 373, 350 (2004).
11. O. Engler and J. Hirsch, Mat. Sci. Eng. A 452‒453, 640 (2007).
12. O. Engler, L. Löchte, and J. Hirsch, Acta Mater. 55, 5449 (2007).
13. O. Engler, N. Mertens, and P. Van Dam, J. Mater. Pro- cess. Tech. 211, 1278 (2011).
14. M. Benke, A. Hlavacs, I. Piller, et al., Eur. J. Mech.
A Solids 81, 103950 (2020).
15. M. Sepsi, V. Mertinger, and M. Benke, Mat. Char. 151, 351 (2019).
Fig. 5. Results of the 3 mm thick Al sheet annealed at 340°C for different durations: (a) measured cup heights versus ϕ on the RD- TD plane, (b) vertical projection of the {111} intensity distribution function versus ϕ on the RD-TD plane, (c) average and pre- dicted average earing.
10 min 60
70 80
90 100 110 120 130 140 160150 210200
220 230 240 250 260 270 280 290
300
190 180 170 60 40 20 90.0 0
135.0 225.0
270.0
180.0
112.5 247.5
137.5 202.5
67.5
292.5 24
23 22
20 min 30 min 45 min 60 min
20 min 30 min 45 min 60 min
(c)
Annealing time, min
Average earing, %
From measured data Predicted from {111} PDF/10
–15 –10 –5 0 5 10
20 30 40 50 60
10