0139–3006 © 2019 The Author(s) DOI: 10.1556/066.2019.48.3.3
EVALUATION OF SENSORY AND ANTIOXIDANT PROPERTIES OF COMMERCIAL COFFEE SUBSTITUTES
A. TORMAa, †CS. ORBÁNa, ZS. BODORb and CS. BENEDEKa*
aDepartment of Dietetics and Nutrition Sciences, Faculty of Health Sciences, Semmelweis University, H-1088 Budapest, Vas utca 17. Hungary
bDepartment of Physics and Control, Faculty of Food Science, Szent István University, H-1118 Budapest, Somlói út 14–16. Hungary
(Received: 8 August 2018; accepted: 10 December 2018)
Sensory profi les of commercial coffee substitutes were determined and their possible interdependences with antioxidant characteristics (FRAP, DPPH, ABTS, and CUPRAC), total polyphenol content, and colour were investigated and compared to coffees. Statistically relevant relations were revealed between certain sensory attributes, colour, and antioxidant capacity.
Sensory attributes show distinct patterns for coffees, their blends, and substitutes, but no signifi cant differences between substitutes from different raw materials were found, except for chicory. Although coffees have generally higher antioxidant capacities than their substitutes, these latter, especially chicory-based products, are also valuable antioxidant sources, as only half of them had signifi cantly lower polyphenol and antioxidant contents when compared to coffee.
Principal component analysis was applied to reveal possible differentiation pattern between samples, based on both their sensory and antioxidant attributes.
Keywords: coffee substitute, chicory, sensory analysis, polyphenols, antioxidant
Coffee is one of the most frequently consumed beverages worldwide, although there are some concerns related to the negative aspects of its excessive consumption, in particular to the addictive and stimulating effect of caffeine (MAJCHER et al., 2013). Coffee substitutes offer a favourable alternative to real coffee brews both from economical and health-care points of view (BAEZA et al., 2017). Instant products are also available on the market, as well as coffee substitute blends containing variable amounts of coffee.
Raw materials used for coffee substitutes are rich in polyphenols, although their nature differs from those detected in coffee. Chicory contains high amounts of polyphenols (400–
600 mg gallic acid equivalents/100 g), the dominant compounds being chicoric acid (HEIMLER
et al., 2009), syringic and ferulic acids, and catechin (SAHAN et al., 2017). Barley and rye are also considerable sources of antioxidants (BONDIA-PONS et al., 2009). Additionally, the roasting process of coffee substitutes takes places at temperatures (180–200 ºC), where antioxidant melanoidines are formed in Maillard reaction.
Product quality also involves sensory impressions of coffee and coffee substitutes. In consumer product development, just-about-right scales identify the product attributes that should be changed to achieve higher consumer acceptance (GERE et al., 2015a). Merging consumer data with the results of a trained sensory panel, preference maps can help to
* To whom correspondence should be addressed.
Phone: +36 1 486 4822; fax: +36 1 486 4830; e-mail: benedek.csilla@se-etk.hu
†: deceased
298
understand the differences and similarities between samples and their attributes (GERE et al., 2014; 2015b).
Compared to the literature available on the antioxidant capacity and the sensory profi le of coffee, only limited data are available on its substitutes (MAJCHER et al., 2013; BAEZA et al., 2017; GORJANOVIĆ et al., 2017). The target of the present paper is not only to deliver data on polyphenol content, antioxidant capacity, and sensory profi le of surrogate coffees, but also to reveal the possible relations between their sensory and antioxidant attributes.
1. Materials and methods
1.1. Reagents, solvents, and standards
All solvents and reagents were supplied by Sigma-Aldrich, except ascorbic acid (Riedel-de- Haën), potassium persulphate (Acros Organics), copper(II) chloride (Alfa Aesar), ammonium acetate (Molar Chemicals Ltd.), hydrochloric acid (Carlo Erba), and distilled water.
1.2. Samples
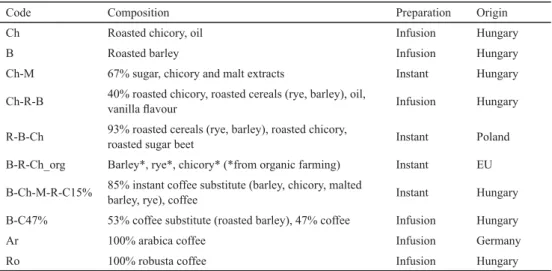
A total of 10 representative samples, purchased in supermarkets, were included in the study (Table 1).
Table 1. Coding, composition, preparation, and origin of samples
Code Composition Preparation Origin
Ch Roasted chicory, oil Infusion Hungary
B Roasted barley Infusion Hungary
Ch-M 67% sugar, chicory and malt extracts Instant Hungary
Ch-R-B 40% roasted chicory, roasted cereals (rye, barley), oil,
vanilla fl avour Infusion Hungary
R-B-Ch 93% roasted cereals (rye, barley), roasted chicory,
roasted sugar beet Instant Poland
B-R-Ch_org Barley*, rye*, chicory* (*from organic farming) Instant EU B-Ch-M-R-C15% 85% instant coffee substitute (barley, chicory, malted
barley, rye), coffee Instant Hungary
B-C47% 53% coffee substitute (roasted barley), 47% coffee Infusion Hungary
Ar 100% arabica coffee Infusion Germany
Ro 100% robusta coffee Infusion Hungary
1.3. Analytical methods
Five replicates were performed for each analytical measurement. Spectrophotometric measurements were performed with a Thermo Helios Alpha UV-VIS spectrophotometer (±0.001 units of absorbance, 1 cm light path). Samples were prepared for analytical measurements according to instructions from packaging (traditional brewing or instant), infusing 3 g coffee substitute/coffee with 100 ml distilled water for 5 min or, for instant products, dissolving 3 g in 100 ml hot distilled water. Cooled brews were decanted by
1.3.1. Total polyphenol content, ferric reducing antioxidant power (FRAP), DPPH, ABTS, and cupric reduction antioxidant capacity (CUPRAC) assays. Total polyphenol content was evaluated following a method adapted from SINGLETON and ROSSI (1965). In FRAP experiments the procedure described by BENZIE and STRAIN (1996) was adapted. DPPH assay was performed according to the procedure by BRAND-WILLIAMS and co-workers (1995), and inhibition rates (I%) were reported. TEAC (ABTS) antioxidant capacity was adapted from RE and co-workers (1999). CUPRAC assay was performed according to APAK and co- workers (2007).
1.3.2. Colorimetry. L*, a*, b* values were analysed by means of a trichromatic refl ection chromameter Konica Minolta CR-410 (Konica Minolta, Osaka, Japan) using a D65 illuminant and CIE: 2° standard observer. The instrument was standardized against a reference white plate (CR-A44) before sample measurements. Coffee samples were spread out at 1 cm depth on a Petri dish, and the L*, a*, b* – values were measured in triplicate, at several points of each sample.
1.4. Sensory analysis
Samples were brewed according to the instructions from packaging. Packaging was not shown to the participants, avoiding thus the effect of brand knowledge (SZŐKE et al., 2012).
Sugar was added to samples equalling the amount of sugar in the sugar-containing sample Ch-M. Two groups of samples were set: coffee substitutes (6 samples) and coffees and their blends (4 samples). Twelve trained panellists were given a complete list of the pre-defi ned taste and aroma determinants (see Figs 1 and 2). Measurements were done in two replicates.
Neutral mineral water was used as taste neutralizer between evaluations (SIPOS et al., 2012).
The sensory tests were carried out meeting all criteria of ISO 13299. The intensity values for the reference samples (sample B-R-Ch_org and B-Ch-M-R-C15%) were pre-defi ned in both groups for each attribute on the evaluation scales.
0 20 40 60 80 Colour depth100
Transparency Hue
Global odour intensity Burnt odour
Coffee odour
Cereal odour Taste character
Aftertaste Bitter taste Sour taste Burnt flavour
Coffee flavour Cereal flavour
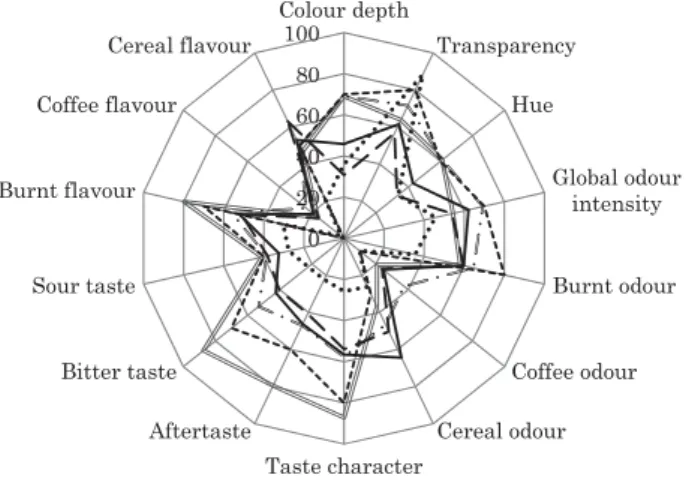
Fig. 1. Sensory profi les of coffee substitutes
: Ch; : B; : Ch-M; : Ch-R-B; : R-B-Ch; : B-R-Ch_org
300
0 20 40 60 80 Colour depth100
Transparency Hue
Global odour intensity
Burnt odour
Coffee odour
Cereal odour Taste character
Aftertaste Bitter taste Sour taste Burnt flavour
Coffee flavour Cereal flavour
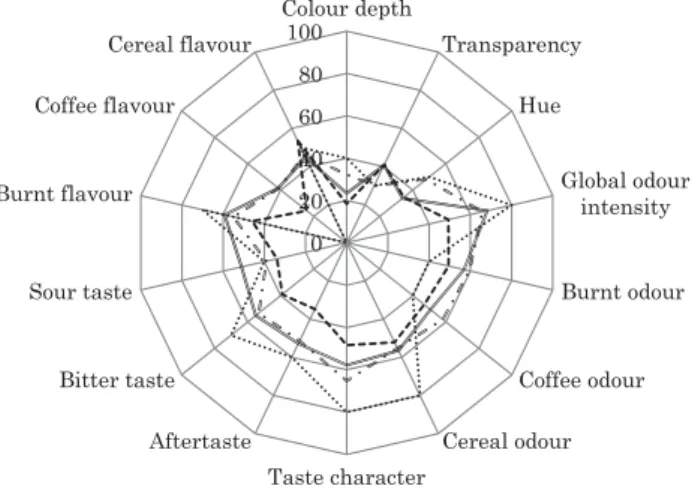
Fig. 2. Sensory profi les of coffees and blends : B-Ch-M-R-C15%; : B-C47%; : Ar; : Ro
1.5. Statistical methods
Kolmogorov–Smirnov test was applied for verifying normal distribution of replicates obtained in TPC, DPPH, FRAP, ABTS, and CUPRAC measurements. Signifi cance of differences between antioxidant capacities of coffees and other samples was analysed by Kruskal-Wallis test using Dunn’s post hoc analysis. Spearman correlation was used for verifying correlations. All statistical analyses were performed at 5% signifi cance level (P=0.05) using GraphPad Prism version 5.00 for Windows, GraphPad Software, San Diego California USA (www.graphpad.com) and XL-Stat Pro (Addinsoft, 28 West 27th Street, Suite 503, New York, NY 10001, USA).
Sensory tests were evaluated by Profi Sens v. 2012 software (KÓKAI et al., 2002;
VÁRVÖLGYI et al., 2015). Profi le analysis was evaluated by one-way analysis of variance (ANOVA), at signifi cance level of 5%, followed by LSD (least signifi cant differences) post hoc tests. Panel performance was examined to identify panellists with poor performance (LOSÓ et al., 2012).
2. Results and discussion
2.1. Polyphenol content and antioxidant capacity
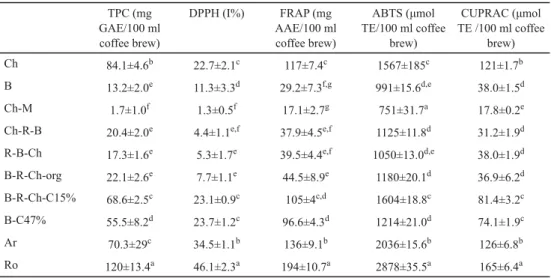
In accordance with previously reported data (KOMES et al., 2015; CONTRERAS-CALDERÓN et al., 2016), total polyphenol content (TPC) showed the highest value for robusta coffee, while arabica had a slightly lower value (Table 2). Coffee blends and pure chicory coffee substitute had polyphenol contents not signifi cantly lower than for robusta, while chicory-containing substitutes showed values not signifi cantly lower than arabica.
Table 2. Polyphenol content (TPC) and antioxidant capacities by DPPH, FRAP, ABTS, and CUPRAC methods of coffees and substitutes
TPC (mg GAE/100 ml coffee brew)
DPPH (I%) FRAP (mg AAE/100 ml coffee brew)
ABTS (μmol TE/100 ml coffee
brew)
CUPRAC (μmol TE /100 ml coffee
brew)
Ch 84.1±4.6b 22.7±2.1c 117±7.4c 1567±185c 121±1.7b
B 13.2±2.0e 11.3±3.3d 29.2±7.3f,g 991±15.6d,e 38.0±1.5d
Ch-M 1.7±1.0f 1.3±0.5f 17.1±2.7g 751±31.7a 17.8±0.2e
Ch-R-B 20.4±2.0e 4.4±1.1e,f 37.9±4.5e,f 1125±11.8d 31.2±1.9d
R-B-Ch 17.3±1.6e 5.3±1.7e 39.5±4.4e,f 1050±13.0d,e 38.0±1.9d
B-R-Ch-org 22.1±2.6e 7.7±1.1e 44.5±8.9e 1180±20.1d 36.9±6.2d
B-R-Ch-C15% 68.6±2.5c 23.1±0.9c 105±4c,d 1604±18.8c 81.4±3.2c
B-C47% 55.5±8.2d 23.7±1.2c 96.6±4.3d 1214±21.0d 74.1±1.9c
Ar 70.3±29c 34.5±1.1b 136±9.1b 2036±15.6b 126±6.8b
Ro 120±13.4a 46.1±2.3a 194±10.7a 2878±35.5a 165±6.4a
Coding: see Table 1. (average±standard deviation, n=5) a, b, c, d, e, f, g: different letters in a column indicate signifi cant differences (at 0.05% signifi cance level)
As there is no universally accepted method available for determination of in vitro antioxidant capacity in foods, a range of assays described in the literature (DPPH, FRAP, ABTS, and CUPRAC) and based on different transfer mechanisms were used in order to achieve a complex characterisation of the coffee substitutes investigated. By applying these, generally similar performances were obtained for the samples, these being in good agreement with their polyphenol content. The values measured are in good agreement with those reported for barley coffee (CARVALHO et al., 2014), chicory (GORJANOVIĆ et al., 2017), and coffee (CONTRERAS-CALDERÓN et al., 2016). Since chicory had the overall best performance, the pure barley substitute being on the other end of the spectrum, it can be concluded that – although in the same range – the antioxidant potential of these substitutes shows a different distribution compared to the results reported by Croatian researchers (KOMES et al., 2015;
GORJANOVIĆ et al., 2017), where barley products reached less disappointing values compared to chicory.
2.2. Sensory analysis
Statistical analysis on signifi cant differences (ANOVA analysis) regarding the sensory attributes of the samples was performed separately for the two sets of samples. Sensory profi le of coffee substitutes (Fig. 1) shows that for pure chicory coffee (Ch), aftertaste and bitterness are signifi cantly more intense than for any other sample, burnt fl avour being also more intense than for many other substitutes. Apart from coffee substitute B-R-Ch_org, chicory has shown signifi cantly more intense taste character and burnt fl avour than any other substitute. This dominancy of bitter and roasted notes was also reported by KOMEs and co- workers (2015). Sample B, containing exclusively barley, is dominated in its aroma by a
302
strong cereal-like note, this being signifi cantly different only from chicory-based samples Ch and Ch-M. Sample R-B-Ch reached the highest scores for coffee-like notes, the lowest values being obtained for samples Ch-M and B-R-Ch_org. The results show that it is not simply the raw materials, but rather their balance and most probably roasting that will infl uence the desired sensory character.
Sensory profi le of coffee-containing samples (Fig. 2) revealed only two properties for which no signifi cant differences were found between samples: transparency, which is low for all coffee-containing samples, and cereal fl avour. Arabica and robusta differ in colour depth, hue, and sourness. The different composition of coffee blends is refl ected in their sensory attributes, especially cereal odour (but not fl avour), bitterness, burnt fl avour (specifi c for chicory) for sample B-R-Ch-C15%, in which substitutes dominate. When samples B-R- Ch-C15% and B-C47% are compared, the higher coffee content of the latter resulted in a more intensive coffee fl avour, but no signifi cant difference regarding coffee odour, burnt and cereal fl avour. On the other hand, coffees and blends show signifi cant differences in bitterness and sourness (this latter being the highest for arabica). Surprisingly, the high cereal content of the blends has only minimal impact on transparency and cereal fl avour. Interestingly, cereal fl avour was found to be in a relatively narrow range for all substitutes, blends, and coffees (45–63%), regardless of composition (except for sample Ch-M, reaching an outstandingly low score), while the same does not apply for cereal odour.
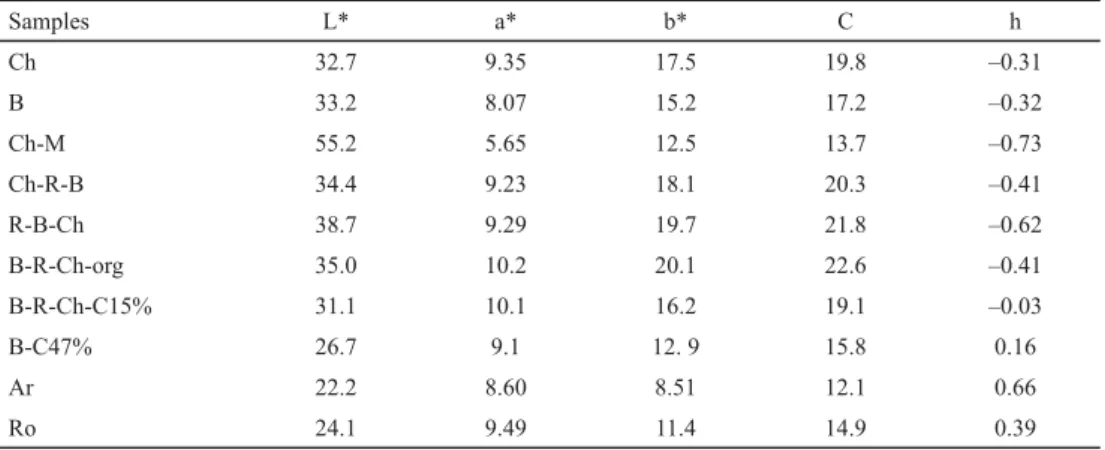
2.3. Colour measurement
Results of measurements of colour parameters such as L* (brightness), a* (red-green scale), b* (yellow-blue scale) and calculated parameters C (chroma, colour strength) and h (hue, colour purity) are presented in Table 3. Kruskal–Wallis analysis of brightness values shows signifi cantly lower values for coffee samples, and the blend containing 47% coffee (B- C47%), coffees, and blends are also generally less yellowish than substitutes. Signifi cant differences between coffee-based products and the rest of the samples are refl ected in colour purity (C) and colour strength (h) as well. Colour differences are attributed to the differences in the type and colour of the melanoidines formed in Maillard process on roasting (ECHAVARRÍA
et al., 2013), these being due mainly to the higher fructose content of chicory.
Table 3. Colour parameters measured in the CIE L*a*b* colour space for coffees, their blends and substitutes
Samples L* a* b* C h
Ch 32.7 9.35 17.5 19.8 –0.31
B 33.2 8.07 15.2 17.2 –0.32
Ch-M 55.2 5.65 12.5 13.7 –0.73
Ch-R-B 34.4 9.23 18.1 20.3 –0.41
R-B-Ch 38.7 9.29 19.7 21.8 –0.62
B-R-Ch-org 35.0 10.2 20.1 22.6 –0.41
B-R-Ch-C15% 31.1 10.1 16.2 19.1 –0.03
B-C47% 26.7 9.1 12. 9 15.8 0.16
Ar 22.2 8.60 8.51 12.1 0.66
Ro 24.1 9.49 11.4 14.9 0.39
2.4. Data analysis
2.4.1. Correlation analysis. Spearman test revealed a strong relationship between polyphenol content and the antioxidant capacities measured, showing that for both coffees and substitutes antioxidant capacity is basically determined by the polyphenolic compounds present.
Antioxidant characteristics correlate strongly with coffee odour and coffee fl avour, while transparency correlates negatively with all antioxidant values. Hue is strongly linked to antioxidant potential, while brightness is inversely related to it. Brightness is also related to transparency for all samples and negatively correlated to hue, coffee fl avour, and sourness.
Sensory attributes were also proven to show signifi cant relationships, e.g. burnt fl avour is strongly linked to taste character, aftertaste, bitter and sour tastes. The fact that bitter and sour tastes and burnt fl avour are interlinked refl ects the impact of Maillard reaction products on fi nal aroma not only in case of coffees (as previously described, e.g. BELITZ et al., 2009), but also for substitutes from various botanical sources. On the other hand, statistical evaluation proved the dependence between TPC and bitter taste, raising the possibility of contribution of bitter polyphenols (GONZALO-DIAGO et al., 2014) to the bitter taste of these products.
Among other compounds, melanoidins were also identifi ed as major contributors to bitter taste (SUNARHARUM et al., 2014). Similarly, the bitter taste of coffee substitutes is not easily assigned to specifi c compounds. In case of raw chicory, bitter notes are attributed mainly to sesquiterpene lactones, which are almost completely degraded during roasting (LECLERCQ, 1992), thus, the high polyphenol content of roasted chicory may contribute to the bitterness of chicory coffee substitute. For both chicory and cereal substitutes, melanoidines (resulting partly from polyphenols) will contribute to bitter notes in the fi nal taste profi le (CARVALHO et al., 2014).
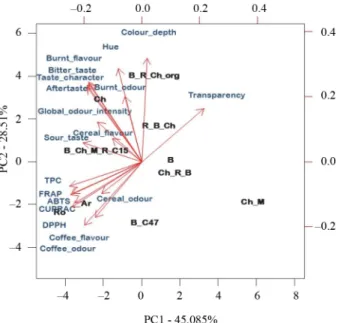
Fig. 3. Biplots of the results of principal component analysis based on antioxidant and sensory properties (PC1–PC2)
304
2.4.2. Principal component analysis. Principal component analysis (PCA) was performed in order to check for possible differentiation pattern between samples, based on their sensory and antioxidant attributes (Fig. 3). According to principal components PC1 and PC2, covering 73.60% of total variance, coffees are distinguished by the rest of the samples in terms of coffee notes, cereal odour, and antioxidant capacity. Although there are some specifi c sensory notes related to some of the substitutes (e.g. preponderance of burnt, bitter notes for chicory, apparently missing at the chicory-malt product, situated in the opposite quadrant), coffee substitutes apparently do not show composition-related features in their sensory properties. PC1 did not explain the differences between chicory- and coffee- containing samples (variables responsible for PC1: polyphenols, antioxidant capacity, burnt, bitter and sour notes, aftertaste), however, this variance is well explained by PC2 (variables responsible for PC2: coffee fl avour, coffee odour, hue, colour depth, transparency). Cereal- containing substitutes are not differentiated based on PC1 and PC2.
3. Conclusions
Very high polyphenol contents and antioxidant capacities were detected in coffees, coffee blends, and chicory. Half of the coffee substitutes analysed were found to show statistically insignifi cant differences compared to pure coffees in terms of antioxidant potential.
PCA revealed distinct sample patterns for coffees and substitutes. Correlations between antioxidant properties and polyphenol content, as well as sensory, chromametric, and antioxidant properties were disclosed. It was shown that coffee-like notes are directly linked to antioxidant capacity, while transparency and brightness are negatively correlated to the latter. Burnt, sour, and bitter notes are strongly interlinked, this underlining the importance of Maillard reaction products in the formation of fi nal fl avour notes in case of both coffees and their substitutes.
The positive nutritional properties of coffee substitutes highlighted in this paper, i.e.
high antioxidant capacity, especially for chicory-based preparations, together with absence of caffeine can qualify these products as valuable sources of cheap and healthy coffee alternatives, contributing to dietary antioxidant intake of possible target groups like children, pregnant and breastfeeding women, as well as elderly people.
*
Zs. Bodor was supported by the Doctoral School of Food Science (SZIU).
References
APAK, R., GÜÇLÜ, K., DEMIRATA, B., OZYÜREK, M., CELIK, S.E., … & OZYURT, D. (2007): Comparative evaluation of various total antioxidant capacity assays applied to phenolic compounds with the CUPRAC assay. Molecules, 12(7), 1496–1547.
BAEZA, G., SARRIÁ, B., BRAVO, L. & MATEOS, R. (2017): Polyphenol content, in vitro bioaccessibility and antioxidant capacity of widely consumed beverages. J. Sci. Food Agr., 98(4), 1397–1406.
BELITZ, H.D., GROSCH, W. & SCHIEBERLE, P. (2009): Food chemistry. 4th ed., Springer-Verlag Berlin Heidelberg, pp.
949–950.
BENZIE, I.F. & STRAIN, J.J. (1996): The ferric reducing ability of plasma (FRAP) as a measure of “antioxidant power”:
the FRAP assay. Anal. Biochem., 239(1), 70–76.
BONDIA-PONS, I., AURA, A.M., VUORELA, S., KOLEHMAINEN, M., MYKKÄNEN, H. & POUTANEN, K. (2009): Rye phenolics in nutrition and health. J. Cereal Sci., 49(3), 323–336.
BRAND-WILLIAMS, W., CUVELIER, M.E. & BERSET, C. (1995): Use of a free radical method to evaluate antioxidant activity. LWT – Food Sci. Technol., 28, 25–30.
CARVALHO, D.O., CORREIA, E., LOPES, L. & GUIDO, L.F. (2014): Further insights into the role of melanoidins on the antioxidant potential of barley malt. Food Chem., 160, 127–133.
CONTRERAS-CALDERÓN, J., MEJÍA-DÍAZ, D., MARTÍNEZ-CASTAÑO, M., BEDOYA-RAMÍREZ, D., LÓPEZ-ROJAS, N., … &
VEGA-CASTRO, O. (2016): Evaluation of antioxidant capacity in coffees marketed in Colombia: Relationship with the extent of non-enzymatic browning. Food Chem., 209, 162–170.
ECHAVARRÍA, A.P., PAGÁN, J. & IBARZ, A. (2013): Antioxidant activity of the melanoidin fractions formed from D-glucose and D-fructose with L-asparagine in the Maillard reaction. Scientia Agropecuaria, 4, 45–54.
GERE, A., KOVÁCS, S., PÁSZTOR-HUSZÁR, K., KÓKAI, Z. & SIPOS, L. (2014): Comparison of preference mapping methods: A case study of fl avoured kefi rs. J. Chemometr., 28(4), 293–300.
GERE, A., SIPOS, L. & HÉBERGER, K. (2015A): Generalized pairwise correlation and method comparison: Impact assessment for JAR attributes on overall liking. Food Qual. Prefer., 43, 88–96.
GERE, A., SIPOS, L., LOSÓ, V., GYÖREY, A., KOVÁCS, S.,… & KÓKAI, Z. (2015B): Applying parallel factor analysis and Tucker-3 methods on sensory and instrumental data to establish preference maps: Case study on sweet corn varieties. J. Sci. Food Agr., 94(15), 3213–3225.
GONZALO-DIAGO, A., DIZY, M. & FERNÁNDEZ-ZURBANO, P. (2014): Contribution of low molecular weight phenols to bitter taste and mouthfeel properties in red wines. Food Chem., 154, 187–198.
GORJANOVIĆ, S., KOMES, D., LALIČIĆ-PETRONIJEVIČ, J., PASTOR, F.T., BELŠČAK-CVITANOVIĆ, A., … & SUŽNJEVIC, D.L.
(2017): Antioxidant effi ciency of polyphenols from coffee and coffee substitutes – electrochemical versus spectrophotometric approach. J. Food Sci. Tech., 54, 2324–2331.
HEIMLER, D., ISOLANI, L., VIGNOLINI, P. & ROMANI, A. (2009): Polyphenol content and antiradical activity of Cichorium intybus L. from biodynamic and conventional farming. Food Chem., 114(3), 765–770.
KÓKAI, Z., HESZBERGER, J., KOLLÁR-HUNEK, K. & KOLLÁR, G. (2002): A new VBA software as a tool of food sensory tests. Hung. J. Ind. Chem. (HJIC), 30, 235–239.
KOMES, D., BUŠIĆ, A., VOJVODIĆ, A., BELŠČAK-CVITANOVIĆ, A. & HRUŠKAR, M. (2015): Antioxidative potential of different coffee substitute brews affected by milk addition. Eur. Food Res. Technol., 241, 115–125.
LECLERCQ, E (1992): Sesquiterpene lactones and inulin from chicory roots: Extraction, identifi cation, enzymatic release and sensory analysis. PhD. thesis, Landbouwuniversiteit te Wageningen.
LOSÓ, V., GERE, A., GYÖREY, A., KÓKAI, Z. & SIPOS, L. (2012): Comparison of the performance of a trained and an untrained sensory panel on sweetcorn varieties with the PanelCheck software. Applied Studies in Agribusiness and Commerce – APSTRACT, 1–2, 77–83.
MAJCHER, M.A., KLENSPORF-PAWLIK, D., DZIADAS, M. & JELEŃ , H.H. (2013): Identifi cation of aroma active compounds of cereal coffee brew and its roasted ingredients. .J. Agr. Food Chem., 61, 2648–2654.
RE, R., PELLEGRINI, N., PROTEGGENTE, A., PANNALA, A., YANG, M. & RICE-EVANS, C. (1999): Antioxidant activity applying an improved ABTS radical cation decolourization assay. Free Radical Bio. Med., 26(9/10), 1231–
1237.
SAHAN, Y., GURBUZ, O., GULDAS, M., DEGIRMENCIOGLU, N. & BEGENIRBAS, A. (2017): Phenolics, antioxidant capacity and bioaccessibility of chicory varieties (Cichorium spp.) grown in Turkey. Food Chem., 217, 483–489.
SINGLETON, V.L. & ROSSI, J. A. JR. (1965): Colourimetry of total phenolics with phosphomolybdic-phosphotungstic acid reagents. Am. J. Enol. Viticult., 16, 144–158.
SIPOS, L., KOVÁCS, Z., SÁGI-KISS, V., CSIKI, T., KÓKAI, Z., … & HÉBERGER, K. (2012): Discrimination of mineral waters by electronic tongue, sensory evaluation and chemical analysis. Food Chem., 135, 2947–2953.
SUNARHARUM, W.B., WILLIAMS, D.J. & SMYTH, H.E. (2014): Complexity of coffee fl avour: A compositional and sensory perspective. Food Res. Int., 62, 315–325.
SZŐKE, A., LOSÓ, V., SIPOS, L., GEÖSEL, A., GERE, A. & KÓKAI, Z. (2012): The effect of brand/type/variety knowledge on the sensory perception. Acta Alimentaria, 41(Suppl. 1), 197–204.
VÁRVÖLGYI, E., GERE, A., SZÖLLŐSI, D., SIPOS, L., KOVÁCS, Z., … & KORÁNY, K. (2015): Application of sensory assessment, electronic tongue and GC-MS to characterize coffee samples. Arab. J. Sci. Eng., 40(1), 125–133.
Open Acces statement. This is an open-access article distributed under the terms of the Creative Commons Attribu- tion 4.0 International License (https://creativecommons.org/licenses/by/4.0/), which permits unrestricted use, distri- bution, and reproduction in any medium, provided the original author and source are credited, a link to the CC Li- cense is provided, and changes – if any – are indicated. (SID_1)