JOURNAL OF CENTRAL EUROPEAN GREEN INNOVATION HU ISSN 2064-3004
Available online at http://greeneconomy.uni-eszterhazy.hu/
A VÁROSI ZÖLD INFRASTRUKTÚRA VIZSGÁLATA A KLÍMAVÁLTOZÁSSAL SZEMBENI ADAPTÁCIÓBAN /
ADAPTATION TO CLIMATE CHANGE WITH GREEN INFRASTRUCTURE IN URBAN ENVIRONMENT
HOYK EDIT1 / EDIT HOYK1 E-MAIL: HOYK.EDIT@KRTK.MTA.HU (LEVELEZŐ SZERZŐ/CORRESPONDING AUTHOR)
Összefoglalás
A klímaváltozás negatív hatásaival szembeni adaptáció városi környezetben elsősorban a túlzott felmelegedés elleni védekezésre, ill. a városi hősziget-hatás mérséklésére fóku- szál. Ebben a folyamatban a zöld infrastruktúrának kitüntetett szerepe van, és kell, hogy legyen a jövőben is.
Jelen tanulmányban egy magyarországi középváros, Kecskemét példáján mutatjuk be a városon belüli mikroklimatikus eltéréseket, amelyek utalnak a városi hősziget kialaku- lására. Mennyiségi és minőségi szempontból elemezzük a belváros zöldfelületeit, ame- lyek szerepet játszhatnak a hősziget-hatás csökkentésében, valamint kitérünk a túlme- legedéssel szembeni egyéb adaptációs lehetőségekre, mint pl. zöld falak és homlokzatok, zöld tetők, reflektív tetők és járdák, stb.
Következtetésként javaslatokat fogalmazunk meg az egyes, zöld infrastruktúrához kö- tődő adaptációs eszközök alkalmazási lehetőségeivel kapcsolatban, amelyek egy konti- nentális klímájú, közép-kelet európai középváros esetében hatékonyan szolgálhatják a klímaváltozás negatív hatásainak mérséklését.
Kulcsszavak: klímaváltozás, adaptáció, zöld infrastruktúra, városi hősziget JEL kód: Q20
Abstract
The attempts to reduce the negative effects of climate change in urban environment fo- cus on overheating protection and decrease of urban heat island (UHI) effect primarily.
Green infrastructure has a prominent role in this adaptation process and this should be in the future.
In this study, we present the microclimatic differences within a medium sized Hun- garian city (the study area was Kecskemét), which refer to the urban heat island phe- nomenon. We made a qualitative and a quantitative analyses about green surfaces in the downtown, which have an important role in urban heat island effect reduction. In addition, we deal with other adaptation possibilities against daytime overheating, such as green facades, green roofs, reflective roofs and pavements etc.
As a conclusion, we make suggestions about green infrastructure as an adaptation tool.
These possibilities can effectively serve to mitigate the negative effects of climate change in a medium sized, continental climate city in Central and Eastern Europe.
Keywords: climate change, adaptation, green infrastructure, Urban Heat Island (UHI)
Bevezetés / Introduction
It was already observed 200 years ago in a study about the urban climate of Lon- don (Howard, 1818) that the air temperature of urban areas is can be significantly higher – especially at night – compared to the rural areas. This microclimatic phe- nomenon is called urban heat island (UHI), and in the last 50 years its occurrence is widespreadly recognised (Landsberg, 1981). Because of climate change and the necessity of urban adaptation, temperature differences of the urban areas have been in the focus of interest in the last 10-15 years.
Preceding findings revealed that the UHI effect and its intra-urban variability are observable throughout the whole year, but the highest values can be measured in summer in temperate climate zone (Gál et al., 2016). Measures from different parts of the world identified that UHI is influenced by many factors (climate, me- teorological conditions, air pollution, architecture, vegetation, surface properties etc.). It is important to distinguish urban heat island (which refers to the air tem- perature) and surface urban heat island (SUHI) which shows the difference in tem- perature between the different surfaces. According to Gémes et al. (2016), surface urban heat island is the most observable at midday and early afternoon, however urban heat islands based on the measured air temperature differences are the most pronounced at night. There is a relatively strong negative correlation (R=-0.69) between the vegetation indices and the changes in the surface temperature values (Gémes et al., 2016). It shows that vegetation seems to be a major determining factor of land surface temperature (LST) changes.
After water bodies, surfaces covered by vegetation are the second most effective surface types in mitigating the UHI effect. The importance of vegetation is un- derlined by many researches. „A multilevel tree stand with a closed canopy layer, consisting of well evaporating tree species with a sufficient water supply can reduce the temperature even by approximately 5-6 °C” (Oláh, 2012). Tan (2016) and his colleagues found that enhancing the cooling efficiency of urban greenery is essen- tial for improving the microclimate in high-density cities. On the basis of their observed data and simulation results indicated that the cooling effect of urban trees is highly associated with sky view factor (SVF), which shows the importance of the canopy density. Beside this, tree planting in conjunction with proper planning (e.g. wind path) is an effective measure to mitigate daytime overheating.
Many measurements show the differences between green spaces and vegeta- tion-free areas. In London, greenspace can reduce the UHI effect by 31% (Doick et al. 2014). Others found a strong correlation between topography, land-use and UHI intensity (Ketterer - Matzarakis, 2014). According to Tsilini et al. (2015) urban gardens decreased the surface temperature by 10 °C compared to areas with
no vegetation. The evaluation of cooling effects of gardens, street trees, green roofs etc. could also help understanding how green infrastructure can be integrated into urban environments (Feyisa et al., 2014).
Urban green infrastructure consists of different elements, e.g. parks, alleys, green facades etc. In an urban environment the space-saving solutions (green roofs, green walls) have a great importance. These solutions are comparable with other – usual- ly architectural – adaptation possibilities, such as reflective roofs, cool pavements.
The utility of these methods depend on the building characteristics and the cli- matic conditions. Santamouris (2014) calculated that when vegetative roofs were installed in medium and high rise buildings, their potential to decrease ambient temperature at street level is almost negligible. Green roofs may be effective when the building height is lower than 10 m. Reflective roofs seem to present a higher mitigation potential than green roofs when installed in high rise buildings. In addition to their cooling effect, green roofs can also contribute to heat insulation.
Many research show that in terms of minimizing energy consumption, green roofs are preferable in heating-dominated cities (severe cold and cold zones), while cool and green roofs perform similarly in cooling-dominated areas (hot summer and cold winter and hot summer and warm winter zones) (Zeng et al., 2017). Besides this, the key function of green roofs is to capture and retain rainfall on the roof and they are often implemented to help managing urban stormwater (Coutts et al., 2013). Several investigation (Vijayaraghavan, 2016; Santamoutis, 2014; Zeng et al., 2017) show that each country with different climatic conditions and building characteristics has to do local research to identify components for the successful establishment of green roofs.
Similarly to green roofs, the effects of green walls are also worth to be examined together with their surroundings. Measurement results underline the positive ef- fect of green walls in summer and show moderate reduction of heat losses in winter (Djedjig et al., 2017). Other results reveal that an average of 2.5 °C reduction in internal wall temperature can be achieved via green walls with about 10 cm thick climbing vegetation (e.g. Hedera helix), which is very promising (Cuce, 2017).
According to this, the application of green walls is useful under hot summer con- ditions, as the results emphasize the highly positive effect of green walls in sum- mer. In addition, when a green system is installed in an existing building with low insulation level, the energy performance of the building becomes similar to a new building with high insulation level (Olivieri et al., 2017). Besides efficient thermal regulation, green wall systems have some additional benefits such as improving air quality, saving energy, reducing noise and mitigating greenhouse gas emission.
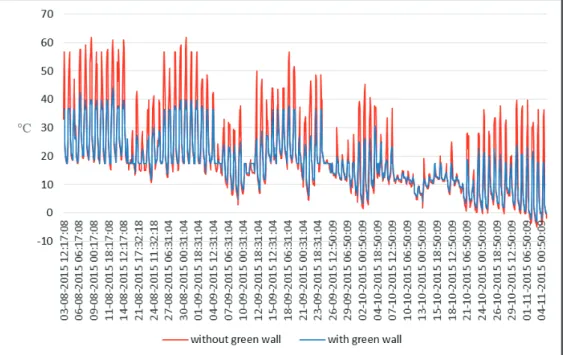
In our former research we measured the temperature in order to monitor the impact of green walls on the buildings (Hoyk - Kovács, 2017). This measurement
was done in Clarion Hungary Ltd., Nagykáta. The difference in air temperature between a wall without shadow and a shaded wall was significant. Temperature in front of the wall without shadow was more than 60 °C in many times in August, meanwhile maximume temperature in front of the wall with shadow (green wall) was about 40 °C (Fig. 1.).
1. ábra: Épületen kívüli léghőmérséklet zöld fal nélkül és zöld fallal (°C) / Figure 1.
Outside air temperature in front of the building with and without green wall (°C) Forrás: saját szerkesztés / Source: Own construction based on own measurements Our results show that in the case of greenwalled buildings the difference in tem- perature between walls with and without shadow can reach 20 °C. It means that, green areas can play a decisive role in the reduction of negative effects of climate change.
In this paper we continue the investigations with urban cross-section tempera- ture measurements and a vegetation survey. Our aim with this examination is to prove the existence of the UHI phenomenon in Kecskemét, and to draw attention for the importance of the green infrastructure with showing the condition of the vegetation.
Anyag és módszer / Material and methods
In our research, we measured the urban climate in a medium-sized Hungarian city, Kecskemét. Additionally, because of green surfaces can play a significant role to reduce urban heat island effect, we made qualitative and quantitative survey about the green areas of Kecskemét downtown.
Anyag / Material
Kecskemét is the 8th largest city in the country, and the county seat of Bács-Ki- skun. The town had 110813 residents in 2017 (KSH). Unlike national trends, the population was growing slightly before 2015, but after this it is falling by 0,3%
per year. Kecskemét is in the center of the Danube-Tisza Interfluve, most of which is called „Homokhátság” (sand ridges). Homokhátság region is affected by aridifi- cation which is one of the most serious environmental problems of the Carpath- ian Basin. Its climate is warm, semi-dry continental with frequent droughts and heat waves. The average precipitation is 500-550 mm/year, with extreme variations (varying between 330-1000 mm/year).
Built-up area of Kecskemét is diverse, with dense built-in downtown covered by water-impermeable pavements, densely built housing estates, industrial zones and suburban areas with family houses. Because of this diversity the city is suitable for cross-section instrument measurements. The population of the town is over 100000 inhabitants, a rough treshold for the appearance of pronounced UHI. The detection of urban heat island is based on especially on remote sensing methods nowadays, but this must be supplemented by instrument measurements. In our in- vestigation we did not have enough measurement points for accurate information about the UHI, but we have measured data from different areas of the town. With these data we can at least prove the existence of this phenomenon.
Módszer / Methods
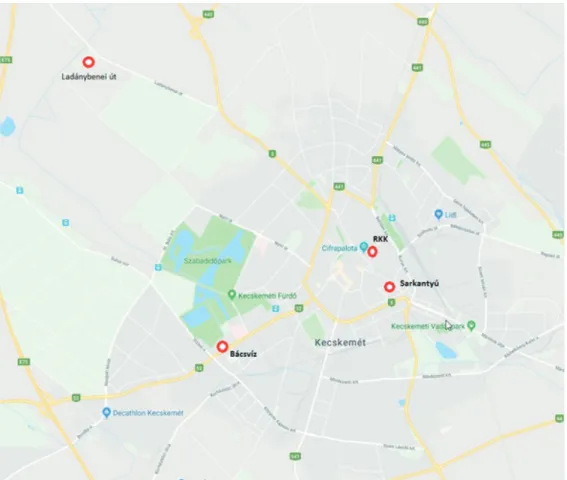
In our research, we measured the urban climate with four Netatmo NRG01- WW weather stations in Kecskemét, which give us an image about the climatic cross-section of the town. In this paper we show the results of the analyses between 10 August 2017 – 10 March 2018. The four measurement points represent four different built-up areas. First point is in the very middle of the downtown (station name is RKK) which is a densely built-in area with multi-storeyed downtown houses. Second point can be found at the edge of the downtown, approximately 1 km from the first point (station name is Sarkantyú) which area is dominated with
detached houses. The third measurement point is in a transition zone between the downtown and the edge of the city. It is a kind of industrial zone with shopping centers and buildings of larger companies. This is a lower density built-in area, station name is Bácsvíz. Fourth point is in the edge of the city which is a sparsely built-up area with dense vegetation (station name is Ladánybenei út) (Fig. 2.).
2. ábra: Meteorológiai mérőpontok elhelyezkedése Kecskeméten / Figure 2. Meteo- rological measurement points in Kecskemét
Forrás: Google maps alapján saját szerkesztés / Source: Own construction based on Google maps
Three stations started the measurements in early August 2017, but in case of the fourth station (Ladánybenei út) data was only available from the end of October.
Because of this, we do not have data from the edge of the town about a warmer period, but together with this shortage, we can show the differences between the city centre and a further point of the town. Measured parameters were the follow- ing: temperature, precipitation, humidity and wind-force. For examining the UHI
effect the temperature is the most important factor; in terms of the green infra- structure, precipitation is also a key element. Because of these, in this paper we are dealing with the temperature and the precipitation data.
Because green surfaces can play a significant role to reduce UHI effect, we made qualitative and quantitative surveys about the green areas of Kecskemét down- town. In the quantitative analysis we focused on the city centre and the surround- ing area so that we could make estimation about extension of the green spaces. The size of the investigated area is about 5,8 km2, from which 3 km2 is the downtown, 2,8 km2 is a mixed area between the city centre and other parts of the town. We used Google Street View to get information about the extent of the fields covered by vegetation. From the point of view of the heat island, densely built city centres are the most exposed to the negative effects. Green areas in the downtown can play a significant role in the adaptation process, therefore we focused on the middle of the downtown. It means the main street (Rákóczi Street) and the main square which is about 0,1 km2. We counted the trees and classified the species.
Viability of the trees and alleys are very important in green field’s planning.
Nowadays visual methods are available for assessing viability, such as crown form, canopy size, injury of tree trunks and tree branches, traces of diseases etc. EU method for health status classification is based on this assessment. We used a sim- plified version of EU method in the qualitative analysis. The original classification consists of five classes for assessing viability: life expectancy is the slaughter matu- rity (very good health condition); life expectancy is approaching the slaughter ma- turity (good condition); life expectancy is about 10 years (average condition); soon will be replaced (weak health condition); to be placed urgently (bad condition) (Radó, 1999). We used three classes for the classification: good (1. class), medium (2. class) and bad (3. class) health condition. The result of the classification has shown in the Table 1.
Eredmények / Results
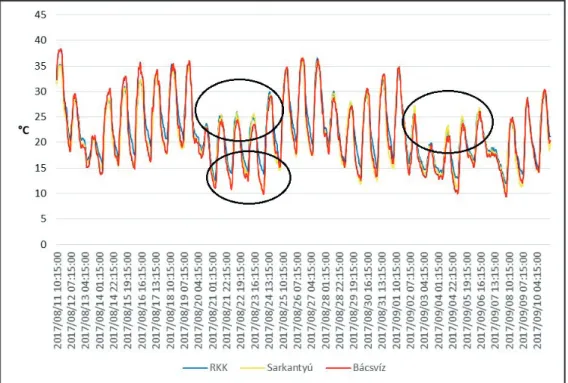
In order to analyse the differences in the temperature values, we choose a warmer (10. August – 10. September) and a cooler (1-31. December) period. In August and in September unfortunately we had only three stations, but according to these data we can see the main characteristics of the air temperature in the city cross-sec- tion (Fig. 3.).
3. ábra: Három állomás léghőmérsékleti adatai Kecskeméten (2017. augusztus 10. – szeptember 10.) / Figure 3. Air temperature data of three stations
in Kecskemét (10. August – 10. September)
Forrás: saját szerkesztés / Source: Own construction based on own measurements As we can see on the Fig. 3., when the maximume temperatures were above 30
°C, two points (in the downtown and close to the city centre) had lower values than further from the city centre. At lower maximum temperatures (ca. 20-25 °C) the downtown is warmer. In minimum temperatures, the measurement point further from the downtown (Bácsvíz) is cooler almost every cases; the daily temperature fluctuation is the highest at this station. This point is more vulnerable to the direct solar radiation in all day than the other points which are located in more densely built-up areas. Presumably this is the reason of the higher values when the maxi- mume temperature is above 30 °C. According to the minimume temperatures, we can see 2-3 °C difference between the downtown and Bácsvíz station; daily mini- mum temperature values are higher in the city centre. It shows the warmer nights in the downtown, which is typical for the urban heat island.
Differences in temperature values were higher in December, especially at the edge of the town (Fig. 4.)
4. ábra: Négy állomás léghőmérsékleti adatai Kecskeméten (2017. december 1-31.) / Figure 4. Air temperature data of four stations in Kecskemét
(1-31. December)
Forrás: saját szerkesztés / Source: Own construction based on own measurements The coldest days are the most characteristic, when the differences clearly show temperature decrease towards the outer parts of the town. The city centre is about 5 °C warmer than the edge of the town, while the transition zones are between the two extremes. On milder days the difference is not significant (about 1 °C), but the temperatures are the lowest at the edge of the city. In winter period the vegetation has not role. The results suggest plus heat from heating and transport in central part of the city. Differences in temperature manifested mainly in night cooling between the city districts. We measured 1,5-2 °C differences between the densely built downtown measure point and the loosely built downtown edge or the intermediate measure point, with higher night temperatures in the downtown.
The precipitation is extraordinarily variable in Hungary. It is true especially in case of the Great Plain, where Kecskemét is located. We can see this characteristic based on the average of four months. Figure 5. shows that there are only 10% of the days with precipitation above 5 mm per day between late autumn and early spring. But there were two days, when the precipitation was more than 25 mm within 24 hours (in winter time). This is an average amount for a month in winter.
5. ábra: Négy állomáson mért csapadékmennyiség Kecskeméten (2017. november 10.-2018. március 10.) / Figure 5. Precipitation of four stations
in Kecskemét (10. November 2017.-10. March 2018.)
Forrás: saját szerkesztés / Source: Own construction based on own measurements We can see the differences not only between days, but also between measure- ments points. Differences can reach 15 mm/day which is higher in summer period.
From July to early August in 2017 we had data only of two meteorological sta- tions, but we could find the biggest differences in this period. On 6th of August the precipitation in the middle of the town was more than 60 mm, (station RKK) and more than 90 mm only one km further (station Sarkanytú). These amounts mean an average quantity for a summer month and the difference is about 30 mm between the two measurement points which is significant. On other days the dif- ferences reached 5-10 mm (Fig. 6.).
These differences in the precipitation make it difficult to meet the water needs of urban vegetation. There are many days with water shortage (especially in sum- mer), on other days the precipitation is too much, and the water disappears from the system instead of filtrating into the soil; mainly because of the covered surfaces.
This situation – together with other city characteristics – reduces the possibilities of green space maintenance and increases the importance of species selection and treatment. We examined the urban green surfaces with these considerations.
6. ábra: Legnagyobb mért csapadék-eltérések (2017. július 1.-2018. február 28.) / Figure 6. Biggest differences in precipitation
(1. July 2017.-28. February 2018.)
Forrás: saját szerkesztés / Source: Own construction based on own measurements Green infrastructure is a network of the different green elements (parks, groves, alleys, green roofs, green facades etc.) in towns (Norton et al., 2015). This network is a key factor in the adaptation process and means a functional green area. The functions are the following:
- vegetation can give shadow and it can decrease urban heat island effect, - green areas improve urban air quality through dust deposition and CO2
sequestration,
- green spaces facilitate infiltration and water retention.
Beside the positive effects there are also some challenges. Vegetation is a living system with climatic, nutrient, water demands. Satisfying these needs must be part of the urban operations which requires time and financial resources. Secondly, cities usually do not have enough space for new green areas; moreover, there is a continuous struggle to preserve green spaces. Because of the area-shortage, the application of green roofs, green facades can be an adequate answer to expand green surfaces. These solutions must be part of the planned Green Infrasturcture Development Plan in Kecskemét.
As it was mentioned above, we investigated almost 6 km2 from the city. Green area of the downtown is about 0,6 km2 which means ca. 20% of the area. This is an average value among cities. It is important to consider that the size of the co- herent green spaces has a major role in UHI effect reduction. In the downtown of Kecskemét the biggest coherent green area is about 0,05 km2 (5 ha). An area of this size can still have an impact on the urban microclimate, but other green areas in the downtown are too small to have a considerable impact. To reduce UHI effect the best way would be increase green areas [based on an australian measurement, a 10% increase in vegetation cover could reduce daytime urban surface temperatures by approximately 1 °C (Coutts - Harris, 2013)], but this method is usually difficult in the downtowns. Because of this, in case of the vegetation of the downtown, em- phasis should be placed for shielding and decreasing of the daytime overheating.
To achieve this, we need healthy canopy with high density. Therefore we made a health status survey in the heart of the downtown (it means the main street and the main square).
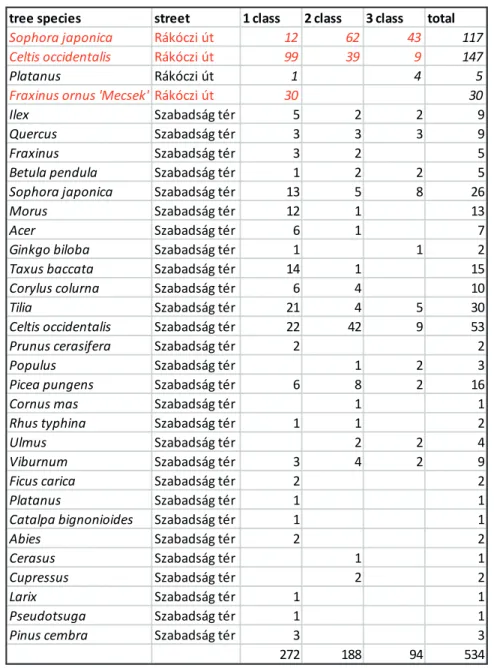
We have focused on the woody scpecies, because of the shading ability. We counted all together 534 trees in the surveyed area. Identification of the species was followed by health status classification (see chapter Methods). We found that 272 trees are in good health condition (1. class), 188 trees are in medium health con- dition (2. class) and 94 trees are in bad condition (3. class). It means, about 50%
of the trees are in medium or bad condition, which is not an appropriate result for the future of the trees (Table 1.).
tree species street 1 class 2 class 3 class total
Sophora japonica Rákóczi út 12 62 43 117
Celtis occidentalis Rákóczi út 99 39 9 147
Platanus Rákóczi út 1 4 5
Fraxinus ornus 'Mecsek'Rákóczi út 30 30
Ilex Szabadság tér 5 2 2 9
Quercus Szabadság tér 3 3 3 9
Fraxinus Szabadság tér 3 2 5
Betula pendula Szabadság tér 1 2 2 5
Sophora japonica Szabadság tér 13 5 8 26
Morus Szabadság tér 12 1 13
Acer Szabadság tér 6 1 7
Ginkgo biloba Szabadság tér 1 1 2
Taxus baccata Szabadság tér 14 1 15
Corylus colurna Szabadság tér 6 4 10
Tilia Szabadság tér 21 4 5 30
Celtis occidentalis Szabadság tér 22 42 9 53
Prunus cerasifera Szabadság tér 2 2
Populus Szabadság tér 1 2 3
Picea pungens Szabadság tér 6 8 2 16
Cornus mas Szabadság tér 1 1
Rhus typhina Szabadság tér 1 1 2
Ulmus Szabadság tér 2 2 4
Viburnum Szabadság tér 3 4 2 9
Ficus carica Szabadság tér 2 2
Platanus Szabadság tér 1 1
Catalpa bignonioides Szabadság tér 1 1
Abies Szabadság tér 2 2
Cerasus Szabadság tér 1 1
Cupressus Szabadság tér 2 2
Larix Szabadság tér 1 1
Pseudotsuga Szabadság tér 1 1
Pinus cembra Szabadság tér 3 3
272 188 94 534
1. táblázat: A vizsgált fák egészségügyi osztályokba sorolásának eredménye (piros: leggyakoribb fajok)/ Table 1. Results of the health status classification on
examined trees (red: most common species)
Forrás: saját szerkesztés / Source: Own construction based on own measurements There are significant differences between the health conditions of the species.
As we can see in the Table 1., the most common species are: Sophora japonica, Celtis occidentalis and Fraxinus ornus. 36% of Sophora japonica trees are in the
third class, while 60% of Celtis occidentalis trees are in the first class. In addition, 100% of Fraxinus ornus trees are in the first health class. It means that, a signifi- cant part of the woody vegetation surveyed by the city centre is in poor condition.
This indicates that bigger part of the trees can reach upper limit of their lifespan within 10-15 years. In addition, our results show which tree species tolerate better the urban environment and on the basis of it they can play a better role in green infrastructure.
As we mentioned before, the vegetation has only a limited ability for a measur- able impact to its surroundings. The cooling effect of the parks is closely related to their size. According to the international literature, median values of cooling effects beyond park boundaries are between 85 m and 284 m (Lin et al., 2015).
Lee et al. (2009) reported that the cooling effect of a park (diameter ca. 500 m) in the CBD of Seoul can reach only 240 m. At the same time, temperatures within a greenspace are as much as 8 °C cooler than the surrounding urban area (Oke, 1987). It points out that the air temperature-reducing effect decreases rapidly from the park boundary.
On the example of Kecskemét – which does not have green spaces of a signifi- cant size in the city centre –, the emphasis should be placed on the direct effects of the vegetation. This also means that shading should be used, as a good adaptation method, with trees or other possibilities (e.g. green facades). The examination of shading ability follows this finding. Based on the list of species (Table 1.), we can conclude that the canopy density and the shading ability varying on a wide scale.
Among the most common species in Kecskemét downtown we can equally find tree species with big, and with small shielding (Fig. 7. 8.).
7. ábra: Nagy árnyékoló képességű fafajok (japán akác, nyugati ostorfa, hárs) / Figure 7. Tree species with big shading ability (Sophora japonica,
Celtis occidentalis, Tilia sp.)
Forrás: https://hu.wikipedia.org / Source: https://hu.wikipedia.org
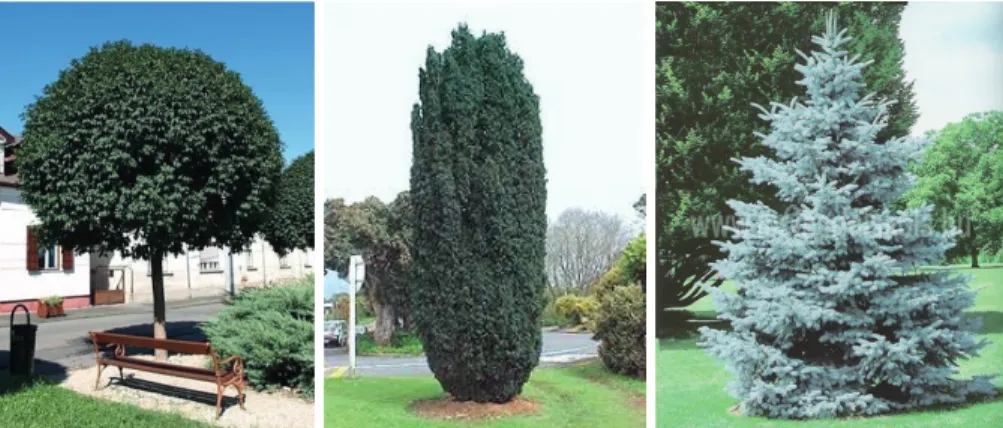
8. ábra: Kis árnyékoló képességű fafajok (gömbkőris, tiszafa, ezüstfenyő) / Figure 8. Tree species with small shading ability (Fraxinus ornus ’Mecsek’,
Taxus baccata, Picea pungens)
Forrás: https://hu.wikipedia.org / Source: https://hu.wikipedia.org
If we compare the health status classification with the shading ability, we can see that some species which does not tolerate the urban environment too well have big shading ability (e.g. Sophora japonica). Other species are in a better health con- dition with big shading ability (e.g. Celtis occidentalis, Tilia sp.), while tree species with small shielding can tolerate better the polluted urban environment. We can conclude, that during the selection of urban tree species, wariness is needed and high-shaded, well-tolerant species should be chosen in the urban environment.
Következtetések / Conclusions
Our temperature measurements indicate the presence of the urban heat island phenomenon in Kecskemét. These data concern the air temperature, and show ca.
2-3 °C differences in average – in some cases 5 °C – between the city centre and the edge of the town. The differences in surface temperatures (for example between asphalt pavement and parks) are bigger, and we need measurements about surface urban heat island effect in the future.
The differences in precipitation between different points of the city reflect the unpredictable rainfall patterns. For example, we detected a deviation of up to 30%
in the rainfall within a distance of 1 km. It confirms the necessity and urgency of urban rainfall management. This management is missing from Kecskemét current- ly, which has some negative consequences. The lack of a significant infiltration of the precipitation and difficulties with the rainwater runoff may cause flash floods after heavy storms (Fig. 9.). This situation probably will be more frequent in the future.
9. ábra: Villámárvíz Kecskeméten heves esőzés után / Figure 9. Flash flood in Kecskemét after a heavy rainfall
Forrás: http://nadahun.blogspot.hu/2009/05/arviz-vihar-jegeso-kecskemet.html / Source:
http://nadahun.blogspot.hu/2009/05/arviz-vihar-jegeso-kecskemet.html
The problems from heavy rainfall and lack of the precipitation can be man- aged with the help of an adequate rainfall management, and it would be easier to maintain green territories also. For urban flood control, and to achieve shielding and decreasing of the daytime overheating, vegetation is a key element. In the interest of the adaptation, we need big extension of urban green areas and healthy canopy with high density. Another need is a proper and continuous maintenance of green areas. In our investigation we found that the extension of green spaces in Kecskemét is average, but significant part of the vegetation is in poor health con- dition. In order to improve this condition, Kecskemét needs a green infrastructure strategy including a trees replacement schedule and a thoughtful development plan about applicable green elements in the town.
Our examination outlined that great emphasis should be placed to increase the extent of urban green spaces for which different elements of green infrastructure (green walls, green roofs, etc.) should be used. The international researches present
the benefits of both horizontal and vertical greening (Cuce, 2017; Djedjig et al., 2017; Santamouris, 2014). In an earlier paper we have shown an analysis about the application possibilities for green facades in Kecskemét and an estimated po- tential in energy saving. In addition, we have done a calculation that green roofs and green facades can contribute to the carbon sequestration and oxygen emission improving the urban air quality (Hoyk et al., 2016).
Besides the use of green infrastructure elements other options are also available in the adaptation process. These possibilities are mainly architectural methods, e.g. cool roofs, reflective pavements. As we have mentioned before, the use of green roofs can be recommended in heating-dominated cities – such as Kecskemét – according to the international literature. This statement does not mean that reflective roofs and pavements are unnecessary under continental climate. Due to the increasing frequency of heat waves, especially in case of urban environment, reflective pavement application is recommended because it can significantly re- duce the surface temperature (resulting lower SUHI). Another important thing is to emphasize using water-permeable pavements. With the application of these materials the infiltration of precipitation would be much higher. It can contribute significantly to the water supply of the urban vegetation.
Possible solutions can be implemented in an inclusive social environment. City administration, urban operation organization and the population have to support it and to think green city is important as well as useful, instead of nice words and never implemented plans. It means that, adaptation process to the climate change is not only a technical or an economic problem, but also a social task.
Hivatkozott források / References
Coutts, A. M. - Daly, E. - Beringer, J. - Tapper, N. J. (2013): Assessing practical measures to reduce urban heat: Green and cool roofs. Building and Environ- ment 70. pp. 266-276.
Coutts, A. M. – Harris, R. (2013): A multi-scale assessment of urban heating in Melbourne during an extreme heat event and policy approaches for adaptation.
Victorian Centre for Climate Change and Adaptation Research, Melbourne.
Technical Report, pp. 64.
Cuce, E. (2017): Thermal regulation impact of green walls: An experimental and numerical investigation. Applied Energy 194. pp. 247–254.
Djedjig, R. - Belarbi, R. - Bozonnet, E. (2017): Experimental study of green walls impacts on buildings in summerand winter under an oceanic climate. Energy and Buildings 150. pp. 403-411.
Doick, K. J. - Peace, A. - Hutchings, T. R. (2014): The role of one large greenspace in mitigating London’s nocturnal urban heat island. Science of the Total En- vironment 493. pp. 662–671.
Feyisa, G. L. - Dons, K. – Meilby, H. (2014):Efficiency of parks in mitigating urban heat island effect: An example from Addis Ababa. Landscape and Urban Planning 123. pp. 87-95.
Gál, T. – Skarbit, N. – Unger, J. (2016): Urban heat island patterns and their dynamics based on an urban climate measurement network. Hungarian Geog- raphical Bulletin, 65 (2), pp. 105-116.
Gémes, O. - Tobak, Z. - Boudewijn van Leeuwen, B. (2016): Satellite based analy- sis of surface urban heat island intensity. Journal of Environmental Geography 9 (1–2), pp. 23–30.
Howard, L. (1818): The climate of London, deduced from Meteorological obser- vations, made at different places in the neighbourhood of the metropolis, 2 vol., London.
Hoyk E. - Kovács A. D. - Tompa M. (2016): Energia-megtakarítás és klímavéde- lem zöldfalak alkalmazásával. Gradus, 3:(1) pp. 245-251.
Hoyk, E. - Kovács, A. D. (2017): The role of climate strategies and green infra- structure in the adaptation to climate change. Columella: Journal of Agricul- tural and Environmental Sciences. 4:(1 (Suppl.)) pp. 131-136.
Ketterer, C. - Matzarakis, A. (2014): Human-biometeorological assessment of the urban heat island in a city with complex topography – The case of Stuttgart, Germany. Urban Climate. Volume 10, Part 3, pp. 573-584.
Landsberg, H. E. (1981): The urban climate. The Academic Press, London, New York, 196. p.
Lee, S-H. - Lee, K-S. - Jin, W-C. - Song, H-K. (2009): Effect of an urban park on air temperature differences in a central business district area. Landscape and Ecological Engineering, Volume 5:183, Issue 2, pp. 183–191. Letöltés dátuma:
2018. május 1, forrás: https://doi.org/10.1007/s11355-009-0067-6
Lin, W. - Yu, T. - Chang, X. - Wu, W. – Zhang, Y. (2015): Calculating cooling extents of green parks using remote sensing: Method and test. Landscape and Urban Planning 134. pp. 66–75.
Magyarország közigazgatási helynévkönyve. Központi Statisztikai Hivatal, Buda- pest, 2017. p. 22.
Norton, B. A - Coutts, A. M. - Livesley, S. J. - Harris, R. J. - Hunter, A. M. - Wil- liams, N. S. G. (2015): Planning for cooler cities: A framework to prioritise gre- en infrastructure to mitigate high temperatures in urban landscapes. Landscape and Urban Planning. Volume 134, pp. 127-138.
Oláh, A. B. (2012): The possibilities of decreasing the urban heat island. Appli- ed Ecology and Environmental research. 10(2). pp. 173-183. Letöltés dátu- ma: 2018. április 26. Forrás: http://epa.oszk.hu/02500/02583/00027/pdf/
EPA02583_applied_ecology_2012_02_173-183.pdf
Olivieri, F. - Cocci Grifoni, R. - Redondas, D. - Sánchez-Reséndiz, J. A. - Tascini, S. (2017): An experimental method to quantitatively analyse the effect ofther- mal insulation thickness on the summer performance of a verticalgreen wall.
Energy and Buildings 150. pp. 132-148.
Oke, T. R. (1987): Boundary layer climates, 435. p. Routledge, London
Radó D. (1999): Fasorok EU-módszer szerinti értékelése. Lélegzet 1999/7–8. p. 8.
Santamouris, M. (2014): Cooling the cities – A review of reflective and green roof mitigation technologies to fight heat island and improve comfort in urban en- vironments. Solar Energy 103. pp. 682–703.
Tan, Z. - Ka-Lun Lau, K. - Ng, E. (2016): Urban tree design approaches for mi- tigating daytime urban heat island effects in a high-density urban environment.
Energy and Buildings. Volume 114, pp. 265-274.
Tsilini, V. - Papantoniou, S. - Kolokotsa, D. D. - Maria, E. A. (2015): Urban gar- dens as a solution to energy poverty and urban heat island. Sustainable Cities and Society. Volume 14, pp. 323-333.
Vijayaraghavan, K. (2016): Green roofs: A critical review on the role of compo- nents, benefits, limitations and trends. Renewable and Sustainable Energy Re- views 57, pp. 740–752.
Zeng, C. - Bai, X. - Sun, L. - Zhang, Y. – Yuan, Y. (2017): Optimal parameters of green roofs in representative cities of fourclimate zones in China: A simulation study. Energy and Buildings 150. pp. 118-131.
Szerző(k) / Author(s) Dr. Hoyk Edit PhD
Tudományos főmunkatárs / senior research fellow
MTA KRTK Regionális Kutatások Intézete, Alföldi Tudományos Osztály, Kecs- kemét, Rákóczi út 3. 6000 / HAS CERS Institute of Regional Studies, Great Pla-
in Researh Department, Kecskemét, Rákóczi street 3. 6000, Hungary
E-mail cím: hoyk.edit@krtk.mta.hu / E-mail. address: hoyk.edit@krtk.mta.hu