Ecological Indicators 125 (2021) 107556
1470-160X/© 2021 The Author(s). Published by Elsevier Ltd. This is an open access article under the CC BY-NC-ND license
(http://creativecommons.org/licenses/by-nc-nd/4.0/).
How to evaluate nature-based solutions performance for microclimate, water and soil management issues – Available tools and methods from Nature4Cities European project results
Ryad Bouzouidja
a,*, Patrice Cannavo
b,h, Philippe Bod ´ enan
h, Agnes Guly ´ ´ as
e, M ´ arton Kiss
e,f, Attila Kov ´ acs
e, B ´ eatrice B ´ echet
c,h, Katia Chancibault
c,h, Etienne Chantoiseau
b,h,
Pierre-Emmanuel Bournet
b,h, Rania Bouzidi
c,h, Ren ´ e Gu ´ enon
b,h, Thierry Lebeau
g,h, Marjorie Musy
d,h, Fabrice Rodriguez
c,haUniversity of Bordeaux, CNRS UMR 5295, Arts et M´etiers Institute of Technology, Bordeaux INP, INRAE, I2M Bordeaux, F-33400 Talence, France
bEPHor, Institut Agro, 49045 Angers, France
cGERS-LEE, Univ Gustave Eiffel, IFSTTAR, F-44344 Bouguenais, France
dCerema Ouest, Equipe Projet de Recherche BPE, F-44000 Nantes, France
eDepartment of Climatology and Landscape Ecology, University of Szeged, Egyetem u. 2., H-6722 Szeged, Hungary
fInstitute of Ecology and Botany, Centre for Ecological Research, Alkotm´any út 2-4., H-2163 Vacr´ ´at´ot, Hungary
gUniversit´e de Nantes, UMR 6112 LPG-Nantes (Laboratoire de Plan´etologie et G´eodynamique), 2 rue de la Houssini`ere, BP 92208, 44322 Nantes cedex 3, France
hInstitut de Recherche en Sciences et Techniques de la Ville IRSTV, CNRS, 1 rue de la No¨e, 44321 Nantes Cedex 3, France
A R T I C L E I N F O Keywords:
Urbanization Evaluation tool Microclimate Water management Models
Water quality assessment Urban soils
Key Performance Indicators
A B S T R A C T
In the context of climate change, Nature-Based Solutions (NBSs), a recently developed concept, are increasingly considered as part of the adaptation strategies of the cities. Studies using expert models and methods (EMM) receive a great deal of scientific attention. Considering EMM increasing use, this study aims to perform an analysis of the reported evaluation results, reflecting the capability of the EMM to accurately tackle urban challenges identified within the EU Nature4Cities project. Then, we propose a set of indicators and recom- mendations about sixteen EMM to be used by funders, researchers and practitioners when evaluating the per- formance of NBSs. The coupling of the different components (climate, water and soil) is not a simple matter. The analysis relies on the definition of the range of the reported metrics and on the investigation of the relationship between the various indices, applied for the EMM evaluation. Secondly, the study assesses the existing EMM, indicating the potential of NBSs: (i) to reduce urban heat island, (ii) to limit surface warming, (iii) to increase the thermal comfort of people, (iv) to limit the overheating and runoff of surfaces due to impervious areas, (v) to increase water retention during stormy episodes, (vi) to improve storm water quality at the outlet of the sus- tainable urban drainage systems, (vii) to promote the filtration and epuration of storm water runoff in soil and (viii) to be a support for vegetation. The analysis reveals that EMM can be considered as helpful tools for urban microclimate, urban soil and water management analysis, provided their limitations and characteristics are taken into account by the user when choosing tools and interpreting results (e.g. application scale). With regard to the performance of NBSs, the most commonly used indicators clearly depend on the scale of the project.
1. Introduction
Urban densification has resulted in an increase of impervious sur- faces, leading to increased runoff rates and volumes, losses of infiltration (Fletcher et al., 2013) and other environmental hazards (e.g. heavy metals’ pollution) (Chu et al., 2019). Studies have shown that urban
soils have an unpredictable and heterogeneous layer organisation, poor structure, poor vegetation development and sometimes high concen- trations of persistent contaminants such as trace elements (TE) (De Kimpe and Morel, 2000). Besides climate hazards, the urban population is exposed to toxic agents, as the result of industrial activities and traffic (Khalifa et al., 2018).
* Corresponding author.
E-mail address: ryad.bouzouidja@u-bordeaux.fr (R. Bouzouidja).
Contents lists available at ScienceDirect
Ecological Indicators
journal homepage: www.elsevier.com/locate/ecolind
https://doi.org/10.1016/j.ecolind.2021.107556
Received 28 September 2020; Received in revised form 30 January 2021; Accepted 25 February 2021
Nature-Based Solutions (NBSs) are defined as the use of nature in tackling societal or urban challenges (UCs) and maintaining biodiversity in a sustainable manner (Lafortezza and Sanesi, 2019). For the scientific community, the concept is still very open and needs to be more clearly defined, also to clarify its links with other nature related concepts (e.g.
green infrastructure, ecosystem-based approaches) (Nessh¨over et al., 2017). Nevertheless, there is a growing consensus on the key aspects that frame the concept. NBS can be developed in different environments, from natural and rural areas to more anthropized areas and cities. Pro- moting the idea of getting more nature in cities, the EU is currently especially pushing to develop NBS in urban context (Faivre et al., 2017).
The presence of NBSs in urban areas instead of surfaces with high thermal inertia that store heat limits the overheating of the urban sur- face (Emmanuel and Loconsole, 2015) and thus improves the thermal comfort of people (Depietri and McPhearson, 2017; Kabisch et al., 2017). Moreover, as cities have been blamed for contributing dispro- portionately to global climate change (Dodman, 2009), NBSs associating vegetation and soil can provide a mean to mitigate climate change by storing/sequestering carbon and thus reduce the overall greenhouse gases emissions (GHG) of the urban areas (Velasco et al., 2016).
NBSs used in urban water management help get closer to a natural water cycle (Wild et al., 2017). They are currently named under diverse terminologies, according to the country and/or the language (sustain- able urban drainage systems “SUDS”, low impact development “LID”, best management practice “BMP”, see Fletcher et al., 2015). They are usually based on increasing storage, infiltration and/or evapotranspi- ration processes. Indeed, NBSs have the ability to limit surface runoff, increase water retention during stormy episodes and flood protection compared to impervious surfaces (Liquete et al., 2016) and improve rainwater and runoff waters quality (Husseini et al., 2013). Thus they can mitigate floods by source storm water storage, they lead to a more sustainable urban water management by favouring groundwater recharge and decreasing impervious surfaces (Granados-Olivas et al., 2016). However, due to possible contamination of water and urban soils by heavy metals (Krishna and Govil, 2008; Szekeres et al., 2018), salts and hydrocarbon in particular, the potential transfer of pollutants to the groundwater by recharge during water management should be consid- ered (Carlson et al., 2011a, 2011b; Ostendorf et al., 2009a, 2009b). The treatment performance will highly depend on the design of SUDS and both quality of runoff waters and soils (Fardel et al., 2020). Urban water management and quality (UWMQ) challenges are usually examined at the catchment scale (e.g. (Obropta and Kardos, 2007)) that can also be compared to the neighbourhood scale (extended areas of a city that have relatively uniform land use with dimensions ranging from 0.5 to 4.0 km) for climate issues, for example (Stein, 2014). Indeed, the neighbourhood scale is the smaller scale that integrates a certain complexity of urban pattern (associating buildings, streets, green spaces, etc.) and enables the observation of the interactions between the urban pattern’s indi- vidual elements. However, the performance and the hydrological behaviour of NBSs are more often studied at the local scale (Golden and Hoghooghi, 2018). As a combination of different NBSs stands as the solution rather than only one type of NBSs, and as sustainable water management is more a large spatial and time scales issue, the city scale has also to be studied, municipal or metropolitan perimeters being especially relevant because they also coincide with administrative boundaries within which the strategies of local authorities are devel- oped. The different scales are described in the supplementary material (Section A1). Evaluation of mixed scenarios of NBSs at the city scale can also make it possible to avoid negative joint effects or to promote pos- itive ones (Gunawardena et al., 2017).
In urban areas, soils are often stripped, filled, mixed, compacted and supplemented with artificial materials. The soil structure is modified, and built structures and drainage infrastructures are introduced. NBSs can improve soil properties on two aspects. The first category consists of solutions based on soil modifications, improvement of soil functions and, consequently, the resilience of the built ecosystem to external
factors. These solutions are based on the concept of soil health (Brady et al., 2008). The second category includes solutions that are based on altering flows (water, sediment, nutrients, pollutants) based on the concept of connectivity (Parsons et al., 2015). It include water catch- ment, a range of aspects and topography, varied climatic conditions, sufficient species richness and ecosystem function to allow for multi- functionality of interactions, a number of habitats and sufficient area to permit the ingress of plant species and movement of vectors and animals (Turner, 2005) and understood in the landscape ecology meaning, that is to say an assemblage of ecosystems interacting occur- ring in a geo-graphically defined region (Haber, 1990). The inclusion of NBSs in the urban planning strategy would contribute to the mitigation of some major environmental problems (e.g. loss of organic carbon) (Bouzouidja et al., 2019). Indeed, Foucault et al. (2013) observed at a battery recycling site in Toulouse (France), that green manure increased soil respiration rate by 25 to 50%, leading to a better organic matter humidification process and thus an increase in organic carbon stock. The objective of adding NBSs related to soil quality and management is to allow it to perform two essential functions, which are as follows: (i) to be a support for vegetation. This function is possible if the urban soil has an appropriate agronomic quality (Morel et al., 2015), (ii) to promote the filtration and epuration of urban water.
On the one hand, we have highlighted the complexity of the current challenges in urban areas. On the other hand, it appears that nature- based solutions (NBSs) can efficiently address current environmental issues (climate change adaptation, urban water and soil management) and adapt to each local context.
Implementing NBSs in urban projects would contribute to the miti- gation of major environmental issues and to the development of sus- tainable and resilient cities. This objective requires a reconsideration of the management of urban areas and the development of adapted methodology, methods and models. Currently, various studies and projects funded by the EU’s Horizon 2020 (H2020) programme are working on a framework to recognize and assess the value of these NBS co-benefits and to guide the design and implementation of urban development projects and cross-sectoral policies. Cooperation between urban scientists (climate change, water and soil management) should therefore be promoted. Consequently, to develop sustainable manage- ment of urban areas, it is of utmost importance to use expert models and methods (EMMs) that take into account UCs and the benefits of NBSs.
These EMMs inform us about the performance of NBSs using various urban performance indicators (UPIs) (e.g. Peak flow variation) (Mon- tazeri et al., 2017).
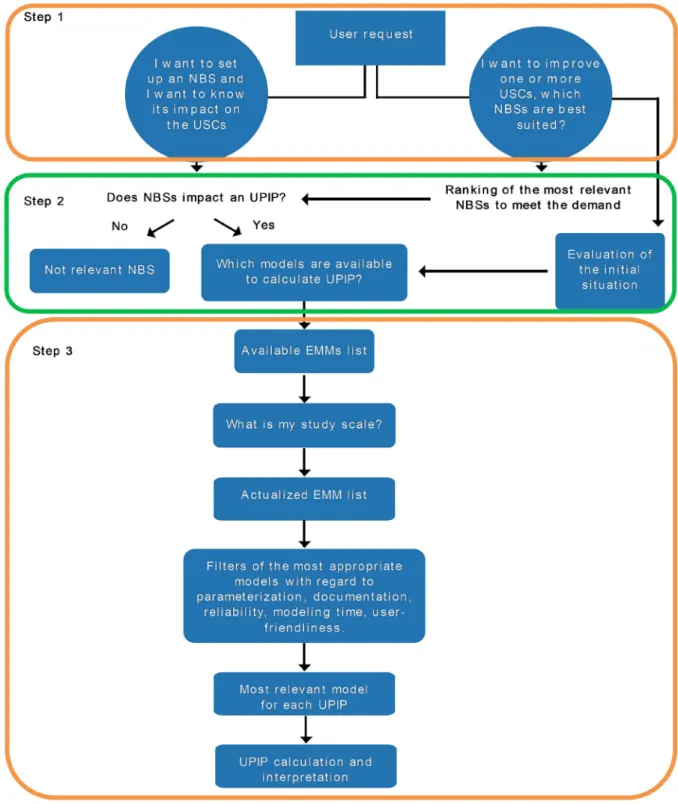
One of the challenges of NBS assessment is the multiplicity of pa- rameters to follow derived from the multiple challenges. Our issue is that the NBS assessment framework cannot be the sum of indicators and EMMs of each challenge addressed. The main aim of this study is to analyse a set of current simulations of EMMs dedicated to urban microclimate, water and soil management, in order to answer the following questions: What are the main variables or list of indicators computed in these EMMs? What cases are implemented? Is the feedback from the climate, water and soil aspects included? The final aim is to propose an evaluation framework adapted to the capture of multipur- pose functionality of NBSs, including the simultaneous achievement of environmental benefits (climate, water and urban soil management).
The structure of this study is the following. First, section 2 provides an overview of the various urban challenges (UCs). Second, taking these challenges into account, an analysis of the performance of NBSs using UPIs in response to the UCs is conducted. We then show in section 3, on the one hand, which expert models and methods (EMMs) are dedicated to urban microclimate, water and soil. Which indicators are able to determine and which are the main variables calculated by these tools.
Which data are implemented and whether there is feedback in relation to the selected challenges (climate, water and soil). On the other hand, we analyse the issues that need to be addressed especially in terms of the capacity of EMMs to tackle UCs and their objectives in relation with the
performance of NBSs, but also the spatial scale of EMMs applications based on the assumptions made in the characterization of NBSs. In section 4, we propose an evaluation framework adapted to the capture of the multipurpose functionality of NBSs, including the simultaneous achievement of environmental benefits (climate, water and urban soil management).
2. Material and methods
2.1. Available urban NBS performance indicators
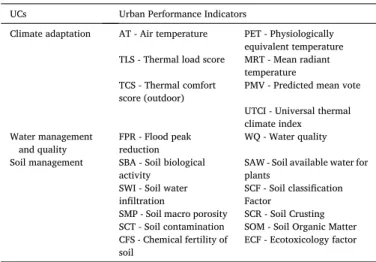
The N4C project (Nature4Cities, H2020, 2016–2020) (Nature4Cities, 2016) aims to identify indicators that can assess the performance of NBSs in relation to UCs. Among the eleven UCs, defined in the N4C project (Fig. 1), stand the three we are interested in: (i) climate change adaptation, (ii) water management and (iii) soil management because of their importance in the urban context. To assess the way NBSs perform to address these challenges, the experts of the project have identified a set of UPIs. A total of 110 UPIs has been collected (Green4cities et al., 2018) and evaluated using the RACER (Relevant, Accepted, Credible, Easy and Robust) framework (Lutter and Giljum, 2008) to assess the value of scientific tools for use in policy making. As we focus on the performance assessment of NBSs supporting function for vegetation, with regards to water quality and quantity, soil quality, and urban microclimate regulation, 19 indicators over the initial 110 were retained here (Table 1). These indicators are described in the supplementary material (Section A2).
The subject area of Urban-Scale Modelling (USM) encompasses numerous techniques and application domains. We have therefore selected models, tools or methods widely used by the expert partners of
the N4C project for the simulation of urban-scale climate, water and soil systems. The EMMs presented in this article are a selection of the EMMs studied in the N4C project (Bouzouidja et al., 2018a). At the end, for the targeted challenges, 18 EMMs were documented (7 for climate, 3 for water and 6 for soil). The list of tools presented in this section is not exhaustive. In the following, we will try to investigate deterministic models and laboratory analysis methods available for assessing NBSs performance at the urban level without taking the evolution and dy- namics of this performance into account. It should be kept in mind
Fig. 1. Schematic diagram adapted from Bouzouidja et al., (2020) of the methodology for analysing the impact of NBS at the urban scale - how to consider the impact of nature on soil management challenge in relation to others challenges. GHG means greenhouse gas emissions. UHI means urban heat island. PET means physi- ological equivalent temperature. UGSP means urban green space proportion. DV means diversity of vegetation. CGS means continuity of green space. BEN means building energy needs. EUA means energy use in agriculture. EE means energy efficiency. Qol means quality of life. (For interpretation of the references to colour in this figure legend, the reader is referred to the web version of this article.)
Table 1
Selected UPIs related to the three urban challenges (UCs) (climate, water man- agement and soil management) based on Green4cities et al. (2018).
UCs Urban Performance Indicators
Climate adaptation AT - Air temperature PET - Physiologically equivalent temperature TLS - Thermal load score MRT - Mean radiant
temperature TCS - Thermal comfort
score (outdoor) PMV - Predicted mean vote UTCI - Universal thermal climate index Water management
and quality FPR - Flood peak
reduction WQ - Water quality
Soil management SBA - Soil biological
activity SAW - Soil available water for plants
SWI - Soil water
infiltration SCF - Soil classification Factor
SMP - Soil macro porosity SCR - Soil Crusting SCT - Soil contamination SOM - Soil Organic Matter CFS - Chemical fertility of
soil ECF - Ecotoxicology factor
however that in some cases, the assessment of NBSs capacity to address urban issues remains limited.
2.2. NBS environmental performance analysis tools
The subject area of Urban-Scale Modelling (USM) encompasses numerous techniques and application domains. We have therefore selected models, tools or methods widely used by the expert partners of the N4C project for the simulation of urban-scale climate, water and soil systems. The EMMs presented in this article are a selection of the EMMs studied in the N4C project (Bouzouidja et al., 2018a). At the end, for the targeted challenges, 16 EMMs were documented (7 for climate, 3 for water and 6 for soil). The list of tools presented in this section is not exhaustive. In the following, we will try to investigate deterministic models and laboratory analysis methods available for assessing NBSs performance at the urban level without taking the evolution and dy- namics of this performance into account. It should be kept in mind however that in some cases, the assessment of NBSs capacity to address urban issues remains limited.
2.3. Framework of modelling/method choice
After the EMMs inventory, a matching table was established that identifies which EMM can simulate and determine which UPI for each UC and at which scale (e.g. building or parcel, neighbourhood, and city).
We suggest evaluating the selected EMMs using structural and technical comparisons, based on six main evaluation criteria, some of which were divided into subcriteria (forming nine subcriteria in total). A score between 1 and 5 was attributed for each subcriteria (1: strongly disagree, 5: strongly agree) (Table 2): The criteria and sub criteria above are not equally important in a model/method selection process, there- fore a weighting score was added, based on expert opinions of the project experts (between 1 and 3, where 3 indicated that the criteria/sub criteria is very important, while 1 is the least relevant). The integrated evaluation was completed with calculating aggregated scores (Yaggr) for every EMM from the evaluation (xi) and weighting scores (wi) as a
weighted sum expressed in % (Eq. (1)) (Madansky and Alexander, 2015). Where xmax is the maximum evaluation score (5 points).
Yaggr= ( ∑9
i=1wi×xi
∑9
i=1wi×xmax
)
×100 (1)
For a group of given EMMs, while considering the same spatial scale, the EMM with the highest score is proposed to be used in the modelling/
methodology procedure.
Reciprocally, these criteria will inform on the operational avail- ability of indicators (an indicator, even very interesting from a theo- retical point of view, will be of limited interest if we could not find any tool to calculate it).
3. Results and discussion
3.1. Climate change adaptation challenge
The performance analysis from the point of view of climate adapta- tion is a challenging task, as the positive effects of NBSs are connected to different sub-processes: different NBSs perform shading and evapo- transpiration quite differently, which is not easy to handle in one modelling framework. The other aspect of complexity is the fact that human thermal comfort depends on many climatic parameters (air temperature and velocity, humidity, radiation circumstances, etc.), which can be evaluated with different indicators (which is of course the case for our UPIs as well). Moreover, NBSs efficiency is strongly linked to local urban form. Table 1 summarizes the selected UPI attached to the EMMs related to the climate change adaptation challenge.
Given the importance of the subject, a large number of existing sci- entific studies have applied EMMs to assess the impact of different mitigation strategies for the improvement of the urban thermal envi- ronment and its implicit effects. To date, the objectives that have been mainly studied with the different models include the following groups:
(i) the reduction of UHI by using NBSs, (ii) increase the thermal comfort of people (iii) limit the overheating of surfaces by using bio-based so- lutions (Table 3).
Several studies have focused on the reduction of UHI (among others, Bozonnet et al., 2013; Chow and Brazel, 2012; Duarte et al., 2015;
Emmanuel and Fernando, 2007; Feyisa et al., 2014; Gromke et al., 2015;
Masson et al., 2002; Musy et al., 2015). These studies have used different indicators: AT and TLS. In this context, microclimate models such as ENVI-met, FLUENT-ANSYS and TEB model have been widely applied to examine the positive impact of various urban green infrastructures on the outdoor thermal environment (Lauzet et al., 2019).
3.2. Water management and quality challenge
The performance assessment of water management and quality for NBS is conducted in N4C project at “parcel”, neighbourhood and city (a set of catchments and sub catchments) scales for swales, green roof and vegetated areas (SUDS) by using different methods. The EMM was parameterised with respect to cover rate and vegetation height (low vegetation and high vegetation mixed). For urban stormwater quantity purposes, the method consists of using urban hydrological modelling.
For urban stormwater quality purposes, the method uses the adapted comparison between physico-chemical properties, nutrients concentra- tions and “micro-pollutants concentrations of water” and European standards for surface waters. Concerning storm water quality, the “good status” of surface waters defined in the EU Water Framework Directive (WFD) relies both on the ecological and the chemical status. The former includes biological indicators, physicochemical parameters controlling biological status, specific pollutants of ecological status and hydro- morphological parameters. The latter is based on the compliance with environmental quality standards (EQSs). The EQSs in Directive 2008/
105/EC are concentration limits of the priority substances (45) and 8 Table 2
Criteria for selecting appropriate expert model and method (EMM).
Criteria Sub-criteria Weighting
factors Parametrization The parameterization of the model
enables the exact representation of different NBS groups and spatial scenarios
3
The required input data are suitable (obtainable, not too complex) for parameterizing the expert model
2
Background
documentation The structure (architecture) of the model or the method and the workflow of the calculations are well- documented and available
3
Reliability of the model/
method Validation studies (that is, comparison with accurate field measurements) exist and the model have got positive feedback from users
3
Modelling time (preparations and model running)
The model or method build up requires short time which enables the usage of the model in expert modelling
2
The running time is not too long which enables the usage of the model in expert modelling
1
User friendliness The model or method can be used easily and correctly by experts (outside of the N4C expert team as well)
1
The model is freely available 2 Application The model or the method is frequently
used for scientific purposes (by international users)
3
other pollutants in water (or biota), i.e. concentration limits. In the case of water quality evaluation for SUDS, the WFD scheme is simplified as biological indicators and hydro-morphological parameters are not relevant. Table 4 summarizes the selected UPI attached to the EMMs related to the water management challenge. Additionally, the
groundwater quality, potentially impacted by NBS stormwater infiltra- tion, should be taken in consideration with the same significance as the surface water quality, given the value of groundwater for drinking water supply (Standen et al., 2020). In terms of storm water runoff, NBSs can positively influence the regulation of surface runoff due to their reten- tion potential. Z¨olch et al. (2017) used a PFV indicator and found that the vegetation together with the substrate store rainwater and make it available for evapotranspiration (1.4% and 14%). In addition, NBSs could increase water retention during rain events. For example, 20% to 100% (10 mm h−1 to 3 mm h−1 respectively) of rainfall were stored (e.g.
(Carter and Rasmussen, 2006). Trees planted on prairie slopes increased water storage under their canopy, again reducing erosion and surface water runoff (Joffre and Rambal, 1993). For example, Ellis et al., (2006) found that treed roads could reduce runoff from a grassy slope by 32 to 68% in a 10-year storm (24.5 mm in 30 min) and by 100% in a two-year storm (48 mm h−1 for 13 min). Finally, by intercepting rainfall in their crowns, trees could reduce storm water runoff and thus protect water quality (McPherson et al., 2011). NBSs can contribute to the improve- ment of water quality through various physical and chemical processes, resulting from the interaction between pollutants (either dissolved or particulate), soil surface, vegetation, and porous media reactive sur- faces, after water infiltration (Fardel et al., 2020).
3.3. Soil management challenge
Urban soils are characterised by strong heterogeneity in terms of physico-chemical properties mainly due to various and contrasted ma- terial supplies (Greinert, 2015; Hulisz et al., 2018; Huot et al., 2015), sometimes including the presence of contaminants (De Kimpe and Morel, 2000; van Gestel et al., 2001). Moreover, these soils differ from natural or cropped soils: they display a lower nutrient content (except the urban allotment gardens often super fertilised (Laaouidi et al., 2020)) and a higher pH (Roberts et al., 2006; Zainudin et al., 2003), high physical compaction as a result of mechanical stress (road traffic) potentially impacting plant root and aerial growth (Grabosky and Gil- man, 2004). Organic matter content is also more contrasted depending on the soil use, but generally low, especially due to the lack of organic matter return as litter fall, particularly in isolated street tree pits (Rob- erts et al., 2006).
Thus, soil management requires knowledge of various processes:
physical, chemical and biological. It is not possible to dissociate them.
Table 5 summarizes the different EMMs taken into account in urban soil management. According to FAO (2009), soils are the foundation for vegetation and they have a reciprocal relationship. In addition, a proper soil management can promote filtration (e.g. Tedoldi et al., 2017) and pollutant mass load reduction of urban water (e.g. Shirazi et al., 2012).
Table 3
Main climatic expert models and methods (EMMs) developed in Nature4Cities (N4C) project.
Objective related to urban challenge
UPI Expert
models and methods
References
Reduce urban
heat island AT - Air
Temperature FLUENT-
ANSYS (Chatzidimitriou and Yannas, 2016; Gromke et al., 2015; Tominaga et al., 2015; Yang et al., 2017)
ENVI-met (Wu et al., 2019) TEB model (Lemonsu et al., 2012;
Masson et al., 2002) TLS - Thermal
Load Score ENVI-met (Bruse, 1999; Huttner and Bruse, 2009)
Increase the thermal comfort of people
UTCI - Universal Thermal Climate Index
ENVI-met (Goldberg et al., 2013;
Minella et al., 2014; Park et al., 2014)
TEB model (De Munck et al., 2018;
Lemonsu et al., 2012;
Masson et al., 2002) RayMan
model (Goldberg et al., 2013;
Matzarakis et al., 2010;
Thom et al., 2016) SOLENE-
Microclimat (Malys et al., 2015) FLUENT-
ANSYS (Montazeri et al., 2017;
Saneinejad et al., 2014a, 2014b)
PMV - Predicted
Mean Vote ENVI-met (Hedquist and Brazel, 2014; Maras et al., 2013;
Wang et al., 2015) FLUENT-
ANSYS (Robitu et al., 2006;
Zhang et al., 2012) RayMan
model (Abdel-Ghany et al., 2013; Matzarakis et al., 2010; Oertel et al., 2015) PET Physiologically
Equivalent Temperature
RayMan
model (Charalampopoulos et al., 2013; Guly´as et al., 2006;
Hwang et al., 2011;
K´antor et al., 2016;
Kovacs et al., 2016; ´ Matzarakis et al., 2010) ENVI-met (Acero and Herranz-
Pascual, 2015; Chen and Ng, 2013; Duarte et al., 2015)
FLUENT-
ANSYS (Yang et al., 2017; Zheng et al., 2016)
SOLENE-
Microclimat (Malys et al., 2015) TCS - Thermal
Comfort Score (outdoor)
ENVI-met (Bruse, 1999; Hutter et al., 2009) Limit the
overheating of surfaces
MRT - Mean Radiant Temperature
RayMan
model (Krüger et al., 2014; Lee and Mayer, 2016;
Matallah et al., 2020) SOLWEIG-
model (G´al and K´antor, 2020;
Lindberg et al., 2018) ENVI-met (Chow and Brazel, 2012;
Emmanuel and Fernando, 2007; Krüger et al., 2011;
Tan et al., 2016) FLUENT-
ANSYS (Yamaoka et al., 2008) SOLENE-
Microclimat (Malys et al., 2015)
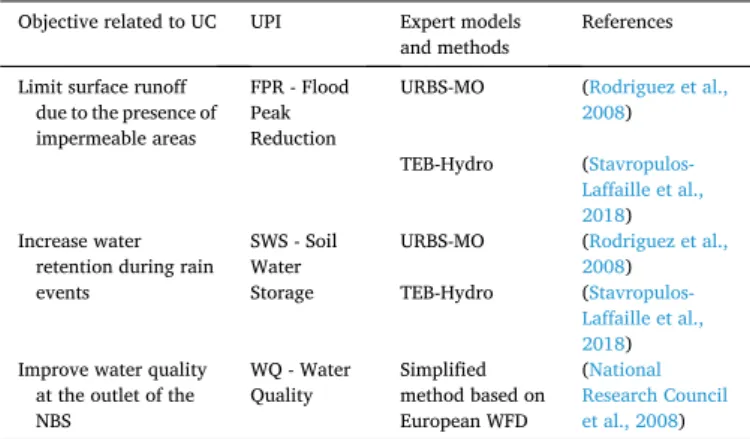
Table 4
Main urban water management expert models and/or experimental methods (EMMs) developed in N4C. UC means urban challenge.
Objective related to UC UPI Expert models
and methods References Limit surface runoff
due to the presence of impermeable areas
FPR - Flood Peak Reduction
URBS-MO (Rodriguez et al., 2008) TEB-Hydro (Stavropulos-
Laffaille et al., 2018) Increase water
retention during rain events
SWS - Soil Water Storage
URBS-MO (Rodriguez et al., 2008) TEB-Hydro (Stavropulos-
Laffaille et al., 2018) Improve water quality
at the outlet of the NBS
WQ - Water
Quality Simplified method based on European WFD
(National Research Council et al., 2008)
3.4. Selected expert models and methods based on the evaluation criteria The comparison between the selected EMMs according to the scoring system and their spatial scale is presented in Table 6 (details of the scoring system are presented in the supplementary material Table S1). In
the context of climate change adaptation challenge, SOLWEIG-model has obtained the highest score (84.0%) in terms of the criteria selected and the neighbourhood scale (Table 2). This model works at the object and neighbourhood scales. One important advantage of SOLWEIG- model among microclimate simulation models is that it is usable at the neighbourhood scale through the GIS representation of buildings and other important elements of modelling. Between 1989 and 2020, almost 219 papers have been identified based on Scopus database;
81.7% of them concern articles published in scientific journals, while the rest 16.0% and 2.3% correspond to conference papers and book chapters respectively (data not shown). As SOLWEIG works now as a part of a plugin (UMEP), it is ready to be integrated directly in QGIS, which makes it very practical for usage in integrated urban assessments.
Meanwhile, the core indicator calculated by SOLWEIG is the mean radiant temperature; the model focuses on radiation scenarios, instead of complex indicators (e.g. PET). The one that scored almost the same is RayMan model with 83%. RayMan model is a good alternative to tackle climate adaptation USC instead SOLWEIG-model at object and neigh- bourhood scales. Although, RayMan model is not GIS-based, it can import building geometry data from QGIS when working on a large domain. By default, it only calculates point results but no continuous surface data, but continuous surface data can be obtained by running the model on a grid (of any size) and then interpolating the point data. On the contrary, ENVI-met simulates an area by default. RayMan simulates the complex radiation environment, while ENVI-met can predict all the meteorological parameters (including air temperature, relative humid- ity, wind speed and solar radiation). RayMan uses real meteorological data, while ENVI-met builds the most probable weather conditions (using an urban weather generator) to provide the input data to the model (Bande et al., 2019). RayMan considers the thermal effects of vegetation and buildings only, while ENVI-met considers the land cover by defining the percentage of vegetation over a given surface. RayMan can create several year-long output data, while due to the complexity of the model (e.g. spatial representation of wind velocity), ENVI-met re- quires greater computational capacity and runtime (e.g., for 2 weeks of neighbourhood data, the computational time is 1 week) (e.g., Fachinello Krebs et al., 2017) than RayMan (about 3 days on average, depending on resolution). Finally, ENVI-met is a widely used EMM. Tsoka et al. (2018) reported in a review on ENVI-met use in 2018 that almost 280 respective papers have been identified in the Scopus database; 68% of them concern articles published in scientific journals, while the rest 31% and 1% correspond to conference papers and book chapters respectively.
At the neighbourhood scale, ENVI-met got 80%. This model is a three-dimensional, grid-based microclimate model designed to simulate and predict complex surface-vegetation-air interactions in the urban environment. Also, ENVI-met model can simulate the diurnal cycle of major climate variables involving meteorological data (air and soil temperature and humidity, wind speed and direction, radiative fluxes, etc.) with a typical horizontal resolution of 0.5 to 5 m and a time step of 1 to 5 sec (Huttner, 2012). At the city scale, only TEB-model has a relevance, getting a score of 75% (Table 6). TEB is based on a canyon street model (Masson, 2000), which can be used for street-level calcu- lation as well as to calculate UHI and impact of mitigation solutions at the city scale using MESO-NH model (De Munck et al., 2013a, 2013b).
The city is then discretised into homogenous cells whose geometrical and material characteristics are calculated by averaging real values. The behaviour of the resulting representative canyon-street is then calcu- lated. TEB performs water and heat balance under climatic forcing (Lemonsu et al., 2004).
Concerning urban water management and quality challenge, it can be noticed that the different EMMs are dedicated to only one scale. It is therefore useful to compare these EMMs with each other with respect to the scale of application. Moreover, they all have almost the same score (between 71 and 74%). For example, URBS-MO and TEB-Hydro are both able to represent all hydrological processes involved in the urban storm water budget, such as evapotranspiration, infiltration in roads, or direct Table 5
Summarizing urban soil management expert models and/or experimental methods (EMMs) that are developed in N4C.
Objective related to
urban challenge UPI Expert models and
methods References
Be a support for
vegetation SCR - Soil Crusting Fertility
Evaluation method (ˇSimanský et al., 2014) SMP - Soil macro
porosity Fertility
Evaluation method (Yilmaz et al., 2018) SAW - Soil
available water for plants
Fertility
Evaluation method (Vidal- Beaudet et al., 2017) SCF - Soil
classification Factor
Textural function
method (Morel et al., 2017) SBA - Soil
biological activity Soil Biological Activity Evaluation Method (SBA EM)
(Keuskamp et al., 2013) SOM - Soil organic
Matter Fertility
Evaluation method (Cambou et al., 2018) CFS - Chemical
fertility of soil Fertility
Evaluation method (Bouzouidja et al., 2020) Promote the
filtration and pollutant load reduction of urban water
SWI - Soil water
infiltration Fertility
Evaluation method (Zhang, 1997)
SCT - Soil
contamination Fertility
Evaluation method (Jean-Soro et al., 2015) ECF -
Ecotoxicology factor
Ecotox evaluation method (Ecotox EM)
(van Gestel et al., 2001)
Table 6
Expert models and methods (EMMs) selected according to the scoring system and spatial scales.*coupling with MESO-NH model (Lac et al., 2018). UCs means urban challenges.
UCs EMMs Score Scale
Parcel Neighbourhood City Climate change
adaptation challenge
FLUENT-
ANSYS 67.0 X X
ENVI-met 80.0 X
TEB-model 75.0 X X*
RayMan model 83.0 X X SOLENE-
Microclimat 65.0 X
SOLWEIG-
model 84.0 X X
Urban water management and quality challenge
URBS-MO 74.0 X
TEB-Hydro 71.0 X
Simplified method based on European WFD
72.0 X
Soil management
challenge Fertility Evaluation method
72.0 X
Textural function method
90.0 X X X
Soil Biological Activity Evaluation Method
79.0 X
Ecotox evaluation method
61.0 X X X
infiltration of soil water in sewers. They differ in the spatial segmenta- tion: TEB-Hydro is based on a regular mesh grid with a sewer network adapted to its grid resolution whereas URBS-MO includes an irregular morphological segmentation of the urban environment based on cadastral parcels and urban databanks analysis. The models are able to predict both the spatial and temporal variability of hydrological pro- cesses on urban catchments, at the hydrological unit scale (Rodriguez et al., 2007; Stavropulos-Laffaille et al., 2018). URBS-MO is able to simulate the storage capacity and saturation level of each unit. EMMs are distinguished by their field of application: URBS-MO and TEB-Hydro are able to determine the quantity indicators, i.e. FPR (Flood Peak Reduction), whereas the water quality is determined along with the European Water Framework method (Seelen et al., 2019).
Eventually, in the context of urban soil management, textural func- tion method with a score of 90% is able to access the physical process of soil management. In addition, SBA EMM with a score of 79% may also determine the biological activity of soil. Ecotox EM has obtained a score of 61%. However, basic soil properties (e.g. organic matter) can explain the level of contamination in the soil (Bouzouidja et al., 2020). Indeed, in some NBS such as green roofs or urban allotment gardens, substrates/
soils are derived from already contaminated materials, but also from practices such as the use of pesticides (Gasperi et al., 2014; Nunes et al., 2016).
3.5. Consistency between models/methods with parametrization
Both RayMan and SOLWEIG models require quite important spatial datasets, as both models need a description of the investigated area, including the geometry of the buildings and vegetation, along with their radiative properties. These data are frequently available in municipal- ities (e.g. building databases, simple digital elevation models, etc.), but some of them are not easy to obtain (e.g. tree canopy dimensions and trunk heights) and their integration can be difficult. RayMan model provides good simulation results for radiation flux densities and thermo- physiologically significant assessment indices (Matzarakis et al., 2010).
The model, which takes complex structures into account, is suitable for utilization and planning purposes on local and regional level (Matzar- akis and Rutz, 2010). It is well-suited to calculate radiation fluxes (Charalampopoulos et al., 2013; Guly´as et al., 2006). The main advan- tage of the RayMan model is that it facilitates the reliable determination of the microclimatological modifications of different urban environ- ments, since the model considers the radiation modification effects of the complex surface structure (buildings, trees) very precisely (Guly´as et al., 2006). The results obtained using RayMan model can be a valu- able source of information for planners, decision-makers and practi- tioners when planning and constructing new urban areas (Guly´as et al., 2006). The parametrization of SOLWEIG is based on the same principle as RayMan, but it allows an easier representation of different NBSs. The vegetation scheme of the model handles vegetation with digital surface models; it does not need any information on species or specific size parameters. Thus, it theoretically enables the representation of every type of urban vegetation and NBSs.
SOLENE-Microclimat, ENVI-met and FLUENT-ANSYS give access to more detailed information, particularly air-flows and their impact on local microclimate. Therefore, their parameterization is more complex, and two categories of parameterizations are required to operate them:
(i) parameters for building layout, vegetation, soil type and (ii) simu- lation parameters for location, meteorological condition initialization values, and schedules (Tsoka et al., 2018). Those data are not readily available and measurement is time consuming. SOLENE-Microclimat allows the parameterization and representation of natural soil, green walls, green roofs, lawns, street humidification, trees and shrubs - no rivers and large water bodies (Bouyer et al., 2011; Malys et al., 2016, 2014; Morille et al., 2016; Musy et al., 2015; Robitu et al., 2006).
However, it is difficult to have a good parameterization, as for example SOLENE-Microclimat requires leaf area index (LAI) and water
availability, as well as soil/buildings characteristics. A major limitation of ENVI-met is that inter-reflections are not accounted for in the calcu- lated shortwave radiation and longwave radiation takes into account averaged temperatures so rendering difficult to assess the local impact of surface temperature change (Lauzet et al., 2019). The main disadvan- tage is stability issues when simulating winding urban canyons or abutting neighbourhoods (Elwy et al., 2018). Furthermore, relative humidity is not a prognostic factor, as the simulation of cities in humid regions (RH above 50%) leads to erroneous results of RH above 100%.
Recently, the forcing function has made a big improvement to the model, but it still has its own instabilities. FLUENT-ANSYS is basically adapted to fluid mechanics problems coupled with thermal and radia- tive transfers. Recent adaptations include the interaction of the local environment with plants (e.g. Bouhoun Ali et al., 2018). High level of realism was obtained in a constrained environment with relatively small dimensions (tens of meters). FLUENT-ANSYS requires a large set of data, particularly in case of 3D simulations (meteorological data, thermal and radiative properties of walls; some of them being more difficult to assess, e.g. LAI and water availability of the soil) (Boulard et al., 2017).
Unlike the previous EMM, TEB was conceived for a use at a larger scale using a 1D meteorological forcing (De Munck et al., 2018). The model is run in order to compute water, energy and momentum surface exchanges over the impervious covers (roofs, roads, walls) at a neigh- bourhood or city scale, using mean value for the entire area. This approach is less computationally intensive for large scale studies, but the aggregation of parameters datasets must be performed for the results to be relevant. The contributions of gardens take place through the long- wave emission that is received by roads and walls (Lemonsu et al., 2012). Vegetation is directly included inside the canyon, allowing shadowing of grass or trees by buildings, better representation of urban canopy form and, a priori, a more accurate simulation of canyon air microclimate (Lemonsu et al., 2012; Redon et al., 2017). The radiation and energy budgets and the turbulent exchanges within the canyon of the model are represented in detail in Lemonsu et al., (2012) and Mas- son, (2000).
The water and energy urban scheme TEB with HYDRO module al- lows the evaluation of the greening strategies in regards to urban hy- drology and climate (Chancibault et al., 2014; Stavropulos-Laffaille et al., 2018). At the scale of a large urban area (in the city of Nantes, France), some greening strategies have been simulated: green roofs, trees/grassed areas and different fractions of natural surfaces (Chanci- bault et al., 2014). This model can be run either coupled with other meteorological models or forced by observed atmospheric data. It combines two surface schemes, TEB (Masson, 2000) and ISBA-DF (Boone et al., 2000), that are based on a regular mesh grid. URBS-MO inputs at the scale of an urban hydrological element consist of the meteorological ‘‘forcing’’, which includes precipitation and potential evapotranspiration; and the initial saturation depth (Rodriguez et al., 2008). URBS-MO is based on urban databanks to print the morphology of the urban surface: the parcels and the street network (Rodriguez et al., 2007). Thus, urban catchments are represented as a set of elementary surfaces connected to a hydrographic network, based on the city’s main structural components. URBS-MO requires both morphological features and physical parameters (Rodriguez et al., 2007). This detailed repre- sentation is well adapted for the introduction of plot-scale greening strategies (Rodriguez et al., 2007). Most entries should have been deduced from physical considerations, either literature reviews, field measurements or parameters adjustment (Rodriguez et al., 2008). The method for water quality evaluation is divided into two steps: 1) eval- uation of ecological status (physicochemical); 2) evaluation of chemical status. In the first step, basic physicochemical data are required to obtain a global evaluation of the quality. If relevant, some complementary chemical analysis on metallic and organic contaminants may be per- formed, after characterization of pollutant sources in the vicinity of the NBS or due to maintenance.
To parameterize the Ecotox EM, doses of chemical stressors that
affect soil organisms (regarding EC50, LD50, etc.) can be acquired from freely available databases (see below). The question arises about the bio- indicators to be included in the method. So far, there is no consensus. In France, 18 bio-indicators were approved by ADEME and some combi- nations were suggested for different purposes (P´er`es et al., 2011). EC50, LD50 and TD50 and several other parameters regarding physico- chemical characteristics of soils to be taken into account (texture, Henry constant, solubility, etc.) are quite easily available in database, e.
g. EPA1 (USA); INERIS2 and INRS3 (France). Concerning Fertility EM, soil moisture status is largely determined by porosity, which is a key attribute of soil structure. The size or diameter of pores regulates the energy state at which moisture is held in soil and its availability to plants (Jim and Peng, 2012). Fertility EM requires input data obtained from direct measurement (e.g. SWI, SCF), derived from models or equations (e.g. SMP, SAW, SOM) (Cambou et al., 2018; Yilmaz et al., 2018).
Concerning Textural function method, statistical correlations between soil texture, soil water potential, and hydraulic conductivity can provide estimates sufficiently accurate for many analyses and decisions (Saxton and Rawls, 2006). The texture function-based method reported by Saxton et al., (2006) has been successfully applied to a wide variety of analyses, particularly those of agricultural hydrology and water man- agement. The required input data for SBA EM is acquired with labora- tory experiments and in-situ tests are necessary. However, SBA EM is a unique, multifunctional method requiring few resources and minimal prior knowledge. The standardisation and simplicity of the method make it possible to collect comparable, globally distributed data through crowdsourcing (Ogden, 2017).
3.6. Status of documentation on models/methods
Sufficient amount of information about RayMan has been available since its creation in 2007 (Matzarakis et al., 2010, 2007; Matzarakis and Rutz, 2017, 2010). Concerning SOLWEIG, an online manual is available (Lindberg and Grimmond, 2011). There is a wiki and a forum group to help, but SOLENE-Microclimat is dedicated to research so that it is needed to use Python and to be able to change parameters in scripts.
ENVI-Met is well documented (Bruse, 2004) concerning its use, but not with regards to the physical modelling. FLUENT-ANSYS is a commer- cially available software that is largely used in the industry. Publications using the software are numerous (e.g. Chatzidimitriou and Yannas, 2016; Hanna et al., 2006). Nevertheless, applications of this EMM including vegetation are not so common and require specific de- velopments through user defined function (implemented in routines) (Ansys, 2017). It should be noted that both ENVI-met and FLUENT- ANSYS benefit from the support provided by the commercial entities responsible for their developments, for a cost.
TEB-Hydro is a part of SURFEX. The structure and the workflow of the calculations of the modelling platform SURFEX, in which the model TEB-Hydro is available, are well documented. The equations and the structure of the TEB-Hydro module are well explained in Chancibault et al., (2014) and Stavropulos-Laffaille et al., (2018). It will be soon available, in the version 8 of SURFEX. The structure of the URBS-MO and the workflow of calculations is well developed in (Rodriguez et al., 2008). The basic documentation for the water quality evaluation is those of the European WFD, which was transcribed in each European country.
The documentation of the national institutions in charge of water management will be the basic sources of information. The specific urban pollutants were selected from French review studies.
The structure of Ecotox EM is documented in Huber and Koella, (1993). This method is based on an interpolation log method using the following formula to calculate EC50 value. Direct Interpolation method
is similar to interpolation log method but without logarithmic trans- formation of concentrations. The formula for EC50 calculation is set according to Alexander et al., (1999). Fertility EM is well documented in Vidal-Beaudet et al., (2017). Furthermore, some studies described certain UPIs: SMP (e.g. Bouzouidja et al., 2018b; Jim and Peng, 2012), SCR (e.g. Szymanski et al., 2015). A total of 20 institutions from 12 ´ European countries collaborated in establishing the database of HY- draulic PRoperties of European Soils (HYPRES) using textural function method. The structure of textural function method is well documented (e.g. Minasny and McBratney, 2001; Shirazi and Boersma, 1984). SBA EM is very well documented in Keuskamp et al., (2013). At the same time, a site is dedicated to this method4.
3.7. Reliability of the expert models and methods
RayMan is well validated by several former studies (among others, (Lin et al., 2010; Matzarakis and Rutz, 2010; Thorsson et al., 2004) that attest RayMan’s very good accuracy (Fr¨ohlich and Matzarakis, 2013).
For example, Thorsson et al., (2004) found that RayMan worked very well during the middle of the day in July, i.e. at high sun elevations.
However, the model considerably underestimates MRT in the morning and evening in July and during the whole day in October, i.e. at low sun elevations. In addition, RayMan underestimates MRT during much of the year (autumn, winter and spring) as well as in the mornings and evenings in the summer. In most publications, where SOLWEIG-model was used, field validation exists and is presented (e.g. Chen et al., 2014; Lindberg and Grimmond, 2011). This can be explained by the fact that the main calculated parameter (mean radiant temperature) can be measured with different methods. Concerning SOLENE-Microclimat, different modules have been validated. In particular, attention has been paid to validate the radiative part with comparison with mea- surements (e.g. H´enon et al., 2012a, 2012b; Idczak et al., 2010). Some modules have also been validated as soil, green wall, building (e.g. Azam et al., 2018; Musy et al., 2015). However, the overall model has not been validated considering the difficulties to measure a wide range of pa- rameters covering different physical problems, on a large number of locations. Several articles were published on the validation of ENVI-met during the last two decades. They also focus on the study of current microclimatic conditions and on the comparative evaluation of the performance of various mitigation strategies for the effect of UHI (among others, (Chatzidimitriou and Yannas, 2016; Chen and Ng, 2013;
Tsoka et al., 2018; Yang et al., 2011). FLUENT-ANSYS is a standard for CFD studies and has been validated in numerous studies (e.g. Bouhoun Ali et al., 2018; Bournet and Boulard, 2010). Concerning the coupling with vegetation, several validations were performed for cases inside greenhouses (Bouhoun Ali et al., 2019, 2018) and an ongoing study is running to adapt the crop sub-model to urban environments. The vali- dation of TEB model with urban measurements has been carried out since 2000 (Masson, 2000). Different modules have been added (e.g.
presence of vegetation) (Lemonsu et al., 2004). Addition of the vege- tated roof module (De Munck et al., 2013a, 2013b) and the street tree module (Redon et al., 2017) are more recent.
TEB-Hydro is evaluated by comparing simulated and observed dis- charges of three catchments (5 ha, 31 ha and 513 ha) included in a French long-term urban observatory (Chancibault et al., 2014;
Stavropulos-Laffaille et al., 2018). The comparison of simulated dis- charges with observed ones shows an overestimation from the model but a realistic dynamic at a daily scale (Chancibault et al., 2014). URBS-MO has been the subject of some validation studies (Bouhoun Ali et al., 2019; Li et al., 2014; Rodriguez et al., 2007, 2008). This work is in progress (data not shown). In order to evaluate this model, it has been applied at two different scales, on two urban catchments of various land
1 www.epa.gov (accessed September, 15 2020)
2 www.ineris.fr (accessed September, 15 2020)
3 www.inrs.fr (accessed September, 15 2020)
4 http://www.teatime4science.org/method/stepwise-protocol/ (Accessed September, 15 2020).
use, where hydrological data were available. This evaluation is based on the comparison of observed and simulated flow rates and saturation levels, and details the various compartments (soil, impervious or natural areas) to the outflow (Rodriguez et al., 2007). The adapted method for water quality evaluation is based on the literature on pollutants in storm water (Gasperi et al., 2014) and the European authority regulation implemented in each European country (ex. (French legal decree, 2008)), since the beginning of the 2000 s.
Several studies have focused on ecotoxicology and used Ecotox EM, particularly in urban areas. This in order to prevent risks to soil organ- isms (e.g. impact of pesticides) (among others, Ahmed and H¨ader, 2010;
Azizullah et al., 2013), suitability for use groundwater (e.g. Afonso et al., 2010) or an important habitat for rare and unprotected specialized an- imals (e.g. stygofauna) (Reboleira et al., 2013). In most publications, where Fertility EM was used, field validation exists and is presented (among others, Damas and Rossignol, 2009; Gosling et al., 2013; Vidal- Beaudet et al., 2017). Due to the heterogeneity of texture classification systems around the world, textural classes should be harmonized to the international system. For instance, Minasny and McBratney (2001) observed that the silt texture was not included in the Australian texture classification. They found that the USDA/FAO occupied 60% of the Australian soil texture triangle. The soil texture representation with the standard textural fraction triplet “sand–silt–clay” is commonly used to estimate soil properties. The differences between the texture triangles, in terms of textural classes, come mainly from the soil databases used to build them. The objective of this work was to test the hypothesis that other fraction sizes in the triplets may provide a better representation of soil texture for estimating some soil parameters (Fini et al., 2017). To date, the SBA EM has been used in upwards of 2000 locations across the globe. Studies have validated this method throughout the world (e.g.
Marley et al., 2019; Seelen et al., 2019).
3.8. Expert models and methods time (preparation and running) ENVI-met model scenarios may take some time to build. This de- pends on the size of the cells. A small model with a 65*65*30 grid cells can be prepared and simulated quickly. However, a 24-hour simulation of 250*250*30 grids can take more than a week (Elwy et al., 2018).
RayMan is developed for case studies and for operational use for different planning levels (Matzarakis et al., 2007). The advantages of RayMan are the ease of input and the combination of different options in buildings and vegetation properties, fish-eye photographs. RayMan re- quires a relatively short preparation time and run, however this depends on the data quantum (simulation objective). In general, the users have to perform a complex (time-consuming) preparation of input data. A time- increasing process compared to some other models: the wind speed must be reduced manually before the simulation (´Egerhazi et al., 2014). ´ Because RayMan can model only the surrounding radiation (e.g. MRT) and bioclimatic indices (e.g. PET), the simulation CPU time is less compared to ENVI-Met. Depending on the amount of data the running time at a given grid point ranges from several seconds to 5–10 min (even in case of several-year long databases). The time for SOLWEIG build up can be higher if the input data needs much preparation time by the user (e.g. tree cadastre data for vegetation DSM). In addition, at the micro scale, the running time does not limit the use of it in expert modelling. In terms of build-up, preparation and running time compared to ENVI-met, SOLENE-Microclimat was about 10 times quicker. We can run 2 or 3 weeks simulations in 2 days on a typical workstation. It is important to be able to have different days (different wind directions, radiative conditions, etc.) and to take into account buildings and soil inertia, which requires simulating several days before the period of interest.
Users have to attend a specific training to get accustomed to FLUENT- ANSYS EMM. This EMM also requires high knowledge of numerical methods and fluid mechanics. Defining the geometry and building, the grid used for calculation also requires a specific “skill” and some time.
Finally, large 2D cases as well as 3D cases may require a high CPU time
and computer resources to run. The time is a direct function of the spatial dimensions of the problem as well as the expected level of pre- cision. Concerning TEB, the model build up time depends on the avail- able data quality and the area of the study site. More than two days are useful to build up the model. The running time depends on the resolu- tion, the configuration, and the area of the domain and the length of the simulated period. For example, the simulation of a domain with an area of 75 m2 with TEB, at a 1 h resolution forcing time step and a 30 sec numerical time step during 365 days takes 6 min.
URBS-MO and TEB-Hydro build up time depends on whether the data is available or not and the area of the study site. For both, the running time depends on the resolution, the configuration, the size of the catchment and the simulation period length. For example the simulation with URBS-MO of the Pinsec catchment, in Nantes, France (0.31 km2), 335 parcels, during a simulation period of one year takes three minutes, using a 5 min time step. For the simulation with TEB- Hydro, of a domain with an area of 46 km2, at a 200 m × 200 m spatial resolution, a 1 h resolution forcing time step and a 5 min nu- merical time step during 884 days takes a few hours. The water quality evaluation requires water samplings or on-site measurements. Before this step, the study of the urban context is mandatory to determine the target pollutants. Moreover, the hydraulic functioning should be taken into account to optimize the water sampling. This preparation of the sampling/measurement campaigns may be then more time-consuming than the data collection itself.
To build up and run Ecotox EM, data has to be acquired first (some of them from databases and others from experiments that may sometimes take time (a few days to a month). The Fertility EM build up and run require relatively little time. However, this time may increase if the preparation of input data takes extra time. Due to its simplicity, the construction time of the Textural function method is less than one minute. In addition, there is no running time if the input data are available. Finally concerning SBA EM, the time required to prepare and analyse the results is 3 days. While the execution time is 90 days (Keuskamp et al., 2013).
3.9. User friendliness
Due to its clear structure, RayMan model can be applied not only by experts in human-biometeorology, but also by people with less experi- ence in this field of science (Matzarakis and Rutz, 2010). The presented model provides: (i) diverse opportunities in applied climatology for research and education (Matzarakis and Rutz, 2010), (ii) user friendly windows-based interface (Charalampopoulos et al., 2013) and (iii) the estimation is very flexible and practical (Mahmoud, 2011). RayMan model is a free software and available for general use (Zaki et al., 2020).
SOLWEIG-model is now integrated in QGIS (as a part of the UMEP module), which is one of the leading GIS software, used by urban micro- climatologists or green infrastructure experts as well. This makes the usage easy for these experts. The model is freely available (assistance can also be acquired from the developers by University of Gothenburg).
SOLENE-Microclimat is free, however difficult to obtain. Training is required to be able to use the model. ENVI-met is not freely available.
Different prices exist depending on the use (e.g. educational, research or industrial)5. FLUENT-ANSYS is too complex and cannot be used easily without substantial training. In addition, the model is under academic and industrial licences (several thousands of Euros). Academic licence is far cheaper than an industrial licence. Finally, TEB model is a part of the surface modelling platform SURFEX, which is accessible on open source, where the codes of the surface schemes TEB and ISBA can be down- loaded from the National Center for Meteorological Research (CNRM) website6.
5 https://www.envi-met.com/buy-now/(accessed September 15, 2020)
6 http://www.Cnrm-game-meteo.fr/surfex/ (accessed September 15, 2020)