Computers, Environment and Urban Systems 87 (2021) 101600
Available online 25 January 2021
0198-9715/© 2021 The Authors. Published by Elsevier Ltd. This is an open access article under the CC BY license (http://creativecommons.org/licenses/by/4.0/).
Numerical modelling for analysis of the effect of different urban green spaces on urban heat load patterns in the present and in the future
Tam as G ´ ´ al
a,*, S ´ andor Istv ´ an Mah ´ o
a,b, N ´ ora Skarbit
a, J ´ anos Unger
aaDepartment of Climatology and Landscape Ecology, University of Szeged, 6722 Szeged, Egyetem u. 2, Hungary
bUniversity of Helsinki, Finland
A R T I C L E I N F O Keywords:
Urban heat load Climate indices Greening scenarios Urban-scale modelling Present climate Climate change
A B S T R A C T
This paper focuses on urban green spaces in terms of climate and human thermal comfort containing their effect on heat load mitigation. It incorporates a modelling study in which the role of green spaces was investigated in terms of heat stress modification by applying MUKLIMO_3 model. During the experiment, the thermal effects of dense trees, scattered trees, grasslands and mixed green infrastructure has been investigated in the case of Szeged (Hungary) and assessed using different climate indices. The investigations encompassed 3 climatological time periods (1981–2010, 2021–2050 and 2071–2100) and two emission scenarios for future climate (RCP4.5 and RCP8.5). It was found that urban green spaces (e.g. parks) generally cool the environment, although, the cooling potential of the different green types differs. The highest reduction of heat load was found in the case of large urban parks comprising of dense trees near the downtown. The spatial extension of detected cooling was found small. However, it would increase during the future, especially in the case of grasslands. For urban planners, it is highly recommended to introduce new green sites within a city and to increase the spatial extension of the existing ones to mitigate and adapt to the impacts of climate change in the urban environment.
1. Introduction
Nowadays climatological research has become the focus of attention as recent and future climate change is a potential threat to our society, whose effects will be perceptible all over the globe, including cities (Stocker et al., 2013). Urban climate research investigates different local climate modifications caused by built environments, in addition it also attempts to provide reliable forecasts for future climatic trends at local scale. According to UN (2019), urban population follows a rapidly growing trend, which makes urban climate research crucial (Arnfield, 2003).
Climate change modelling is a particularly complex process that uses general circulation models (GCMs) that can simulate a wide range of physical processes at a global scale (Bader et al., 2008). To represent local scale atmospheric phenomena, Regional Climate Models (RCM) are applied, which contain detailed physical processes determining the local climate. These models are commonly nested into GCMs as their output data serve as lateral boundary conditions for them (McGregor, 1997). In order to project future climate patterns it is a necessity to account for possible future anthropogenic activity trends. Hence, a model run has to be combined with a future emission scenario. The 5th Assessment Report
of the IPCC contains four future emission scenarios called them as Representative Concentration Pathways (RCPs) that are distinguished by the enhanced radiative forcings resulting from different predicted rates of greenhouse gas emissions (Stocker et al., 2013). Each RCP sce- nario can result different future climatic patterns.
Urban areas closely interact with the atmosphere, where a modified local climate is formed. Understanding of the physics in the urban environment is not enough to have proper results, in addition to simu- late these modified climatological processes via numerical models two basic conditions must be also met. On the one hand, the spatial resolu- tion of the models should be able to reflect urban effects. On the other hand, the urban surface needs to be differentiated from natural land- scapes (Oke, Mills, Christen, & Voogt, 2017). Specific urban climate models (UCMs), e.g., MULKIMO_3 (Sievers, 1995), ENVI-met (Bruse &
Fleer, 1998), Town Energy Balance model (Masson, 2000) designed for urban areas are possibly the most accurate approaches for urban climate modelling because they are based on detailed conceptualisation of the urban surface (Hidalgo, Masson, Baklanov, Pigeon, & Gimeno, 2008). In the last decades there were rapid development in UCMs (Kusaka, Kondo, Kikegawa, & Kimura, 2001, Lee, Lee et al., 2016, Lemonsu, Masson, Shashua-Bar, Erell, & Pearlmutter, 2012, Martilli, Clappier, & Rotach,
* Corresponding author.
E-mail addresses: tgal@geo.u-szeged.hu (T. G´al), skarbitn@geo.u-szeged.hu (N. Skarbit), unger@geo.u-szeged.hu (J. Unger).
Contents lists available at ScienceDirect
Computers, Environment and Urban Systems
journal homepage: www.elsevier.com/locate/ceus
https://doi.org/10.1016/j.compenvurbsys.2021.101600
Received 1 April 2020; Received in revised form 15 January 2021; Accepted 15 January 2021
2002, Ryu, Bou-Zeid, Wang, & Smith, 2016, Wang, Bou-Zeid, & Smith, 2013, Yang et al., 2015). The reason for this fast development is partly connected to Weather Research and Forecasting model (WRF). For a more detailed presentation of UCMs connected to WRF and the perfor- mance of these methods in the same study area (see Moln´ar, Gy¨ongy¨osi,
& Gal, 2019a, 2019b; ´ Moln´ar, Kov´acs, & G´al, 2020). The above
mentioned methods except MUKLIMO_3 usually utilize the urban canyon concept, which is an accurate solution in dense urban areas.
However, in open built up types where urban canyons cannot be defined in an exact way this concept is less accurate.
To analyse the effects of climate change in urban areas, both the regional climate projections (e.g., PRUDENCE (Christensen & Chris- tensen, 2007); ENSEMBLES (Van der Linden & Mitchell, 2009); CORDEX (Giorgi, Jones, & Asrar, 2009; Jacob et al., 2014)) and UCMs are needed.
Regional climate projections are able to deliver climate data on a regional scale, whereas UCMs provide the climate modification by cities.
There are several approaches for surface parameterisations which are able to reflect the different effects of different surface units. About surface parametrisation the main question is the applied surface classi- fication. One of them is the Local Climate Zone (LCZ) scheme, which is a climate-based classification system of urban and rural sites (Stewart &
Oke, 2012). Each type of LCZ can be defined by its own geometric, surface cover, thermal, radiative and metabolic properties. In addition, they reflect accurately the thermal properties of each zones. Thereby, it is possible to use the LCZ scheme for surface input data for numerical modelling (Bokwa et al., 2019; Kwok et al., 2019; Moln´ar et al., 2019a;
Stewart & Oke, 2012; ˇZuvela-Aloise, 2017).
The altered climate by urban settlements effectively leading to excessive thermal modification in urban canopy layer and formatting the Urban Heat Island (UHI) (Oke et al., 2017). The UHI has an adverse effect on city dwellers in the warm seasons of the year, because it re- duces thermal comfort levels (at the early night hours) and increases costs of air conditioning (Buchholz & Kossmann, 2015). During extreme heat events, the heat load in cities unavoidably grows causing increased mortality due to heat stroke and hyperthermia (Bowler, Buyung-Ali, Knight, & Pullin, 2010; Lee, Mayer, & Chen, 2016; Loughner et al., 2012). Taking climate change into consideration, it is highly likely that summer temperatures in Europe will rise during the 21st century causing additional heat stress and declining thermal comfort levels, especially in cities (Skarbit & G´al, 2016; ˇZuvela-Aloise, Koch, Buchholz,
& Früh, 2016). Therefore, mitigation strategies are in the focus of
attention, because they may assist the city dwellers to achieve adequate thermal comfort conditions.
The role of urban blue and green spaces is systematically summa- rized in Yu et al., 2020. As a brief summery we present the main role of urban green spaces. Urban green sites help reduce high urban temper- atures by two key processes: evaporative cooling and shading (Shashua- Bar, Pearlmutter, & Erell, 2011). Human thermal perception below tree canopies is more favourable during warm, dry summer days, since trees absorb and reflect a considerable amount of incoming solar radiation (Bowler et al., 2010, Coutts, White, Tapper, Beringer, & Livesley, 2016, Song & Wang, 2015, Upreti, Wang, & Yang, 2017, Wang, Wang, Wang,
& Myint, 2019, Wang, Zhao, Yang, & Song, 2016). Nevertheless, in some
special cases green spaces can have a negative effect on heat load mitigation and human thermal comfort levels: at night the air tends to be warmer below the trees as a result of trapping the outgoing longwave radiation (Coutts et al., 2016) in addition the trees generate higher drag and block the ventilation. Apart from this, there is a general consensus that urban green environment promotes heat load mitigation (Bowler et al., 2010). The modelling of the effect of urban green spaces is an important question, some results are available from the recent years (e.
g. Koopmans, Ronda, Steeneveld, Holtslag, & Klein Tank, 2018).
As in the case of a Central-European city (Szeged, Hungary) a warming trend can be anticipated during the next decades (Bokwa et al., 2018; Skarbit & G´al, 2016), this paper concentrates on urban green spaces and their potential benefits in terms of heat load mitigation in the
recent and future daily and nocturnal thermal climate of the city by applying the MUKLIMO_3 microclimatic numerical model (Sievers, 1995). To analyse the cooling potential of different urban green spaces, the patterns of land-use classes in Szeged have been modified by developing new green spaces. Four cases have been examined: adding only dense trees, adding only scattered trees, adding only grasslands into the model domain and also adding mixed green infrastructure contain- ing all the above mentioned categories. Subsequently, the different future climate modifications caused by the altered land-use patterns have been evaluated and compared, as well as usable conclusions have been diagnosed.
The role of urban green spaces has importance in climate adaptation, therefore any additional information about this topic may assist to adopt to climate change. The development of urban climate models may rise a question. Is it possible to simulate the effect of urban green spaces in the present and future climates in order to facilitate climate adaptation actions? In summary, the objectives of this study are the following: i) to analyse and compare the different land-use modifications by additional typical green area setups to identify the possible way of enhancement of cooling potential in urban areas in case of present climate and as well as ii) in the frame of the future climate change. Finally, iii) to offer sug- gestions about general land-use modifications in favor of climate change adaptation and mitigation.
2. Study area
Szeged (46.25◦N, 20.15◦E) is located in Central Europe, more pre- cisely in the southeast of Hungary on a flat terrain with an average altitude of 80 m above sea level (Fig. 1). The city is medium-sized and has around 160,000 inhabitants. According to Koppen climate classifi-¨ cation system, Szeged is in the climatic region of Cfa characterised by a warm and humid temperate climate with a relatively warm summer and no distinguishable dry season (Beck et al., 2018). The urbanized area encompasses approx. 40 km2 (Skarbit & G´al, 2016). River Tisza crosses the city from the northeast and divides it into two parts. The road network of the city is a simple avenue-boulevard system.
3. Data and methods
3.1. Recent land-use classes and greening scenarios
The LCZ system by Stewart & Oke (2012) is able to objectively categorise different land-use areas. The system comprises 17 LCZ types which can be divided into 10 built types (LCZ 1-10) and 7 land-cover types (LCZ A-G). The determination of the LCZ map of Szeged with a spatial resolution of 100 m based on a WUDAPT method (Bechtel et al., 2016, 2019) described in Skarbit & G´al (2016) (Fig. 1). According to this map the city centre mainly consists of compact midrise and compact low-rise LCZs (2 and 3). Open midrise (residential buildings built be- tween 1960 and 1985, LCZ 5) can be found north and south of the downtown. Open low-rise (LCZ 6) and sparsely built (LCZ 9) classes (i.e.
family houses) occupy large areas south, north and northeast of the city centre. Relatively broad area covered by large low-rise (LCZ 8) class in the northwest. Around Szeged, the prevailing land-use types are bare soil (LCZ F) and low plants (LCZ D). These LCZ classes were used as input land-use data for the MUKLIMO_3 simulations (see Section 3.2).
As the focus has been on the relationship between urban green infrastructure and heat load mitigation, different land-use data were used as input to simulate the thermal effects of different combinations of urban green sites. For this purpose, four distinct scenarios/cases have been created. In all cases, the extent of the green spaces has been raised both around and within the city (Fig. 2). Around the city, the existing greenery has been significantly extended. Within the city, a few new green spaces were added; moreover in some cases the existing green sites have been extended as well. Along the river Tisza new green spaces were added too. As a result, a large non-constant ring of greenery has been
created around the city and some green patches varying in size have been scattered within the city. The placements of the added green sites were identical in all cases, only the type of the vegetation infrastructure differed.
In case A the role of dense trees was evaluated by introducing additional LCZ A patches in the model domain (Fig. 2a). In case B the thermal effect of scattered trees was simulated by adding new LCZ B patches (Fig. 2b). In case C the role of grasslands was measured by adding new LCZ D into the domain (Fig. 2c). In case D a mixture of green spaces was added into the land-use input file from all the above mentioned categories (i.e. dense trees, scattered trees and low plants) (Fig. 2d). This scenario can be considered as a control simulation of the green sites fitting the most to the reality as in city-scale it is very unre- alistic to introduce only one type of green infrastructure.
3.2. Urban climate modelling, climate indices
The model simulations on urban scale for this study were carried out with MUKLIMO_3 microclimatic model (Sievers, 1995). It is a non- hydrostatic model based on the RANS method (Früh et al., 2011). The turbulence processes within the model are parameterised (ˇZuvela- Aloise, 2017). The model is able to simulate atmospheric flow fields in the presence of buildings, in addition it is able to provide atmospheric data (e.g. temperature fields) on a high spatial resolution which is mandatory for urban climate analysis. It includes prognostic equations for air temperature and humidity, balanced heat and moisture budgets in the soil and a vegetation model as well as parameterisations of shortwave and longwave radiation and the effect of clouds, although cloud processes and precipitation is not built in the model. Therefore, the simulations are carried out for ideal days with no precipitation.
Furthermore, the model contains the reflection, the absorption and the emission of the radiation by buildings and by the soil (Früh et al., 2011).
One of the most important advantage of the model that it is able to handle properly the interactions between buildings and the atmosphere by applying the parameterisation of unresolved built-up. This means that the buildings are resolved vertically but not horizontally. For this purpose three statistical parameters are needed to be described in a grid cell: the building density, the wall area of buildings per grid volume and the mean height. In reality, buildings vary significantly within a grid cell of 50–100 m horizontal resolution, therefore, MUKLIMO_3 allows a secondary building class to be described (Früh et al., 2011). The parameterisation of the airflow in the unresolved built-up is based on the approach of Gross (1989). This approach uses the similarity of the airflow between buildings and the flow of a fluid in a porous medium.
Since the model calculates for a limited volume of the atmosphere, it needs initial and boundary conditions (Früh et al., 2011). Therefore, the model first computes a 1D-profile which includes the daily cycle of temperature, relative humidity and wind for the reference station outside the urban area. The initial meteorological conditions for the 1D- profile are usually taken from observations. The obtained 1D-profile provides the upper boundary conditions for the whole duration of the 3D-model run. Sievers (2016) presents the detailed model characteris- tics, including the planetary boundary layer scheme. MUKLIMO_3 uses the 1D profile as a driving model for the 3D calculations, therefore the model takes into consideration the boundary conditions through this profile. This concept helps to avoid the effect of the horizontal resolution on the effectiveness of the selected planetary boundary scheme. When the values of air temperature, relative humidity and wind from the 1D- simulations are computed, the 3D-simulations can be commenced (Zuvela-Aloise, 2017). The lateral boundary conditions are derived from ˇ a sequence of simulations at the edges (Früh et al., 2011). Because of the high computational requirement, the 3D-simulations are mostly run for a 24-h period. The outputs of the 3D-simulations are meteorological fields containing air temperature, relative humidity and airflow (Zuvela- ˇ Fig. 1. Location of the study area and its land-use classes based on the LCZ classification (the model domain is marked with a black frame).
Aloise, 2017). The temperature in the first layer represents the canopy temperature.
The basic information about the applied model setup is the following. Horizontal resolution is 100 m and the model domain is 20 × 17 km. The model has 47 levels and the vertical resolution varies from 10 m to 100 m from the surface. The model has several inputs including digital elevation model, surface classification (LCZ) and parameters for each surface types. For more details of the model setup see Bokwa et al.
(2019) where the same setup was applied for different analysis.
The cuboid method, which is a practical interpolation technique, is able to calculate climate indicies for 30-year periods without enormous computational efforts (Früh et al., 2011), by only 16 daily MUKLIMO_3 simulations, which represent the 8 corners of the cuboid for 2 prevailing wind direction (Fig. 3.). In the case of urban heat load, it is assumed that only the 2 m air temperature, the 2 m relative humidity and the 10 m wind velocity are the contributing factors. Using this assumption is not applicable in case of exact calculation of heat load but it is necessary and sufficient to identify the weather situations when high heat load could occur. The range of the parameters producing heat load can be limited by the minimum and the maximum daily mean values (Tmin, Tmax, rhmin, rhmax, umin, umax) and these variables can be placed at the corners of the cuboid representing the 8 fixed points which are needed for the
Fig. 2. Cases of modified land-use classes of Szeged using the LCZ classification (a – case A =dense trees, b – case B =scattered trees, c – case C =grasslands, d – case D =mixture of green spaces). (For interpretation of the references to colour in this figure legend, the reader is referred to the web version of this article.)
Fig. 3.Scheme of the cuboid where T (air temperature), rh (relative humidity) and u (mean wind speed) are representing the dimensions of the cuboid (Früh et al., 2011).
MUKLIMO_3 simulations (Fig. 3). The simulations can be used for trilinear interpolation for air temperature, relative humidity and wind velocity for a given day with a given parameters (T, rh, u) within the cuboid area. It is important to emphasize that it is a major advantage that the modelling system use only 16 microscale MUKLIMO_3 simula- tions to calculate summer heat load for a 30-year period. Thus, it is not necessary to simulate daily temperature cycles for a 30-year period, because the simulations are carried out for a limited number of weather situations when heat load can be a possible outcome. Using this concept may help to dramatically decrease the simulation time. Thenceforth, daily and nocturnal climate indices (see below) are calculated by a tri- linear interpolation of the simulated fields (ˇZuvela-Aloise, 2017).
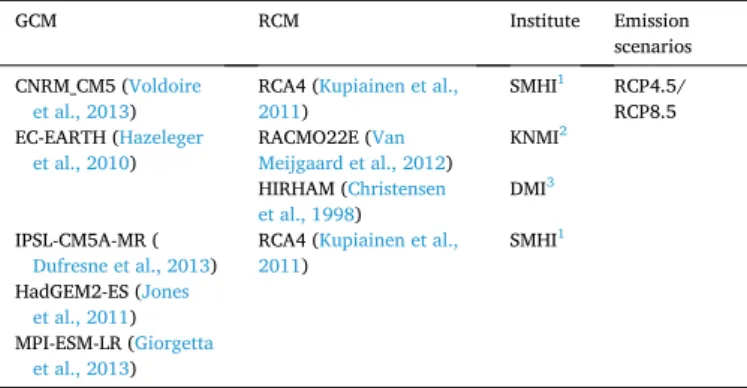
The cuboid method needs, beside the output fields of MUKLIMO_3 climate input data for a reference station to calculate climate indices. In this study for future simulations, regional climate projections were employed as input data (air temperature, relative humidity, wind speed and direction) from the EURO-CORDEX projections (Jacob et al., 2014) with 0.11◦ spatial resolution. Results from 5 different GCMs and 3 different RCMs (Table 1) resulting 14 different simulations based on RCP4.5 and RCP8.5 scenarios were used. It should be noted that RCP4.5 is a less pessimistic scenario compared to RCP8.5, which predicts rising radiative forcing by 2100 with no stabilisation (Stocker et al., 2013).
The results from the different simulations bias corrected to provide more reliable data.
In this study, the annual number of tropical nights and hot days were taken into account as these climate indices measuring the urban heat load at night and in the daytime, respectively. These are not thermal comfort parameters, however these indices are represent the weather situations when high heat stress and discomfort could occur. The defi- nition of the tropical night is a day when the Tmin is at least 20 ◦C. A hot day is when the Tmax equals or exceeds 30 ◦C (G´al & Skarbit, 2016). The number of the indices were calculated for all land-use scenarios both for the present and for the future. In the case of Szeged, the northwest and the northeast directions were selected as prevailing wind directions (based on the data of WMO station 12982).
4. Results
4.1. Evaluation and comparison of cooling potential of the different land- use changes by additional greenings in the present
Simulations for the original land use (Fig. 1) between 1981 and 2010 can be followed in Fig. 4. In this period, the number of hot days exceeds 30 days in the city centre (Fig. 4a). Close to the centre (LCZs 2 and 3) and
both in the north (LCZ 5) and northwest of the city (LCZ 8), there are 20–25 hot days per a year while in the suburbs there are only 10 to 20. In large urban parks and forests the values are below 10 days. The spatial distribution of the nighttime index shows a similar pattern (Fig. 4b), as the number of tropical nights exceeds 15 in the city centre, and over 10 close to it. In the suburbs this index is between 1 and 5 leading to the statement that this phenomenon is most frequent in the densely built-up areas.
In the following, the thermal effects of the different greening cases (A, B, C and D) are assessed for the present, first for the daytime climate index. The model results can be followed in Fig. 5. where the spatial distribution of the number of hot days is shown on the left. Whereas, on the right the difference between each cases and the original case is presented.
Comparing case A (dense trees) and the original case, the heat load reduction becomes evident (Fig. 5a–b). The highest differences (reduc- tion of 20 hot days) are in a large city park surrounded by LCZs 2 and 8.
In terms of scattered trees (case B), the reduction shows nearly the same pattern as in case A (dense trees) (Fig. 5c–d). However, the mag- nitudes are different. The highest reduction is 16 days in the same city park which was mentioned earlier. It is evident that heat stress mitiga- tion in the daytime in case B is a little bit weaker due to less continuous tree canopies and therefore more radiation income.
The outcomes of case C (grasslands) shows also heat load mitigation as cool spots are also observable in the city by day (Fig. 5e–f). The maximum reduction is equal with case B (16 hot days). Nevertheless, the warming in some areas also appears because of the land-cover changes.
In the original case, these areas were classified as LCZs A and B which are modified in terms of creating uniform grasslands with no trees in case C.
Fig. 5g–h present the results of the control simulation (case D mixture of green spaces), when all types of the green spaces scattered in and around the city. The results suggest the presence of local cool islands meaning that heat stress reduction is substantially. The decrease in heat load occurs mainly in the proximity of the green sites. The difference in the number of hot days is between − 17 and +2. The positive change is due to the above mentioned effect of land-cover change.
So it can be stated that the heat load substantially decreases in the vicinity of urban green spaces by day. The number of hot days becomes reduced in all of the green sites during this simulated period, so they act as local cool islands. Their cooling effect is limited in size, because it is mostly observable within the green spaces.
The model results for the nighttime index are presented in Fig. 6. In case A (dense trees), the changes are twofold (Fig. 6a–b). On the one hand, cooling is noticeable in almost the whole city. On the other hand, slight warming can be seen in the northern and the southern parts which is certainly a consequence of the land-cover changes. Originally, bare soil, low plants and scattered trees were changed to dense trees around the sparsely built areas. These original land-use zones facilitate night- time longwave cooling and even able to adopt the cooler air from rural sites and the applied change to dense trees block these positive effect not only in the green area but the nearby sparsely built area too. Within the city, the added urban parks are seem to be cooler, possibly due to the role of evapotranspiration and having better thermal properties. If we consider only the urban parks in the centre, where the original land-use contents different built-up classes, it can be stated that dense trees are effective at alleviating heat load. The highest reduction of tropical nights (− 5) can be found in the same urban park as in the case of hot days.
The number of tropical nights in case B (scattered trees) points out almost the same spatial distribution of heat stress (Fig. 6c–d). In this case cooling reaches nearly the same rate as in case A (maximum reduction of 5 nights). Negligible warming is detectable in the same parts and for the same reason as it is in case A.
The changes in the nighttime index are also clear in case of grass- lands (Fig. 6e–f). Here, the maximum reduction of tropical nights is 4 in a large urban park near the centre (i.e. which was mentioned so far), which is significantly lower compared to case A, in spite of having Table 1
Applied EURO-CORDEX simulations containing information about the driving global GCMs, the RCMs, the developing institutes and the RCP emission scenarios.
GCM RCM Institute Emission
scenarios CNRM_CM5 (Voldoire
et al., 2013) RCA4 (Kupiainen et al.,
2011) SMHI1 RCP4.5/
RCP8.5 EC-EARTH (Hazeleger
et al., 2010) RACMO22E (Van
Meijgaard et al., 2012) KNMI2 HIRHAM (Christensen
et al., 1998) DMI3
IPSL-CM5A-MR (
Dufresne et al., 2013) RCA4 (Kupiainen et al.,
2011) SMHI1
HadGEM2-ES (Jones et al., 2011) MPI-ESM-LR (Giorgetta
et al., 2013)
1Swedish Meteorological and Hydrological Institute.
2Koninklijk Nederlands Meteorologisch Instituut (Royal Netherlands Meteo- rological Institute).
3Danmarks Meteorologiske Institut (Danish Meteorological Institute).
enhanced longwave cooling. What is more, warming can be observed in the central, in the western, and in the northern parts where the original LCZ classes were dense and scattered trees. Being aware of this fact, it is possible that the soil beneath low plants receives a surplus of heat during daytime and this slightly warms the environment at night. The number of tropical nights also decreases in case D (mixture of green spaces) (Fig. 6g–h), but the difference is not as large as in the case of hot days (maximum difference is − 5).
In summary, it can be stated that newly added urban green spaces are remarkably effective at reducing heat load based on the MUKLIMO_3 simulations. It is essential to note that their cooling effect is more sig- nificant during daytime. Nevertheless, the extension of cooling is limited, because it is mostly observable inside and in the narrow sur- roundings of the green areas. It is also clear that the larger the green site within the compact parts of the city, the cooler is the environment.
Analyzing the different combinations of the green infrastructure, it is evident that there are differences between the cases as areas with dense trees are by far the most effective at cooling for their environment by day. At night the surrounding ring of forests is slightly warmer possibly due to the trapping of longwave radiation and obstructing ventilation.
Therefore, it can be declared that large areas of dense vegetation around the city somewhat worsen the thermal comfort. At the same time, smaller urban parks scattered in the city shows the highest reduction of heat load when they are covered with dense trees. Grasslands are found to be moderate heat load reducers both by day and at night. Mixed vegetation, which means a situation closer to reality, also supports the cooling potential of the vegetated areas.
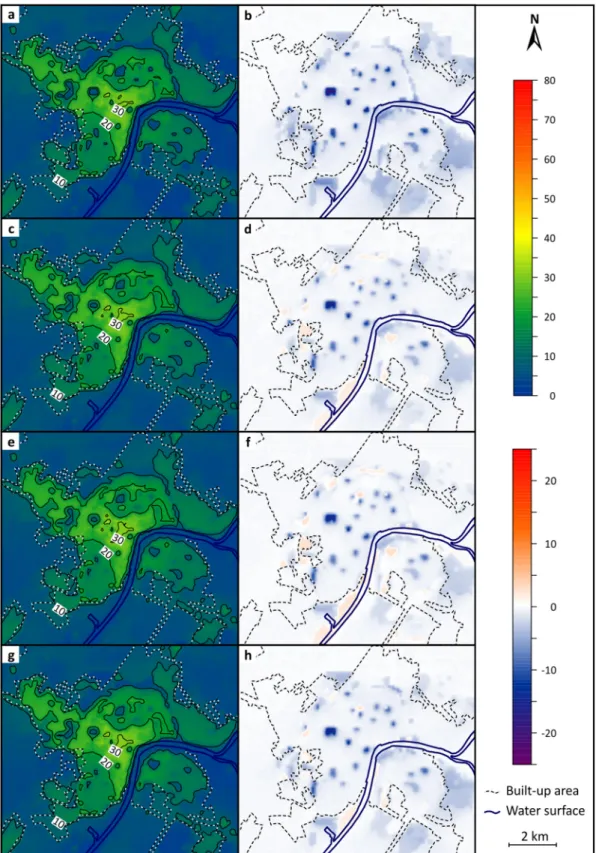
4.2. Analysis of the cooling potential of land-use changes in the future It is also essential to examine whether the magnitude of the climatic effects of the green infrastructure varies with climate change. Fig. 7 presents the differences of the number of hot days and tropical nights between the land-use scenarios (cases A to D) and the original case for the period of 2071–2100 based on RCP8.5 scenario. This period was selected with the most pessimistic emission scenario, because the dif- ferences are proved to be by far the largest. The evaluation of the different combinations of the green spaces is shown separately.
In case A (dense trees), the cooling effect is noticeably prominent caused by the added greenery. Despite the fact that the number of hot
days rises at the green sites, the differences between case A and the original case increases as well (Fig. 7a). Between 2071 and 2100 the maximum reduction reaches 30 days a year according to RCP8.5. Based on this fact, it can be anticipated that climate change will amplify the thermal differences between the built-up and vegetated areas. In the case of tropical nights (Fig. 7a), the differences increase with time. By the end of the century the maximum reduction is 8 nights and the maximum increment is 5 nights. All in all, dense trees become more effective at cooling by day with time. At night, smaller urban parks stay cooler, but the surrounding forests experience larger number of tropical nights by the end of the 21st century. It is also important to note that the spatial extension of cooling rises with time both in the daytime and at night.
The results of case B (scattered trees) show a clear heat load reduc- tion both for the night and day. The maximum reduction of hot days reaches 24 based on RCP8.5 (Fig. 7c). In case of the nighttime index, by the end of the 21st century, green spaces near the downtown experiences 8 less tropical nights, whereas the surrounding large groves experience 2 more a year (Fig. 7d). Comparing the results to case A, it can be stated that scattered trees cools the environment more moderately in the daytime, while at night these sites can be more effective at cooling, since the nocturnal warming remains bearable at the surrounding groves. It is also worth mentioning that the spatial extension of cooling enhances with time, but remains subtle.
The outcomes of case C (grasslands) show that the intensity of the cooling effect of the green spaces in the daytime is more or less equal compared to case B (Fig. 7e). This is due to the relatively large openness of scattered trees. The decrease in the nighttime index enhances with time, however the further reduction by the end of the century is rather moderate (maximum reduction of 6 nights) (Fig. 7f). The cooling effect of grasslands is stronger than any other greening scenarios due to its openness and radiative cooling.
The results for future climate related to case D (mixture of green spaces) show that the pattern of hot days is comparable to case B (scattered trees), and the magnitudes are also very similar (Fig. 7g). The coolest sites within the city are the large urban parks comprising of dense and scattered trees. The number of tropical nights also shows a similar spatial distribution compared to case of B (Fig. 7h). The coolest site is a large urban park with scattered trees coverage. At night the warming of the surrounding dense vegetation is noticeable; however the Fig. 4. Patterns of annual number of hot days (a) and tropical nights (b) in the original land use case (1981–2010).
maximum difference is +2 tropical nights.
The model simulations for the original land-use showed growing trend in heat stress occurrence both in the daytime and at night. It was also found that climate change strengthens the existing differences be- tween the vegetated and built-up areas. The different configurations of urban vegetation (scenarios A to D) are compared to each other by Table 2. It enabled us to make precious statements about the model results, because it compares the 4 cases in terms of the maximum
reduction of the applied climate indices and their relative cooling potential.
In all cases, it was found that urban green spaces effectively cool the environment and the heat stress reduction will become more important in the future, because the magnitudes of heat stress mitigation increase (both in the daytime and at night). It is also worth mentioning that the spatial extension of cooling increases by time, especially in the case of grasslands at night.
Fig. 5.Patterns of annual number of hot days in case of different scenarios (left) and the difference between the scenarios and the original case (1981–2010) (right).
Based on Table 2, it is clear that the dense vegetation is very effective at cooling the environment in the daytime. This efficiency becomes more significant in the future simulations. However, at night warming is observable in large forests near the city. Apart from this, the cooling potential of dense trees is remarkable, especially close to the densely built parts. It has to be noted that huge dense tree areas especially near to the edge of urban area could increase the night time temperature in
the inner parts of the city (due to the blocking the cool air inflow into the city), therefore the location of the dense trees in climate adaptation strategies has to be wisely planned using model simulations in the given area. Scattered trees are also proved to be effective climate modifiers, although the magnitudes are lower compared to dense trees. The induced nocturnal warming by scattered trees was found to be lower compared to dense trees. Grasslands experience lower levels of heat load Fig. 6. Patterns of annual number of tropical nights in case of the different scenarios (left) and the difference between the scenarios and the original case (1981–2010) (right).
reduction, therefore it can be stated that they are not so effective tools for the heat load mitigation. In the case of mixed vegetation, cooling is similar to scattered trees, but lower than in the case of dense trees.
5. Conclusions
In this paper, a modelling study was presented for analyzing the heat
stress mitigation potential of different types of green spaces. The study applied the MULKIMO_3 Urban Climate Model (Sievers, 1995). The model was able to reflect microscale climatic effects of different types of land-use classes, therefore the role of different types of urban green spaces could be analysed.
The presented comparison of the effect of main urban green area types may help to select the potential urban green area planning steps, Fig. 7. Patterns of differences between the annual number of hot days (left) and tropical nights (right) in cases of land-use scenarios and the original case in the period of 2071–2100 based on RCP8.5.
however these results cannot provide solution for any planning cases. In a certain situation, detailed numerical modelling analyses could help to evaluate the current green area planning actions. The presented nu- merical modelling methodology could be a suitable choice for these more detailed and site-specific analyses.
About the precision of modelling approach several factors could be evaluated. As the model resolution is 100 m and the model handles precisely the advective effects. Therefore, this approach is reliable in evaluation of the effect of several hundreds of meter sized urban green areas. Another question is the effect of land use change on climate prediction. The concept of this model does not support the precise modelling of land use change since this alteration of the urban area is somewhat continuous and the model has to use the same land use in- formation for long time period or at least for 30 years. This could be a major limitation, however, the uncertainty of future land use changes may make these aspects of modelling concept less problematic. The last part is the core precision of the numerical model. This question is exhaustively evaluated in case of the same basic model setup and the same area in Bokwa et al. (2019). Based on these results the model precisely catches the nocturnal temperature behavior of urban areas and there are some error in case of daytime hours, however if we compare two different urban structure in the same area and weather conditions, the main trends are not effected with these minor model errors.
Bowler et al. (2010) and Yu et al. (2020) present detailed overviews of the cooling effect of urban green spaces. Based on these studies the focus is on the radiative cooling and increased transpiration. Our results give additional information to this general view namely the dual response (daytime, nocturnal) for these land-use changes and the effect of vegetation on ventilation. Our results show that the best solution for the mitigation of daytime heat load (Dense trees scenario) has a con- tradictory effect in case of nocturnal cooling efficiency. Our findings also highlight that it is important to simultaneously evaluate the daytime and nocturnal cooling potential because a different green area setup would be more advantageous (Scattered trees scenario). The other key finding is about the urban ventilation, namely the placement of urban green
area (e.g. Dense trees scenario) not only effects the cooling but also the wind field because of the enhanced drag, and in case of nocturnal hours it may lead to less effective urban ventilation and higher heat load around the newly added dense trees. It draws the attention that the ef- fect of urban vegetation on drag and ventilation is also an important aspect of planning issues.
There is a general consensus that urban green infrastructure has favourable climatic effects, particularly in the summer season. It also should be stated that urban green spaces facilitate alleviating heat load.
In the future, it is anticipated that the frequency of heat stress will grow.
Hence, urban planners should definitely deal with this crucial issue, because the wellbeing of urban dwellers is necessary for sustaining an adequate city life. Urban green spaces have the potential to cool the environment and to form appropriate human thermal comfort conditions.
Based on the findings, it is recommended for urban planners to in- crease the number of green sites in cities, because their great cooling efficiency could facilitate heat load reduction, especially in the future, when the frequency of heat events will be increased. However, we would not recommend increasing the extension of large dense forests around compact areas, because they are likely to hinder the penetration of the cool air from the countryside towards the city.
Acknowledgement
This research has been supported by the National Research, Devel- opment and Innovation Office, Hungary (NKFI K-120346). We acknowledge the CORDEX project for producing and making available their model output and the Deutscher Wetterdienst (DWD) for making available the MUKLIMO_3 model.
References
Arnfield, A. J. (2003). Two decades of urban climate research: A review of turbulence, exchanges of energy and water, and the urban heat island. International Journal of Climatology, 23, 1–26. https://doi.org/10.1002/joc.859.
Bader, D. C., Covey, C., Gutowski, W. J., Jr., Held, I. M., Miller, R. L., Tokmakian, R. T., &
Zhang, M. H. (2008). Climate models. An assessment of strengths and limitations. In Synthesis and assessment product 3.1, report by the u.s. climate change science program and the subcommittee on global change research. Washington, D.C., USA: Department of Energy, Office of Biological and Environmental Research (124 pp.).
Bechtel, B., Alexander, P. J., Beck, C., B¨ohner, J., Brousse, O., Ching, J., … Hoffmann, P.
(2019). Generating WUDAPT level 0 data–current status of production and evaluation. Urban Climate, 27, 24–45. https://doi.org/10.1016/j.uclim.2018.10.001.
Bechtel, B., Pesaresi, M., See, L., Mills, G., Ching, J., Alexander, P. J., … Stewart, I.
(2016). Towards consistent mapping of urban structure-global human settlement layer and local climate zones. ISPRS-International Archives of the Photogrammetry, Remote Sensing and Spatial Information Sciences, 41, 1371–1378. https://doi.org/
10.5194/isprsarchives-XLI-B8-1371-2016.
Beck, H. E., Zimmermann, N. E., McVicar, T. R., Vergopolan, N., Berg, A., & Wood, E. F.
(2018). Present and future K¨oppen-Geiger climate classification maps at 1-km resolution. Scientific Data, 5, 180214. https://doi.org/10.1038/sdata.2018.214.
Bokwa, A., Dobrovolný, P., G´al, T., Geletiˇc, J., Guly´as, A., Hajto, M. J., … ´ ˇZuvela- Aloise, M. (2018). Urban climate in central European cities and global climate change. Acta Climatologica, 51− 52, 7–35. https://doi.org/10.14232/acta.
clim.2018.52.1.
Bokwa, A., Geletiˇc, J., Lehnert, M., ˇZuvela-Aloise, M., Holl´osi, B., G´al, T., … Walawender, J. P. (2019). Heat load assessment in central European cities using an urban climate model and observational monitoring data. Energy and Buildings, 201, 53–69. https://doi.org/10.1016/j.enbuild.2019.07.023.
Bowler, D. E., Buyung-Ali, L., Knight, T. M., & Pullin, A. S. (2010). Urban greening to cool towns and cities: A systematic review of the empirical evidence. Landscape and Urban Planning, 97, 147–155. https://doi.org/10.1016/j.landurbplan.2010.05.006.
Bruse, M., & Fleer, H. (1998). Simulating surface–plant–air interactions inside urban environments with a three dimensional numerical model. Environmental Modelling &
Software, 13, 373–384. https://doi.org/10.1016/S1364-8152(98)00042-5.
Buchholz, S., & Kossmann, M. (2015). Visualisation of summer heat intensity for different settlement types and varying surface fraction partitioning. Landscape and Urban Planning, 144, 59–64. https://doi.org/10.1016/j.
landurbplan.2015.08.0020169-2046.
Christensen, J. H., & Christensen, O. B. (2007). A summary of the PRUDENCE model projections of changes in European climate by the end of this century. Climatic Change, 81, 7–30. https://doi.org/10.1007/s10584-006-9210-7.
Christensen, O. B., Christensen, J. H., Machenhauer, B., & Botzet, M. (1998). Very high- resolution regional climate simulations over Scandinavia—Present climate. Journal Table 2
Thermal effects of the different simulated cases including the relative cooling efficiencies (both for the day and night) as well as the number of the maximum reduction of hot days and tropical nights in the present (1981–2010) and in the simulated future periods (2021–2050 and 2071–2100) based on RCP8.5.
Period, climate
index Dense trees
(Case A) Scattered trees (Case B)
Grasslands (Case C) Mixed
vegetation (Case D) max. reduction of
hot days (1981–2010)
20 days 16 days 16 days 17 days
max. reduction of hot days (2021–2050;
RCP 8.5)
23 days 18 days 17 days 18 days
max. reduction of hot days (2071–2100;
RCP 8.5)
30 days 24 days 23 days 24 days
max. reduction of tropical nights (1981–2010)
5 nights 5 nights 4 nights 5 nights
max. reduction of tropical nights (2021–2050;
RCP 8.5)
6 nights 6 nights 4 nights 6 nights
max. reduction of tropical nights (2071–2100;
RCP 8.5)
8 nights 8 nights 6 nights 8 nights
Cooling efficiency
in the daytime Very high High Moderate High
Cooling efficiency
at night Contradictory High Moderate High
of Climate, 11, 3204–3229. https://doi.org/10.1175/1520-0442(1998)011<3204:
VHRRCS>2.0.CO;2.
Coutts, A. M., White, E. C., Tapper, N. J., Beringer, J., & Livesley, S. J. (2016).
Temperature and human thermal comfort effects of street trees across three contrasting street canyon environments. Theoretical and Applied Climatology, 124, 55–68. https://doi.org/10.1007/s00704-015-1409-y.
Dufresne, J. L., Foujols, M. A., Denvil, S., Caubel, A., Marti, O., Aumont, O., … Vuichard, N. (2013). Climate change projections using the IPSL-CM5 earth system model: From CMIP3 to CMIP5. Climate Dynamics, 40, 2123–2165. https://doi.org/
10.1007/s00382-012-1636-1.
Früh, B., Becker, P., Deutschlander, T., Hessel, J. D., Kossmann, M., Mieskes, I., … ¨ Wienert, U. (2011). Estimation of climate-change impacts on the urban heat load using an urban climate model and regional climate projections. Journal of Applied Meteorology and Climatology, 50, 167–184. https://doi.org/10.1175/
2010JAMC2377.1.
Giorgetta, M. A., Jungclaus, J., Reick, C. H., Legutke, S., Bader, J., Bottinger, M., … Karl- ¨ H. Wieners, Martin Claussen, Jochem Marotzke, & Stevens, B.. (2013). Climate and carbon cycle changes from 1850 to 2100 in MPI-ESM simulations for the coupled model intercomparison project phase 5. Journal of Advances in Modeling Earth Systems, 5, 572–597. https://doi.org/10.1002/jame.20038.
Giorgi, F., Jones, C., & Asrar, G. R. (2009). Addressing climate information needs at the regional level: The CORDEX framework. World Meteorological Organization Bulletin, 58(3), 175.
Gross, G. (1989). Numerical simulation of the nocturnal flow systems in the Freiburg area for different topographies. Beitr¨age zur Physik der Atmosph¨are, 62, 57–72.
Hazeleger, W., Severijns, C., Semmler, T., S¸tef˘anescu, S., Yang, S., Wang, X., … Will´en, U.
(2010). EC-earth: A seamless earth-system prediction approach in action. Bulletin of the American Meteorological Society, 91, 1357–1364. https://doi.org/10.1175/
2010BAMS2877.1.
Hidalgo, J., Masson, V., Baklanov, A., Pigeon, G., & Gimeno, L. (2008). Advances in urban climate modelling. Annals of the New York Academy of Sciences, 1146, 354–374. https://doi.org/10.1196/annals.1446.015.
Jacob, D., Petersen, J., Eggert, B., Alias, A., Christensen, O. B., Bouwer, L. M., … Georgopoulou, E. (2014). EURO-CORDEX: New high-resolution climate change projections for European impact research. Regional Environmental Change, 14(2), 563–578. https://doi.org/10.1007/s10113-014-0587-y.
Jones, C., Hughes, J. K., Bellouin, N., Hardiman, S. C., Jones, G. S., Knight, J., … Zerroukat, M. (2011). The HadGEM2-ES implementation of CMIP5 centennial simulations. Geoscientific Model Development, 4, 543–570. https://doi.org/10.5194/
gmd-4-543-2011.
Koopmans, S., Ronda, R., Steeneveld, G.-J., Holtslag, A. A., & Klein Tank, A. M. (2018).
Quantifying the effect of different urban planning strategies on heat stress for current and future climates in the agglomeration of the Hague (the Netherlands).
Atmosphere, 9, 353. https://doi.org/10.3390/atmos9090353.
Kupiainen, M., Samuelsson, P., Jones, C., Jansson, C., Will´en, U., Wang, S., & D¨oscher, R.
(2011). Rossby Centre regional atmospheric model, RCA4. Rossby Centre Newsletter https://www.smhi.se/en/research/research-departments/climate-research-ross by-centre2-552/rossby-centre-regional-atmospheric-model-rca4-1.16562.
Kusaka, H., Kondo, H., Kikegawa, Y., & Kimura, F. (2001). A simple single-layer urban canopy model for atmospheric models: Comparison with multi-layer and slab models. Boundary-Layer Meteorology, 101(3), 329–358. https://doi.org/10.1023/A:
1019207923078.
Kwok, Y. T., Schoetter, R., Lau, K. K.-L., Hidalgo, J., Ren, C., Pigeon, G., & Masson, V.
(2019). How well does the local climate zone scheme discern the thermal environment of Toulouse (France)? An analysis using numerical simulation data.
International Journal of Climatology, 39(14), 5292–5315. https://doi.org/10.1002/
joc.6140.
Lee, H., Mayer, H., & Chen, L. (2016). Contribution of trees and grasslands to the mitigation of human heat stress in a residential district of Freiburg, Southwest Germany. Landscape and Urban Planning, 148, 37–50. https://doi.org/10.1016/j.
landurbplan.2015.12.004.
Lee, S.-H., Lee, H., Park, S. B., Woo, J. W., Lee, D. I., & Baik, J. J. (2016). Impacts of in- canyon vegetation and canyon aspect ratio on the thermal environment of street canyons: Numerical investigation using a coupled WRF-VUCM model. Quarterly Journal of the Royal Meteorological Society, 142(699), 2562–2578. https://doi.org/
10.1002/qj.2847.
Lemonsu, A., Masson, V., Shashua-Bar, L., Erell, E., & Pearlmutter, D. (2012). Inclusion of vegetation in the town energy balance model for modelling urban green areas.
Geoscientific Model Development, 5(6), 1377–1393. https://doi.org/10.5194/gmd-5- 1377-2012.
Loughner, C. P., Allen, D. J., Zhang, D. L., Pickering, K. E., Dickerson, R. R., & Landry, L.
(2012). Roles of urban tree canopy and buildings in urban heat island effects:
Parametrization and preliminary results. Journal of Applied Meteorology and Climatology, 51, 1775–1793. https://doi.org/10.1175/JAMC-D-11-0228.1.
Martilli, A., Clappier, A., & Rotach, M. W. (2002). An urban surface exchange parameterisation for mesoscale models. Boundary-Layer Meteorology, 104(2), 261–304. https://doi.org/10.1023/A:1016099921195.
Masson, V. (2000). A physically-based scheme for the urban energy budget in atmospheric models. Boundary-Layer Meteorology, 94, 357–397.
McGregor, J. L. (1997). Regional climate modelling. Meteorology and Atmospheric Physics, 63, 105–117.
Moln´ar, G., Gy¨ongy¨osi, A. Z., & G´al, T. (2019a). Integration of an LCZ-based classification into WRF to assess the intra-urban temperature pattern under a heatwave period in Szeged, Hungary. Theoretical and Applied Climatology, 138(1–2), 1139–1158. https://
doi.org/10.1007/s00704-019-02881-1.
Moln´ar, G., Gy¨ongy¨osi, A. Z., & Gal, T. (2019b). Modeling of urban heat island using ´ adjusted static database. Id˝oj´ar´as, 123(3), 371–390.
Moln´ar, G., Kov´acs, A., & G´al, T. (2020). How does anthropogenic heating affect the thermal environment in a medium-sized Central European city? A case study in Szeged, Hungary. Urban Climate, 34, 100673. https://doi.org/10.1016/j.
uclim.2020.100673.
Oke, T. R., Mills, G., Christen, A., & Voogt, J. A. (2017). Urban Climates. Cambridge:
Cambridge University Press (523 pp.).
Ryu, Y. H., Bou-Zeid, E., Wang, Z.-H., & Smith, J. A. (2016). Realistic representation of urban trees in an urban canopy model. Boundary-Layer Meteorology, 159, 193–220.
https://doi.org/10.1007/s10546-015-0120-y.
Shashua-Bar, L., Pearlmutter, D., & Erell, E. (2011). The influence of trees and grass on outdoor thermal comfort in a hot-arid environment. International Journal of Climatology, 31, 1498–1506. https://doi.org/10.1002/joc.2177.
Sievers, U. (1995). Verallgemeinerung der Stromfunktionsmethode auf drei Dimensionen. Meteorologische Zeitschrift, 4, 3–15.
Sievers, U. (2016). Das kleinskalige Str¨omungsmodell MUKLIMO_3. Teil 2:
Thermodynamische Erweiterungen (p. 248). Berichte des Deutschen Wetterdienstes.
Skarbit, N., & G´al, T. (2016). Projection of intra-urban modification of night-time climate indices during the 21st century. Hungarian Geographical Bulletin, 65, 181–193.
https://doi.org/10.15201/hungeobull.65.2.8.
Song, J., & Wang, Z. H. (2015). Impacts of Mesic and xeric urban vegetation on outdoor thermal comfort and microclimate in Phoenix, AZ. Building and Environment, 94, 558–568. https://doi.org/10.1016/j.buildenv.2015.10.016.
Stewart, I. D., & Oke, T. R. (2012). Local climate zones for urban temperature studies.
Bulletin of the American Meteorological Society, 93, 1879–1900. https://doi.org/
10.1175/BAMS-D-11-00019.1.
Stocker, T. F., Qin, D., Plattner, G.-K., Tignor, M., Allen, S. K., Boschung, J., … Midgley, P. M. (2013). Climate change 2013: The physical science basis. Contribution of working group I to the fifth assessment report of the intergovernmental panel on climate change. Cambridge, United Kingdom and New York, NY, USA: Cambridge University Press.
United Nations, Department of Economic and Social Affairs, Population Division. (2019).
World urbanization prospects: The 2018 revision (ST/ESA/SER.A/420). New York:
United Nations.
Upreti, R., Wang, Z. H., & Yang, J. (2017). Radiative shading effect of urban trees on cooling the regional built environment. Urban Forestry & Urban Greening, 26, 18–24.
https://doi.org/10.1016/j.ufug.2017.05.008.
Van der Linden, P., & Mitchell, J. E. (2009). ENSEMBLES: Climate change and its impacts:
Summary of research and results from the ENSEMBLES project (p. 160). FitzRoy Road, Exeter EX1 3PB, UK: Met Office Hadley Centre.
Van Meijgaard, E., Van Ulft, L. H., Lenderink, G., De Roode, S. R., Wipfler, E. L., Boers, R., & van Timmermans, R. M. A. (2012). Refinement and application of a regional atmospheric model for climate scenario calculations of Western Europe. KVR 054/12. ISBN/EAN 978-90-8815-046-3. (44 pp.).
Voldoire, A., Sanchez-Gomez, E., y M´elia, D. S., Decharme, B., Cassou, C., S´en´esi, S., … Chauvin, F. (2013). The CNRM-CM5.1 global climate model: description and basic evaluation. Climate Dynamics, 40, 2091–2121. https://doi.org/10.1007/s00382-011- 1259-y.
Wang, C., Wang, Z. H., Wang, C., & Myint, S. W. (2019). Environmental cooling provided by urban trees under extreme heat and cold waves. Remote Sensing of Environment, 227, 28–43. https://doi.org/10.1016/j.rse.2019.03.024.
Wang, Z.-H., Bou-Zeid, E., & Smith, J. A. (2013). A coupled energy transport and hydrological model for urban canopies evaluated using a wireless sensor network.
Quarterly Journal of the Royal Meteorological Society, 139, 1643–1657. https://doi.
org/10.1002/qj.2032.
Wang, Z. H., Zhao, X., Yang, J., & Song, J. (2016). Cooling and energy saving potentials of shade trees and urban lawns in a desert city. Applied Energy, 161, 437–444.
https://doi.org/10.1016/j.apenergy.2015.10.047.
Yang, J., Wang, Z.-H., Chen, F., Miao, S., Tewari, M., Voogt, J., & Myint, S. W. (2015).
Enhancing hydrologic modeling in the coupled weather research and forecasting - urban modeling system. Boundary-Layer Meteorology, 155(1), 87–109. https://doi.
org/10.1007/s10546-014-9991-6.
Yu, Z., Yang, G., Zuo, S., Jørgensen, G., Koga, M., & Vejre, H. (2020). Critical review on the cooling effect of urban blue-green space: A threshold-size perspective. Urban Forestry & Urban Greening, 49, 126630. https://doi.org/10.1016/j.
ufug.2020.126630.
ˇZuvela-Aloise, M. (2017). Enhancement of urban heat load through social inequalities on an example of a fictional city King’s landing. International Journal of Biometeorology, 61, 527–539. https://doi.org/10.1007/s00484-016-1230-z.
ˇZuvela-Aloise, M., Koch, R., Buchholz, S., & Früh, B. (2016). Modelling the potential of green and blue infrastructure to reduce urban heat load in the city of Vienna.
Climatic Change, 135, 425–438. https://doi.org/10.1007/s10584-016-1596-2.