Introduction
Urbanisation has been witnessing an unprec- edented growth rate over the last decades. Ac- cording to the United Nations (2018), 55 per cent of the global population live in cities to- day, and urban ratio is expected to increase to 68 per cent by 2050 (UN 2018). (Over)urbanisa- tion creates many problems due to increasing density of people, widening social inequalities, limited access to public amenities, and rela-
tive disregard for environmental aspects which altogether threaten the liveability of cities. Ac- cording to the WHO (2017), green spaces and other nature-based solutions offer innovative approaches to increase the quality of urban set- tings, enhance local resilience, promote sus- tainable lifestyles, and improve both the health and the social well-being of residents.
Urban green spaces (UGS) comprise differ- ent types of vegetated spaces in urban areas, both natural and semi-natural, irrespective of
1 University of Debrecen, Faculty of Engineering, H-4028 Debrecen, Ótemető u. 2–4. Hungary. Corresponding author’s e-mail: csomos@eng.unideb.hu
2 Great Plain Research Institute, Centre for Economic and Regional Studies, H-6000 Kecskemét, Rákóczi út 3.
Hungary E-mail: farkas.jenozsolt@krtk.mta.hu
3 Geographical Institute, Research Centre for Astronomy and Earth Sciences, H-1112 Budapest, Budaörsi út 45.
E-mail: zkovacs@iif.hu; Department of Economic and Social Geography, University of Szeged, H-6722 Szeged, Egyetem u. 2. Hungary. E-mail: zkovacs@geo.u-szeged.hu
Access to urban green spaces and environmental inequality in post-socialist cities
György CSOMÓS1, Jenő Zsolt FARKAS2 and Zoltán KOVÁCS3
Abstract
Access to urban green spaces and environmental inequalities are increasingly on the agenda in contemporary cities due to increasing density of people, widening social inequalities, and limited access to Urban Green Spaces (UGS). This is even so in post-socialist cities where recent urban sprawl and suburbanisation could be strongly linked to the scarcity of adequate green spaces in the inner-parts of cities. This paper examines the provision and accessibility of public green spaces in Debrecen, a second tier city in post-socialist Hungary, with applying a walking distance approach. Using GIS technology and socio-demographic data of residents the study assesses the availability and accessibility of green spaces in the city, and their social equity. According to research results the geographical distribution of UGS is very uneven in the city, some neighbourhoods lack public green spaces, while others are well-supplied. This is partly due to the natural environment and the post-WWII development of the city. Research findings show that the quality of residential green spaces is generally poor or very poor. Research also confirmed the widening environmental inequalities within the local society. New upmarket residential areas, where the wealthiest section of population reside are rich in high-quality (private) green spaces. Other lower-status neighbourhoods, including some of the socialist hous- ing estates, suffer from the lack of good quality green spaces. Authors argue that environmental justice should be a core concept of city-planning considering not only the officially designated public green spaces, but also other forms of urban green (institutional, private etc.).
Keywords: urban green spaces, post-socialist city, accessibility, residential well-being, environmental inequality, environmental justice, fixed walking distance.
Received February 2020, Accepted June, 2020.
their size, ownership and function. The most typical forms are forests, public parks and gar- dens, institutional green spaces, playgrounds, sport fields, street trees, nature conservation areas, garden walls, cemeteries, but also com- munity and private gardens (Saelens, B.E.
and Handy, S.L. 2008; Wolch, J.R. et al. 2014;
Cvejić, R. et al. 2015). The magnitude of the positive environmental effects and the com- plexity of the ecosystem services provided by urban green spaces are highly influenced by their physical parameters (e.g. the size of the area, the dominant vegetation type), their basic functions (street trees, playgrounds, etc.) and geographical location within cities.
When considering the relevance of urban green for human well-being we should take into account both environmental and social effects. A growing body of literature suggests that UGS positively contribute to healthy envi- ronment in urban areas by improving air qual- ity and reducing the urban heat island effect (Yang, P. et al. 2016; Yu, Z. et al. 2018; Aram, F. et al. 2019). Green spaces absorb a signifi- cant amount of hazardous substances from the air as leaves act as a kind of natural filter. A United States study, as cited by Cicea, C. and Pîrlogea, C. (2011), estimated that dust levels in an urban park in the State of Georgia were 60 per cent lower than outside the park. In ad- dition, urban green spaces (primarily parks) contribute to the reduction of sound emission generated by road traffic (Brambilla, G. et al.
2013; Hong, J.Y. and Jeon, J.Y. 2013). UGS also have an important ecological role (Li, H. et al.
2015), as they contribute to biodiversity pres- ervation by providing habitats for great num- ber of plants and animals (Threlfall, C.G.
et al. 2017; Lv, Z. et al. 2019).
In addition, one of the most important ecosystem services of urban green spaces is that they provide recreational opportunities for residents, and facilitate social interaction and cohesion (Vargas-Hernández, J.G. et al.
2018; Biedenweg, K. et al. 2019; Iraegui, E.
et al. 2020). In our (over)urbanised world, the regular use of urban green spaces stimulates cognitive, emotional, and psycho-sociological benefits, contributing to the reduction of con-
stant stress and mental tiredness and the im- provement of attention and memory (Ulrich, R.S. et al. 1991; Hartig, T. et al. 2003; Berto, R.
2005; Berman, M.G. et al. 2008; Hedblom, M.
et al. 2019). Some urban green spaces, primar- ily parks, provide not only aesthetic experi- ence but also allow people to participate in sports and other physical activities, children to use playgrounds, and older people to re- lax. A large body of literature has highlighted the positive effects of green spaces for men- tal and physical health conditions (Bedimo- Rung, A.L. et al. 2005; Cohen, D.A. et al. 2007;
Kaczynski, A.T. and Henderson, K.A. 2007), enforcing healthy living and reducing the rate of chronic diseases and mortality (Wolch, J.R.
et al. 2014). By the beginning of the 21st centu- ry, the ecosystem services provided by UGS have become an extremely significant factor in the liveability of cities (McCormack, G.R.
et al. 2010; De Valck, J. et al. 2016; Larson, C.L. et al. 2018; Lu, Y. 2019) and a cornerstone of current urban planning debates (Haaland, C. and van den Bosch, C.K. 2015; Littke, H.
2015; Anguluri, R. and Narayanan, P. 2017).
Obviously, not every type of green space is capable of providing the above services and functions in a complex way, or even partially (Mexia, T. et al. 2018). For example, street trees are primarily responsible for providing shade and filtering air pollution and sound generat- ed by road traffic but are less suitable for pro- viding recreational opportunities, and a grass- covered green space is less effective at reduc- ing the urban heat island effect than a forest.
Planners strive to ensure urban green spaces that are capable of providing complex ecosys- tem services (Bolund, P. and Hunhammar, S.
1999; Xu, L. et al. 2016; Chang, J. et al. 2017).
Access to urban green is a key question when it comes residential well-being all over the world and it is even so in former state- socialist countries. New housing construction during state-socialism concentrated predomi- nantly in high-rise housing estates on empty spaces within city limits maintaining a com- pact urban form as opposed to capitalist cities (Sýkora, L. 2009). However, in the 1970s and 80s during the mass-production of uniform
pre-fab dwellings little attention was paid to the proper provision of infrastructure and ser- vices, including green spaces (Benkő, M. 2016).
After 1990 post-socialist urban transition could be characterized by dynamic changes of ur- ban spatial structure. The compact physical morphology of former socialist cities started to vanish quickly due to urban sprawl (Bičík, I. and Jeleček, L. 2009; Tammaru, T. et al. 2009;
Slaev, A.D. et al. 2018; Kovács, Z. et al. 2019).
Urban sprawl has been enabled by several factors, including the privatization of land, the decentralisation of planning rights, the increasing car ownership and the growing de- sire of people to live in single-family homes at peri-urban locations (Szemző, H. and Tosics, I. 2005; Pichler-Milanović, N. et al. 2008).
However, as recent findings of Koprowska, K. et al. (2020) demonstrated urban sprawl in post-socialist cities could also be strongly linked to the scarcity of adequate green spaces in the inner-parts of cities. Hence, if post-so- cialist cities want to successfully cope with ur- ban sprawl, planners and city administrators should pay more attention to the development of urban green spaces.
The aim of this paper is to examine the ac- cessibility of public green spaces in Debrecen, the second largest city in Hungary with over 200 thousand inhabitants, by employing a walking distance approach. The main aim is to analyse the availability and accessibility of the city’s public and other green spaces, and to assess their social equity. The specific objectives of the research are as follows:
Firstly, we want to define the UGS of the city, with special attention to residential and institutional green spaces that are not de- fined as ‘public green spaces’ by the Zoning Plan of the city, although, regarding their physical appearance and services they can be considered equivalent to public green spaces.
Secondly, we would like to analyse the ac- cessibility of urban green spaces (including residential and institutional green spaces) by the walking distance approach.
Thirdly, we aim to analyse the socio-eco- nomic and demographic profile of residents living in the catchment areas of green spaces.
Accessibility of urban green spaces:
a literature review
The importance of urban green spaces and their accessibility has been widely recognised by researchers, urban planners and decision- makers (EC−UN-Habitat 2016; Poelman, H.
2016; Kolcsár, R.A. and Szilassi, P. 2017).
Next to the general access to urban green spaces a growing body of literature inves- tigates the question whether urban green is equitably distributed in relation to socio-eco- nomic status of residents. Thus, the provision of urban green is increasingly recognised as an environmental justice issue which has necessarily brought about the refinement of methodology (Wolch, J.R. et al. 2014).
There are several approaches to measure accessibility of urban green. One of the most popular accessibility models is based upon the fixed distance approach, which adopts a fixed distance from assumed origins and counts the number of destinations that can be reached (Reyes, M. et al. 2014). To express accessibility more adequately, it is neces- sary to transform walking time into walking distance. For instance, Smoyer-Tomic, K.E.
et al. (2004), Hoffimann, E. et al. (2017), and Wei, F. (2017) employed a walking distance of 800 metres as the equivalent of 10 minutes walking time. In contrast, Barbosa, O. et al.
(2007) adopted the recommendation of the European Environment Agency (EEA) ac- cording to which green spaces should be ac- cessible within 15 minutes walking time, and applied walking distance thresholds of 300 and 900 metres. Moreover, the WHO recom- mends that green spaces should be located within 5 minutes walking time, that is, within a walking distance of 300 metres (WHO 2017).
The same distance appears in the Accessible Natural Green Space Standard (ANGSt) being applied in the United Kingdom. The ANGSt suggests that public parks lying within a walking distance of 300 metres must have at least 2 hectares in terms of area (the larger the park in terms of area, the longer the walking distance can be) (Balfour, R. and Allen, J. 2014). Similarly,
Cömertler, S. (2017) investigated the green infrastructure of European capital cities by using an accessibility distance of 300 metres, and Grunewald, K. et al. (2017) employed two specific distances based on different approaches: a straight-line distance of 300 metres and a path distance of 500 metres.
Boone, C.G. et al. (2009) used a walking dis- tance of 400 metres to determine park ac- cessibility when exploring environmental justice in Baltimore, Maryland. Iraegui, E.
et al. (2020) argue that the size of green space matters when measuring its capability to host adult physical activity, therefore, they pro- pose 5 hierarchical categories according to the functional level, maximum walking dis- tance and minimum size of UGS.
Chen, J. and Chang, Z. (2015) cited the Hong Kong Planning Standards and Guidelines published by the Hong Kong Planning Department, which recommends that local open spaces should be located within a short walking distance from the residents, preferably within a radius of fewer than 500 metres. To investigate envi- ronmental justice in different geographical environments, De Sousa Silva, C. et al. (2018) chose two contrasting cities as case studies:
a post-communist city (Tartu, Estonia) and a Mediterranean city (Faro, Portugal). When outlining the buffer zone of those cities, walking distances of 300 metres (i.e. a walk- ing time of 4 minutes) and 500 metres (i.e.
a walking time of 7 minutes) were applied.
Schipperijn, J. et al. (2010) carried out a sur- vey to obtain information on the relative im- portance of factors influencing park users in Odense, Denmark, and they chose 600 metres to be a reasonable accessibility distance.
Kaczynski, A.T. et al. (2009) investigated how the number and the size of parks within 1,000 metres from residents’ homes as well as distance to the closest park are associated with moderate-to-strenuous physical activ- ity. Similarly, Paquet, C. et al. (2013) used a walking distance of 1,000 metres to examine the accessibility of green spaces, and in their opinion this distance equates to an estimat- ed walking time of 12 minutes (at a walking
pace of approximately 5 km/h). Furthermore, Lu, Y. (2018) applied a buffer zone with a radius of 1,000 metres to reveal the connec- tion between street greenery and physical activity. In contrast, Dempsey, S. et al. (2018) investigated the relationship between green space accessibility and obesity in older peo- ple and chose 1,600 metres as a reasonable walking distance (associated with a walking time of 20 minutes). In their pioneering work Wüstemann, H. et al. (2017) defined “walking distance” as a maximum distance of 500 m in their analysis on access to urban green spaces and environmental inequalities in German major cities by merging geo-coded house- hold data from the German Socio-Economic Panel (GSOEP) and Population Census Data with land use data from European Urban Atlas. Finally, Reyes, M. et al. (2014) exam- ined the aspects of green space accessibility of children in Montreal, applying an accessi- bility time of 15 minutes by making it equiva- lent to a walking distance ranging from 810 metres to 1,350 metres.
As it has been demonstrated the definition of walking distance is influenced by several factors, including a reasonable walking time (ranging from 4 to 15 minutes in the cited papers) being transformed to distance, the size of the green space in terms of area, the dominant ecosystem services the green space provides, the type of the vegetation cover- age, the transport mode used to approach the green space (e.g. walking, cycling, public transport), and the age characteristics of users (e.g., children, young adults, older people).
Data and method
The definition of ‘urban green spaces’
In Hungary, ‘public green space’ is a legally defined and regulated zoning category; con- sequently, each public green space located in a given municipality must be included in the Zoning Plan. Accordingly, the National Urban Planning and Building Requirements (NUPBR) regulates the fundamental features,
physical parameters, and ecosystem services of public green spaces. The NUPBR classifies public green spaces into two subcategories:
the public park and the public garden. Ac- cording to the description of the NUPBR, public green spaces (both public parks and public gardens) are public open spaces per- manently covered by vegetation with the goal to improve the climatic conditions, protect the ecological system of settlements, and provide opportunities for inhabitants to relax and participate in sports and physical activities.
Unlike public parks and gardens, resi- dential and institutional green spaces are not recognised and mapped in the Zoning Plan. They comprise ‘residential areas’ and
‘institutional areas’ covered by green, re- gardless of how large they are or how they are frequented by daily green space users.
Common feature of these spaces is that
they do not qualify as public spaces, be- cause they are owned by either a commu- nity (residential estate) or an institution. In addition, some residential green spaces do not meet the planning criteria of the NUPBR (their built-up ratio exceed the maximum limit as indicated in the NUPBR). However, they are freely available to anyone most of the time, therefore, we decided to consider them during the analysis. In this study, we consider ‘public’, ‘residential’ and ‘institu- tional’ green spaces together as ‘urban green spaces’. During the research a total number of 99 urban green spaces were identified in Debrecen. The geographical location of the inner urban UGS is highly concentrated, as the vast majority of them are located in the northern, north-western, and south-western districts of the city (Figure 1). In contrast, the eastern, south-eastern, and southern parts of the city host few public green spaces.
Fig. 1. The geographical location of urban green spaces in Debrecen, Hungary. Source: Own survey, 2020.
The assessment of urban green space accessibility by walking distance
In this research a walking distance of 300 me- tres has been applied as a fixed distance. This can be justified by two factors. First, Debrecen is one of the largest municipalities in Hun- gary by size: its administrative area covers 461.58 km2. However, the inner urban area, being home to 92.78 per cent of the local pop- ulation, is as small as 70.49 km2. Furthermore, the East–West diameter of the inner urban area is 9.72 km, and the North–South diam- eter is 7.80 km. Given the relatively small and compact inner urban area of the city, it is rea- sonable to employ a shorter walking distance.
For example, Smoyer-Tomic, K.E. et al. (2004) applied a walking distance of 800 metres in the case of Edmonton, Alberta; However, the built-up area of the Canadian city is 572 km2 (i.e. eight times larger than that of Debrecen).
Second, the average size of urban green spac- es in the city is relatively small: 1.46 hectares per green space and only 1.05 hectares with- out the area of the largest city-park called
‘Nagyerdő’, located in the North.
Primary and secondary datasets
The UGS of Debrecen (as we understand it) are not properly designated and mapped by the planning documents of the city. There- fore, it was necessary to identify them by us- ing satellite images from Google Maps and then investigate them via fieldwork. After compiling an inventory of green spaces in the city, each area was visualised by using Goog- le My Maps. To map the accessibility area of green spaces, a fixed distance of 300 metres was measured on each street and road head- ing towards the green space. After measur- ing and fixing each border vertex lying 300 metres from the perimeter points of the green space, the border vertices were linked, and the accessibility polygon was created.
To explore the quality and functions of urban green spaces, each of them was ex- plored individually. During the fieldwork,
the functions of each UGS were determined and classified into the following categories:
none, passive, active, playground and the combination of these. Also, a detailed photo documentation containing approximately 1,500 photos was performed. Both the photo documentation and the description of the UGS have been uploaded to the Google Maps profile of that green space.
The assessment of UGS was based on the examination of their physical appearance, the quality of the vegetation and that of the infra- structure. In addition, when investigating the quality of UGS we also considered whether they were maintained and cleaned properly.
Based on the outcome of the quality assess- ment we classified UGS into five quality cat- egories which are as follows: 1) very poor, 2) poor, 3) medium, 4) good, and 5) very good.
Some UGS, particularly those being surround- ed by block-like buildings, are currently under revitalization. We marked these UGS with “R”.
In addition to the primary survey data, we used the 100 x 100 m purchasing power data- base issued by GeoX Limited. This is a grid- based dataset in WGS84 coordinate system, which covers the inhabited area of Debrecen.
Each grid cell has 29 attribute data assigned to it, which represent territorial identification data, demographic and social indicators, or special traffic indexes. We also used ArcMagyarország, Open Street Map and ESRI aerial imagery as basemap layers in our analysis.
Methods of GIS and statistical analysis
For detailed geographical analysis, the pol- ygons of the UGS and their 300 metres ac- cessibility zones were imported to ArcGIS.
The data connection of green spaces and 300 metres buffer zones with demographic and social indicators was a two-step process: 1) we generated centroid points for each grid cell, 2) the centroid points were connected to each UGS and buffer zones based on spatial location (ArcGIS-Spatial Join function).
To determine the broader ‘service area’ of UGS, we used the ‘Thiessen polygon’ and the
‘Near’ functions of ArcGIS. The former con- verts points coverage (centroids of UGS) to Thiessen (Voronoi) proximal polygons while the latter calculates the geodesic distance of each grid cell centroid to the nearest buffer zone. The results of these give us quasi acces- sibility indication for the areas outside of the 300 metres accessibility zones.
We also carried out spatial autocorrelation of mean income to map their spatial clusters in the study area. In the first step, we used the Global Moran’s I function of ArcGIS to exam- ine whether they form spatial clusters. Next, we carried out an incremental analysis to de- termine the optimal cut off distance. Finally, we mapped the clusters and outliers with the Anselin Local Moran’s I function of ArcGIS.
As a result, five clusters were defined:
1. high-high clusters: 100 x 100 m cells characterized by high values and surrounded by cells with similarly high values;
2. high-low outlier: cells with high values surrounded by cells with low values;
3. low-high outlier: cells producing low values surrounded by cells with high values;
4. low-low clusters: cells producing low values surrounded by cells with similarly low values;
5. not significant: the cell pattern does not fit into any cluster.
When doing so, we investigated the rela- tionship between the quality of UGS and the mean income of people living in the 300 me- tres accessibility zones.
Finally, we carried out a Spearman’s rank- order correlation analysis in SPSS to reveal the connection between the population den-
sity of the 300 metres buffer zones and the quality of UGS. To match green space quality ranks, we used the ‘Natural Breaks’ method of ArcGIS classification engine to classify the accessibility zones by their population den- sity into five classes.
Results
Accessibility of urban green spaces
Using the 300-metre walking distance meth- od we can say that the catchment areas of UGS are highly concentrated, as most of them are located in the central part of the inner urban area of Debrecen (Figure 2).
The cumulative accessibility area covers only 21.6 per cent of the inner urban area, but hosts 45.9 per cent of the city’s population.
If the 300 m catchment area is extended by 200 m, we find that almost two-thirds (66.2%) of the city’s population live within a 500 m distance from an UGS. However, from the Northeast to the South, the inner urban area is encircled by outskirts being home to ap- proximately 16.3 per cent of the city’s popu- lation (32,400 people) for whom there is no single accessible UGS within 1,000 metres or more (see Fig. 2 and Table 1).
Based on the Thiessen polygon scheme we can conclude that green spaces being located on the edge of the inner urban area are the closest green spaces for people living in the outskirts. This approach clearly demonstrates the enormous spatial inequalities regarding the location of urban green spaces in Debrecen. On
Table 1. Main features of accessibility categories Distance to green
space, m Number of
households Percentage of
households Number of
population Percentage of population 0– 300
301– 500 501–1,000 1,001–1,500 1,501–7,199
39,365 15,572 11,485 3,981 5,880
51.60 20.41 15.06 5.227.71
91,526 40,536 34,793 13,551 18,881
45.93 20.34 17.46 6.809.47
Total, 0–7,199 76,283 100.00 199,287 100.00
Source: Own calculations based on survey and GeoX database, 2020.
the one hand, the ‘Nagyerdő Park’, being the largest urban green space in the northern part of the city, and covering 42.0 hectares, it is the closest UGS only for 750 people according to the Thiessen polygons. It means, that the ratio of the area of ‘Nagyerdő Park’ and the number of park users for whom it is the closest UGS is only 18 people/hectare. On the other hand, the ‘Tócóskert’ neighbourhood with high-rise buildings is the most populous residential area in Debrecen being home to approximately 17 thousand people. However, the Thiessen poly- gon scheme suggests that the UGS located in
‘Tócóskert’ satisfy the needs of almost 23,500 people. This neighbourhood, however, hosts two urban parks and several larger green spac- es which have a total area of 27.57 hectares.
Due to this fact, the relative number of green space users in Tócóskert is nearly 50 times higher (i.e. 850 people/hectare) compared to
‘Nagyerdő Park’, but still rather low compared to the eastern belt of the compact city. In the
eastern neighbourhoods of Debrecen, the total area of nine UGS is only 5.86 hectares, and they are the closest UGS for 52,895 people, most of whom live in low-rise outskirts. We can note, that reaching 9,026 people/hectare, the relative number of green space users is extremely high in the eastern sector of the city.
The differences of green space accessibil- ity of people living in particular neighbour- hoods also confirm robust spatial inequali- ties. Figure 3 shows that in the central part of the inner urban area, residents have more than one options to access an UGS within 300 metres. Those residential areas that were established in the socialist era and contain high-rise buildings of 4–10 storeys, particu- larly the ‘Tócóskert’ housing estate, offer the greatest number of options for people to access UGS. The north-western residential quarters with single-family homes inhabited by affluent people are also relatively well- supplied by green spaces.
Fig. 2. The geographical pattern of accessibility of UGS and Thiessen polygon scheme. Source: Own calculations based on GeoX database, 2020.
Sharp differences can be observed re- garding the socio-economic characteristics of people living in particular accessibility categories. As Table 2 demonstrates, those people who live closest to UGS (i.e. within 500 metres), are generally more educated. In addition, the ratio of elderly (i.e. people over 63) is the highest in these areas, whereas the ratio of young people (i.e. people below 18)
is the lowest. In contrast, those people who live in the outskirts, particularly those who live 1,500 metres or more from UGS, are the least educated. Furthermore, the age struc- ture of people living in the outskirts is quite the opposite as among those people living in 300 and 500 metres distance from UG: the ratio of children is high and that of old peo- ple is rather low. Table 2 shows that there is Fig. 3. Accessibility options in terms of the number of urban green spaces available for people living in particular
neighbourhoods. Source: Own calculations based on GeoX database, 2020.
Table 2. Socio-economic characteristics of accessibility categories Distance to green
space, m Mean income,
HUF/year Percentage of
college graduates Percentage of people aged
below 18 over 63
0– 300 301– 500 501–1,000 1,001–1,500 1,501–7,199
1,368,353 1,368,009 1,301,545 1,316,755 1,322,700
26.030.3 25.219.5 14.3
15.81 18.24 18.92 20.86 20.22
23.83 22.36 20.72 18.84 17.03
Mean value 1,348,786 25.2 17.61 22.01
Source: Own calculations based on survey and GeoX database, 2020.
no significant difference between the mean income of people located closest to UGS and those living in the outskirts.
Relationship between the quality of urban green spaces and their socio-economic environment It is an important objective of this study to find out whether there is any relationship between the quality of UGS and the socio- economic background of their potential users.
According to Table 3 most UGS in Debrecen fall in the categories of medium and poor based on their quality. The total area of me- dium quality UGS is the largest, however, for the majority of people, only poor quality UGS are available within 300 metres. The total area of UGS with very good quality is less than 10 hectares, and they provide easy accessibil- ity only for very few people (i.e. 3.14% of the population) within 300 m distance.
Considering the UGS-quality vs. socio- economic environment, we first examined the relationship between the quality of UGS and the mean income of people living nearby by using spatial autocorrelation clusters.
As can be seen in Table 4, the majority of Debrecen’s population lives in high-high clusters (42.66%) and low-low clusters (23.73%). Thus, the city is highly polarised.
The mean income in high-high clusters is 17 per cent higher than in low-low clusters. In addition, the high-high clusters host more educated people than the low-low clusters.
If we examine the spatial distribution of UGS by cluster types, it can be seen that the western part of the inner urban area of Debrecen is characterized by high-high clus- ters and low-high outliers (Figure 4). These clusters host most of the UGS. The north- western neighbourhoods particularly belong to high-high clusters (i.e. people residing in these neighbourhoods have high mean in-
Table 3. The quality classification of UGS and relevant data Quality of UGS Number of
UGS* Total area of UGS, ha
Number of
households Number of people living within 300 m*
Very poor PoorMedium GoodVery good
Under revitalization
264 3220 125
40.331.84 47.97 38.08 9.606.42
1,086 30,906 19,164 9,433 2,608 7,088
2,749 74,315 44,318 21,229 6,248 14,760
*Due to overlaps, a person can be assigned to more than one UGS. Source: Own calculations based on survey and GeoX database, 2020.
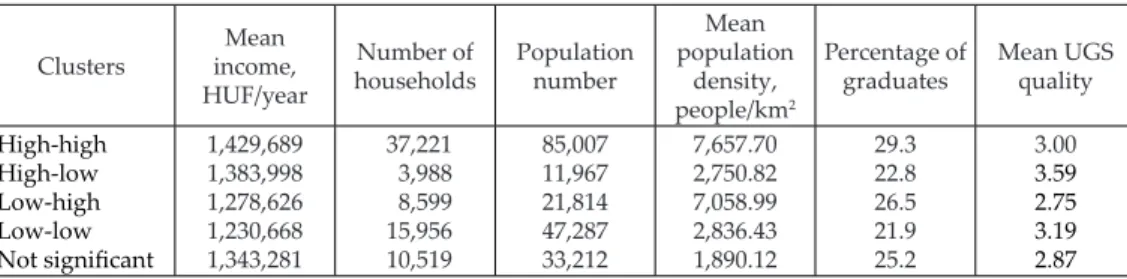
Table 4. Summary statistics of clusters in terms of mean income
Clusters Mean
income, HUF/year
Number of
households Population number
Mean population
density, people/km2
Percentage of
graduates Mean UGS quality High-high
High-low Low-high Low-low Not significant
1,429,689 1,383,998 1,278,626 1,230,668 1,343,281
37,221 3,988 8,599 15,956 10,519
85,007 11,967 21,814 47,287 33,212
7,657.70 2,750.82 7,058.99 2,836.43 1,890.12
29.322.8 26.521.9 25.2
3.003.59 2.753.19 2.87 Source: Own calculations based on survey and GeoX database, 2020.
come), and these neighbourhoods host the best quality UGS as well. As an opposite, the eastern and the south-eastern parts of Debrecen are dominated by low-low clusters.
In these neighbourhoods there is only a few UGS with medium quality.
In the study, the relationship between population density of the 300 m accessibil- ity zones and the quality of UGS was also
examined (Table 5). To explore this aspect, a Spearman’s rank-order correlation was per- formed, which showed a moderate negative correlation between the two variables, which is statistically significant (rs = -.450, p < 0.01).
Considering data in Table 5, we can con- clude that UGS with the poorest quality are located in areas with higher population den- sity. It is assumed that this reflects an over- Fig. 4. The quality of UGS and the geographical pattern of clusters regarding mean income. Source: Own cal-
culations based on GeoX database, 2020.
Table 5. Population density classes vs. UGS quality Population density
categories of 300 m accessibility zones
Number
of UGS* Mean population density, people/km2
Minimum Maximum Mean UGS
quality population density
LowBelow average Average Above average High
2329 1511 16
1,197.0 3,447.5 7,046.6 11,008.2 16,701.1
399.7 2,566.2 5,331.8 9,158.4 14,343.8
2,221.0 4,979.6 8,608.8 12,634.3 19,975.3
3.73.3 2.72.5 2.6
*Without those UGS which are under revitalization. Source: Own calculations based on survey and GeoX database, 2020.
use of UGS being located in densely inhab- ited areas. In addition, if examining data in Table 4, a relationship between the quality of UGS and the mean income of people around the UGS can be observed. In the case of high- high clusters in terms of mean income an overall medium UGS quality can be seen, whereas, irrespective of the lower popula- tion density, the low-high outliers produce an UGS quality below the mean level. These results suggest that high income people liv- ing in the north-western part of Debrecen are provided with better quality UGS as compared to those living in the less wealthy neighbourhoods (see Figure 4). Surprisingly, the low-low cluster hosts better quality UGS than the high-high cluster (i.e. the cluster where wealthier people reside) because, due to the low population density characteriz- ing the low-low cluster, the negative effect of overuse is less significant.
Discussion and conclusions
In this study, the analysis of accessibility and the qualitative assessment of urban green spaces (UGS) in Debrecen allowed us to reveal both some specific features for the city, and some generalisations for post-socialist cities.
Considering the case-study of Debrecen the role of physical geographical features and historical pathway of urban development can be emphasised in the contemporary provi- sion of UGS. The city is lying at the boundary of two distinct physical geographical regions:
Hajdúság with fertile chernozem soil in the West, and Nyírség covered by sandy soil in the East. Historically, the eastern periphery of the city has been covered by afforested ar- eas mixed with lakes and pasture, whereas the western peri-urban zone has been tradi- tionally used for crop production. When the city started to grow in the post-WWII period most of the major housing development pro- jects were concentrated in the western half of the city, in the form of high-rise housing estates. Given the high concentration of new residents these housing estates had to be sup-
plied with green spaces to satisfy the needs of people. However, green areas developed during state-socialism were mostly ‘residen- tial’ and ‘institutional’ green spaces and were not qualified as public green spaces. At the same time, the eastern half of the city, with low-density housing, became neglected re- garding green surface development. In this part of the city only a few UGS are available even today in a reasonable walking distance.
For most of the people living in the eastern and southern outskirts there is no UGS with- in 1,000 m or more, and the closest ones are typically small-sized playgrounds with hard- ly any amenities. Research also showed that the ‘Nagyerdő Park’, the largest public green space of Debrecen, located on the northern edge of the inner urban area is not accessible for the majority of residents on foot.
Based on research findings we can con- clude that in the future planning and devel- opment of green spaces in Debrecen should focus on the eastern and southern outskirts of the city in order to reduce the spatial in- equalities of UGS. The accessibility of UGS for all the people living in the city should be in line with the principles of spatial jus- tice, a concept that has emerged recently and is of high importance in contemporary urban planning (Soja, E.W. 2010). In addi- tion, greater emphasis should be placed on improving the accessibility of the ‘Nagyerdő Park’ by public transportation and bicycle.
Looking beyond the Debrecen-specific findings, we can also conclude some gener- alisations for post-socialist cities in Hungary and Central and Eastern Europe. The de- velopment of Debrecen’s residential areas clearly reflects social polarization that has emerged since the early 1990s (the geograph- ical context of social polarization is examined by, e.g. Hamnett, C. 1994; Wessel, T. 2000;
Lemanski, C. 2007; Modai-Snir, T. and van Ham, M. 2018). A significant proportion (ca.
30%) of the local population lives in neigh- bourhoods characterized by high-rise hous- ing estates built in the socialist era, whereas a much smaller group of residents lives in up- market residential compounds protected by
fences, and gates. The former zones contain poor-quality UGS surrounded by rows of 4 to 10-storey buildings and are character- ized by high population density (Figure 5).
These neighbourhoods are generally over- crowded with cars due to the limited number of parking spaces. The most typical example of this type is the ‘Tócóskert’, the largest and most populous housing estate in Debrecen.
New upmarket residential areas, however, are home to the wealthiest section of popula- tion in Debrecen, who live in newly built vil- las, row houses and gated compounds with high-quality (private) UGS in the centre of the neighbourhoods, equipped with tennis courts and playgrounds (Figure 6). In Hungary and other post-socialist countries, gated commu- nities have emerged since the early 1990s and they are particularly typical in capital cities (e.g. Budapest and its agglomeration) as well as in other rapidly growing second-rank cit- ies in the countryside (e.g. Debrecen, Győr,
and Kecskemét) (Hegedűs, G. 2009; Kovács, Z. and Hegedűs, G. 2014). In the case of Debrecen, gated communities have been es- tablished on the edge of the inner urban area, increasing the size of the city’s built-up area;
however, since the late 1990s they have been fully incorporated into the city. In addition, some newly created suburban gated commu- nities are located 5–10 kilometres from the inner urban area, predicting the directions of the city’s future expansion.
In the future urban planners in Hungary (and in other post-socialist countries) should seriously consider challenges of spatial in- equalities of UGS. Environmental justice should be a core concept of city-planning considering not only the officially designated public green spaces, but also other forms of urban green (institutional, residential, pri- vate etc.). Planners should strive to make fair balance among different types of neighbour- hoods and their residents regarding the sup-
Fig. 5. The ‘Tócóskert’ neighbourhood, a high-rise housing estate with pre-fab buildings of 4- to 10-storeys and poor quality urban green spaces. Source: Own design using Google My Maps.
ply, accessibility and quality of green spaces.
To support the planning process of environ- mentally more equitable cities the walking distance approach combined with socio-de- mographic data analysis can be a useful tool.
Acknowledgements: This research was funded by the Hungarian Scientific Research Fund (OTKA) grant number K119710, the Ministry of Human Capacities, Hungary grant number 20391-3/2018/FEKUSTRAT, and the Ministry for Innovation and Technology, Hungary grant number TUDFO/47138-1/2019-ITM.
REFERENCES
Anguluri, R. and Narayanan, P. 2017. Role of green space in urban planning: Outlook towards smart cities. Urban Forestry and Urban Greening 25. 58−65.
Aram, F., Higueras García, E., Solgi, E. and Mansournia, S. 2019. Urban green space cooling effect in cities.
Heliyon 5. (4):01339.
Balfour, R. and Allen, J. 2014. Local action on health inequalities: Improving access to green spaces. Health
Equity Evidence Review 8. London, Public Health England. Retrieved from https://assets.publish- ing.service.gov.uk/government/uploads/system/
uploads/attachment_data/file/355792/Briefing8_
Green_spaces_health_inequalities.pdf
Barbosa, O., Tratalos, J.A., Armsworth, P.R., Davies, R.G., Fuller, R.A., Johnson, P. and Gaston, K.J.
2007. Who benefits from access to green space? A case study from Sheffield, UK. Landscape and Urban Planning 83. (2−3): 187−195.
Bedimo-Rung, A.L., Mowen, A.J. and Cohen, D.A. 2005.
The significance of parks to physical activity and public health: A conceptual model. American Journal of Preventive Medicine 28. (Supplement 2): 159−168.
Benkő, M. 2016. Budapest’s large prefab housing estates:
Urban values of yesterday, today and tomorrow.
Journal of Hungarian Studies 29. (1−2): 21−36.
Berman, M.G., Jonides, J. and Kaplan, S. 2008. The cognitive benefits of interacting with nature.
Psychological Science 19. (12): 1207−1212.
Berto, R. 2005. Exposure to restorative environ- ments helps restore attentional capacity. Journal of Environmental Psychology 25. (3): 249−259.
Bičík, I. and Jeleček, L. 2009. Land use and landscape changes in Czechia during the period of transition 1990–2007. Geografie 114. (4): 263–281.
Fig. 6. A gated community for the wealthiest section of the population with high quality urban green spaces in Debrecen. Source: Own design using Google My Maps.
Biedenweg, K., Williams, K., Cerveny, L. and Styers, D. 2019. Is recreation a landscape value? – Exploring underlying values in landscape values mapping.
Landscape and Urban Planning 185. 24−27.
Bolund, P. and Hunhammar, S. 1999. Ecosystem services in urban areas. Ecological Economics 29.
(2): 293−301.
Boone, C.G., Buckley, G.L., Grove, J.M. and Sister, C. 2009. Parks and people: An environmental jus- tice inquiry in Baltimore, Maryland. Annals of the Association of American Geographers 99. (4): 767−787.
Brambilla, G., Gallo, V. and Zambon, G. 2013. The soundscape quality in some urban parks in Milan, Italy. International Journal of Environmental Research and Public Health 10. (6): 2348−2369.
Chang, J., Qu, Z., Xu, R., Min, Y., Ren, Y., Yang, G.
and Ge, Y. 2017. Assessing the ecosystem services provided by urban green spaces along urban cen- ter-edge gradients. Scientific Reports 7. (1):11226.
Chen, J. and Chang, Z. 2015. Rethinking urban green space accessibility: Evaluating and optimizing pub- lic transportation system through social network analysis in megacities. Landscape and Urban Planning 143. 150−159.
Cicea, C. and Pîrlogea, C. 2011. Green spaces and public health in urban areas. Theoretical and Empirical Researches in Urban Management 6. (2): 83−92.
Cohen, D.A., McKenzie, T.L., Sehgal, A., Williamson, S., Golinelli, D. and Lurie, N. 2007. Contribution of public parks to physical activity. American Journal of Public Health 97. (3): 509−514.
Cömertler, S. 2017. Greens of the European green capitals. IOP Conference Series: Materials Science and Engineering 245. (5):052064.
Cvejić, R., Eler, K., Pintar, M., Železnikar, Š., Haase, D., Kabisch, N. and Strohbach, M. 2015. A Typology of Urban Green Spaces, Ecosystem Services Provisioning Services and Demands. EU FP7 (ENV.2013.6.2-5- 603567) GREEN SURGE project (2013–2017) re- search report. Available at https://greensurge.eu/
working-packages/wp3/files/D3.1_Typology_of_ur- ban_green_spaces_1_.pdf/D3.1_Typology_of_ur- ban_green_spaces_v2_.pdf
Dempsey, S., Lyons, S. and Nolan, A. 2018. Urban green space and obesity in older adults: Evidence from Ireland. SSM – Population Health 4. 206−215.
De Sousa Silva, C., Viegas, I., Panagopoulos, T. and Bell, S. 2018. Environmental justice in accessibility to green infrastructure in two European cities. Land 7. (134): 1−23.
De Valck, J., Broekx, S., Liekens, I., De Nocker, L., Van Orshoven, J. and Vranken, L. 2016. Contrasting collective preferences for outdoor recreation and substitutability of nature areas using hot spot mapping. Landscape and Urban Planning 151. 64−78.
EC−UN-Habitat 2016. The State of European Cities 2016.
Cities leading the way to a better future. Brussels, European Commission – European Union & UN-
Habitat, Retrieved from https://ec.europa.eu/re- gional_policy/sources/policy/themes/cities-report/
state_eu_cities2016_en.pdf
Grunewald, K., Richter, B., Meinel, G., Herold, H. and Syrbe, R.-U. 2017. Proposal of indicators regarding the provision and accessibility of green spaces for assess- ing the ecosystem service “recreation in the city” in Germany. International Journal of Biodiversity Science, Ecosystem Services and Management 13. (2): 26−39.
Haaland, C. and van den Bosch, C.K. 2015. Challenges and strategies for urban green-space planning in cities undergoing densification: A review. Urban Forestry and Urban Greening 14. (4): 760−771.
Hartig, T., Evans, G.W., Jamner, L.D., Davis, D.S. and Gärling, T. 2003. Tracking restoration in natural and urban field settings. Journal of Environmental Psychology 23. (2): 109−123.
Hamnett, C. 1994. Social polarisation in global cities:
Theory and evidence. Urban Studies 31. (3): 401−424.
Hedblom, M., Gunnarsson, B., Iravani, B., Knez, I., Schaefer, M., Thorsson, P. and Lundström, J.N.
2019. Reduction of physiological stress by urban green space in a multisensory virtual experiment. Scientific Reports 9. (1):10113.
Hegedűs, G. 2009. A review of gated communities in some Hungarian cities. Geographica Pannonica 13.
(3): 85−96.
Hoffimann, E., Barros, H. and Ribeiro, A.I. 2017.
Socioeconomic inequalities in green space quality and accessibility: Evidence from a Southern European city. International Journal of Environmental Research and Public Health 14. (8): 916.
Hong, J.Y. and Jeon, J.Y. 2013. Designing sound and visual components for enhancement of urban soundscapes. Journal of the Acoustical Society of America 134. (3): 2026−2036.
Iraegui, E., Augusto, G. and Cabral, P. 2020.
Assessing equity in the accessibility to urban green spaces according to different functional levels.
International Journal of Geo-Information 9.308.
Kaczynski, A.T. and Henderson, K.A. 2007. Environ- mental correlates of physical activity: A review of evidence about parks and recreation. Leisure Science 29. (4): 315−354.
Kaczynski, A.T., Potwarka, L.R., Smale, B.J.A. and Havitz, M.F. 2009. Association of Parkland prox- imity with neighborhood and park-based physical activity: Variations by gender and age. Leisure Sciences 31. (2): 174−191.
Kolcsár, R.A. and Szilassi, P. 2017. Assessing acces- sibility of urban green spaces based on isochrone maps and street resolution population data through the example of Zalaegerszeg, Hungary. Carpathian Journal of Earth and Environmental Sciences 13. (1):
31–36.
Koprowska, K., Łaszkiewicza, E. and Kronenberga, J. 2020. Is urban sprawl linked to green space avail- ability? Ecological Indicators 108.105723.
Kovács, Z., Farkas, J.Z., Egedy, T., Kondor, A.C., Szabó, B., Lennert, J., Baka, D. and Kohán, B. 2019. Urban sprawl and land conversion in post-socialist cities:
The case of metropolitan Budapest. Cities 92. 71–81.
Available at https://doi.org/10.1016/j.cities.2019.03.018 Kovács, Z. and Hegedűs, G. 2014. Gated communities as new forms of segregation in post-socialist Budapest.
Cities 36. 200−209.
Larson, C.L., Reed, S.E., Merenlender, A.M. and Crooks, K.R. 2018. Accessibility drives species ex- posure to recreation in a fragmented urban reserve network. Landscape and Urban Planning 175. 62−71.
Lemanski, C. 2007. Global cities in the South: Deepening social and spatial polarisation in cape town. Cities 24. (6): 448−461.
Li, H., Chen, W. and He, W. 2015. Planning of green space ecological network in urban areas: An ex- ample of Nanchang, China. International Journal of Environmental Research and Public Health 12. (10):
12889−12904.
Littke, H. 2015. Planning the green walkable city:
Conceptualizing values and conflicts for urban green space strategies in Stockholm. Sustainability (CH) 7.
(8): 11306−11320.
Lu, Y. 2019. Using Google Street View to investigate the association between street greenery and physical ac- tivity. Landscape and Urban Planning 191. (11):103435.
Lv, Z., Yang, J., Wielstra, B., Wei, J., Xu, F. and Si, Y. 2019. Prioritizing green spaces for biodiversity conservation in Beijing based on habitat network connectivity. Sustainability (CH) 11. (7): 2042.
McCormack, G.R., Rock, M., Toohey, A.M. and Hignell, D. 2010. Characteristics of urban parks associated with park use and physical activity: A review of qualitative research. Health and Place 16. (4): 712−726.
Mexia, T., Vieira, J., Príncipe, A., Anjos, A., Silva, P., Lopes, N., Freitas, C., Santos-Reis, M., Correia, O., Branquinho, C. and Pinho, P. 2018. Ecosystem services: Urban parks under a magnifying glass.
Environmental Research 160. 469−478.
Modai-Snir, T. and van Ham, M. 2018. Neighbourhood change and spatial polarization: The roles of increas- ing inequality and divergent urban development.
Cities 82. 108−118.
Paquet, C., Orschulok, T.P., Coffee, N.T., Howard, N.J., Hugo, G., Taylor, A.W., Adams, R.J. and Daniel, M.
2013. Are accessibility and characteristics of public open spaces associated with a better cardiometabolic health? Landscape and Urban Planning 118. 70−78.
Pichler-Milanović, N., Gutry-Korycka, M. and Rink, D. 2008. Sprawl in the post-socialist city: The chang- ing economic and institutional context of Central and Eastern European cities. In Urban Sprawl in Europe:
Landscapes, Land Use Change and Policy. Eds.: Couch, C., Leontidou, L. and Petschel-Held, G., Oxford, Blackwell, 102–135.
Poelman, H. 2016. A Walk to the Park? Assessing Access to Green Areas in Europe’s Cities. Working Papers,
WP 01/2016, Regional and Urban Policy, European Commission. Retrieved from https://ec.europa.eu/
regional_policy/sources/docgener/work/2018_01_
green_urban_area.pdf
Reyes, M., Páez, A. and Morency, C. 2014. Walking accessibility to urban parks by children: A case study of Montreal. Landscape and Urban Planning 125. 38−47.
Saelens, B.E. and Handy, S.L. 2008. Built environment correlates of walking: A review. Medicine and Science in Sports and Exercise 40. (Supplement 1): 550−566.
Schipperijn, J., Stigsdotter, U.K., Randrup, T.B. and Troelsen, J. 2010. Influences on the use of urban green space – A case study in Odense, Denmark. Urban Forestry and Urban Greening 9. (1): 25−32.
Slaev, A.D., Nedović-Budić, Z., Krunić, N., Petrić, J.
and Daskalova, D. 2018. Suburbanization and sprawl in post-socialist Belgrade and Sofia. European Planning Studies 26. (7): 1389–1412.
Smoyer-Tomic, K.E., Hewko, J.N. and Hodgson, M.J.
2004. Spatial accessibility and equity of playgrounds in Edmonton, Canada. Canadian Geographer 48. (3):
287−302.
Soja, E.W. 2010. Seeking Spatial Justice. Volume 16, Globalization and Community. Minneapolis, University of Minnesota Press.
Szemző, H. and Tosics, I. 2005. Hungary. In Urban Issues and Urban Policies in the New EU Countries. Eds.: van Kempen, R., Vermeulen, M. and Baan, A., London, Ashgate, 37–60.
Sýkora, L. 2009. Post-socialist cities. In International Encyclopaedia of Human Geography. Volume 8. Eds.:
Kitchin, R. and Thrift, N., Oxford, Elsevier, 387–395.
Tammaru, T., Leetmaa, K., Silm, S. and Ahas, R.
2009. Temporal and Spatial Dynamics of the New Residential Areas around Tallinn. European Planning Studies 17. (3): 423–439.
Threlfall, C.G., Mata, L., Mackie, J.A., Hahs, A.K., Stork, N.E., Williams, N.S.G. and Livesley, S.J. 2017.
Increasing biodiversity in urban green spaces through simple vegetation interventions. Journal of Applied Ecology 54. (6): 1874−1883.
Ulrich, R.S., Simons, R.F., Losito, B.D., Fiorito, E., Miles, M.A. and Zelson, M. 1991. Stress recovery during exposure to natural and urban environments.
Journal of Environmental Psychology 11. (3): 201−230.
UN 2018. World Urbanization Prospects: The 2018 Revision. New York, United Nations. Retrieved from https://www.un.org/development/desa/
publications/2018-revision-of-world-urbaniza- tion-prospects.html
Vargas-Hernández, J.G., Pallagst, K. and Zdunek- Wielgołaska, J. 2018. Urban green spaces as a component of an ecosystem. In Handbook of Engaged Sustainability. Eds.: Dhiman, S. and Marques, J., Cham, Springer, 885−916.
Wei, F. 2017. Greener urbanization? Changing ac- cessibility to parks in China. Landscape and Urban Planning, 157. 542–552.
Wessel, T. 2000. Social polarisation and socioeconom- ic segregation in a welfare state: The case of Oslo.
Urban Studies 37. (11): 1947−1967.
WHO 2017. Urban Green Space Interventions and Health:
A review of impacts and effectiveness. Copenhagen, DK, World Health Organization, Regional Office for Europe. Retrieved from http://www.euro.
who.int/__data/assets/pdf_file/0010/337690/FULL- REPORT-for-LLP.pdf?ua=1
Wolch, J.R., Byrne, J. and Newell, J.P. 2014. Urban green space, public health, and environmental justice: The challenge of making cities ‘just green enough’. Landscape and Urban Planning 125. 234−244.
Wüstemann, H., Kalisch, D. and Kolbe, J. 2017.
Access to urban green space and environmental inequalities in Germany. Landscape and Urban Planning 164. 124−131.
Xu, L., You, H., Li, D. and Yu, K. 2016. Urban green spaces, their spatial pattern, and ecosystem service value: The case of Beijing. Habitat International 56.
84−95.
Yang, P., Xiao, Z.-N. and Ye, M.-S. 2016. Cooling effect of urban parks and their relationship with urban heat islands. Atmospheric and Oceanic Science Letters 9. (4): 298−305.
Yu, Z., Xu, S., Zhang, Y., Jørgensen, G. and Vejre, H. 2018. Strong contributions of local background climate to the cooling effect of urban green vege- tation. Scientific Reports 8. (1):6798.