THE SCALE AND FINANCIAL PERFORMANCE OF STATE-OWNED ENTERPRISES
IN THE CEE REGION*
Piotr MATUSZAK – Katarzyna SZARZEC
(Received: 11 January 2018; revision received: 4 May 2018;
accepted: 14 June 2018)
The paper aims to analyse state-owned enterprises (SOEs) in 11 post-socialist Central-Eastern European (CEE) countries. Based on the individual data of large non-fi nancial companies, we es- timated the real state share in the years 2014 and 2015. We consider both direct and indirect state ownership and apply an explicit classifi cation of companies as majority and minority state-owned, which is neglected in a lot of research. The countries with the highest values of the ‘Country SOE index’ were Slovenia and Latvia, while the lowest were Lithuania and Hungary. State ownership is dominant in transportation and storage and energy supply. The lower return on assets (ROA), return on equity (ROE) and return on capital employed (ROCE) ratios of SOEs imply that capital in this group of companies is used less effi ciently. Furthermore, they are characterised by higher wage costs. At the same time, SOEs have higher earnings before interest, taxes, depreciation and amortization (EBITDA) margins and better ability to turn operating revenue into cash than their privately-owned counterparts.
Keywords: state-owned enterprises, Central and Eastern Europe, post-socialist countries, fi nancial performance
JEL classifi cation indices: H82, P31, P43
* This work was supported by the National Science Centre Poland under Grant number 2015/17/B/
HS4/00327. We thank the participants of the 3rd Conference “The Role of State in Varieties of Cap- italism”, held at the Central European University, Budapest, Hungary (30 November – 1 December 2017) for their comments on an earlier version of this paper. We take exclusive responsibility for all the opinions expressed in this study.
Piotr Matuszak, corresponding author. PhD student at the Department of Macroeconomics and Development Studies, Poznan University of Economics and Business, Poland.
E-mail: Piotr.Matuszak@ue.poznan.pl
Katarzyna Szarzec, Associate Professor at the Department of Macroeconomics and Development Studies, Poznan University of Economics and Business, Poland.
E-mail: katarzyna.szarzec@ue.poznan.pl
INTRODUCTION
The reasons and scale of state ownership in enterprises have been discussed since the 1990s. Despite the waves of privatisation, the state has remained a significant owner of firms in many countries. Moreover, the economic signifi- cance of state-owned enterprises (SOEs) on the global and regional markets has increased, too.
This paper aims to explore and compare the phenomenon of state ownership in 11 Central-Eastern European (CEE) countries in 2014 and 2015. We claim that, in spite of the privatisation processes, the state has remained a significant owner of (mainly large) enterprises, most of them being of socialist origins. Moreover, we compare the economic performance of the state enterprises with their private counterparts focusing on a broad set of financial indicators.
We address the following research questions:
What is the scale of state ownership in the group of largest non-financial enterprises in the CEE countries?
What is the scale of state ownership in particular sectors in CEE?
Are there substantial differences in financial performance of SOEs as com- pared to their privately-owned counterparts?
We contribute to the literature by analysing not only the majority SOEs but also those companies with a minority but the controlling stake held by the state.
Further, we consider both direct and indirect state ownership and apply an ex- plicit classification of companies as majority and minority state-owned. By doing so, the real share of state ownership is estimated based on the firm-level data in the CEE countries. We also introduce two country and sector SOE indices.
This paper consists of the following sections: firstly, we discuss the reasons for the persistence of state ownership. Secondly, we present the scale of state owner- ship in the non-financial companies in 11 CEE countries. Thirdly, we compare the financial performance of the large companies in the region according to their ownership structure. Finally, we draw conclusions and offer some recommenda- tions for further research.
1. REASONS FOR THE PERSISTENCE OF STATE OWNERSHIP
In the 80s and 90s, the economic debate was dominated by negative thinking about state ownership. This was connected to the waves of privatisation processes happening in the developed and transition countries, justified by the belief that only private ownership guarantees high efficiency (Kozarzewski 2006; Snowdon 2007; Roland 2008). The negative perception of state ownership resulted, to
a large extent, from the experiences of the socialist and developing countries, where state enterprises were treated as vehicles of industrialisation and economic development but were, in reality, highly inefficient due to overemployment, lack of incentives to develop and the fact that they did not produce the goods demand- ed on the market. State enterprises also faced the soft-budget constraint problem (Kornai 1986), due to which their managers were not motivated towards pro- efficiency behaviours. Moreover, authorities often failed to identify promising sectors of the economy. A key argument for the privatisation of state companies in the post-socialist countries was an improvement in their economic perform- ance. According to the widely accepted recommendation by the EBRD: “Private ownership would ensure profit-oriented corporate governance, while liberalisa- tion of trade and prices would set free the competitive market forces that reward profitable activities. Firms would have therefore both internal and external incen- tives to restructure” (EBRD 1999).
Due to privatisation processes and the establishment of new private firms, the ownership structure of production and employment in the post-socialist countries was the opposite when compared to the previous decades. Notwithstanding this, the state remained an important owner of enterprises in the CEE region through dominant stake or non-ownership tools (Bałtowski – Kozarzewski 2016; Szarzec – Nowara 2017). Further, in Hungary and Poland one can also observe a change in the ownership policy and a trend of renationalisation through share buyouts in previously privatised companies (the so-called ‘reversal in the privatisation logic’) and using SOEs by politicians for political and personal rent-seeking (Kozarzewski – Bałtowski 2016; Szanyi 2016).
Discussing the motivation of state ownership in the economy, one can refer to a range of reasons, such as (OECD 2005; Christiansen 2013; Kowalski et al. 2013;
Putniņš 2015): the provision of public goods, an increase in access to public serv- ices, a source of public funds, improvement of labour relations particularly in ‘stra- tegic’ sectors, a limitation of private and foreign control in the domestic economy and encouragement of economic development and industrialisation. Nowadays, in the CEE countries the main reason that the state intentionally holds shares in enter- prises is its national economic policy concerning national security and economic development. Governments recognise some sectors of the national economy as strategic and prevent the privatisation of certain industries and enterprises. They want to hold corporate supervision in them, either by being the majority sharehold- er, a minority shareholder, or by introducing a system of government authorisa- tions and licenses which controls the economic activities in a given sector (Report from… 2013). Typical strategic sectors are those involving natural resources or energy supply. In this case, the argument is no longer about a natural monopoly, but concerns the strategic resources necessary to maintain national security.
Moreover, state companies are also treated as a vehicle of economic develop- ment and industrialisation and a potential source of building a new comparative advantage. At the beginning of the 2000s, a significant change in the attitude to- wards state ownership occurred when large SOEs from China and Russia became important players in the global market. They grew in part from the past socialist development models adapted to the present reality and are regarded as national champions that are not to be privatised under any circumstances. The increasing significance of state companies in these countries, and subsequently in some of the CEE countries, was accompanied by a revival of the idea of the so-called
‘developmental state’ and the development of the New Structuralist Economics (NSE). The ‘developmental state’ was a subject of reflections in the literature on the structuralist economics in the 70s and 80s.1 The state was dedicated to identifying and creating ‘infant industries’ by establishing state enterprises and applying special protection policies (e.g. export subsidies). Later on, however, economists started to doubt if public authorities would really be able to appro- priately perform such activities (Irwin 2008), and trade liberalisation in the 90s limited the application of protection policies. NSE sees the state as playing a very important role, but in contrast to the old structuralism, the government here does not replace the market, but merely supports and promotes industrial development and innovation (Lin – Monga 2012). As such, state enterprises should operate in commercial affairs to achieve economic goals and foster competition.
Some researchers claim that state enterprises can be as efficient as their pri- vately-owned counterparts (e.g. Bortolotti et al. 2013; Borghi et al. 2016). Firstly, one important issue is an increase in the quality of political and economic insti- tutions – good institutions promote efficiency in companies controlled by the state. Secondly, the quality of the management of state enterprises has changed significantly due to the propagation of corporate governance rules established by national authorities and international organisations (e.g. OECD). The applica- tion of these rules requires more responsible, predictable and profitable activities.
Besides, some of these new state enterprises are publicly listed, which demands pro-market behaviour from them.
Almost 30 years after the beginning of the transition in the CEE region, it can be argued that due to competition from foreign-owned companies, granting state aid according to the stricter EU rules and hard budget constraints, state enter- prises should not underperform when compared to privately-owned entities. This issue has been recently discussed in literature. Szarzec – Nowara (2017) indicate that the largest state-owned oil and gas enterprises operating in CEE, as well as
1 For an overview of the theories of economic development with emphasis put on the role of the state, see Boyer (2006).
Slovak SOEs in general, are characterised by a higher profit ratio and at the same time a lower ROE indicator than their privately-owned counterparts. A similar relation in the return on equity was shown in the report by the European Commis- sion (2016) on companies from 8 countries in the CEE region over the period of 2004–2013. Böwer (2017) points out that SOEs in this region had lower returns on equity and capital employed and higher employee costs. Russian SOEs were analysed by Abramov et al. (2017) and the authors suggest that there is an inverse relation between the state’s stake and returns on shareholders’ funds. Such results lead to the conclusion that capital is employed rather less efficiently in the group of SOEs than among privately-owned entities.
Even though most studies suggest the inefficiency of state ownership, compa- nies controlled by the state remain important economic players in both domestic and international markets (Liao – Zhang 2014; Götz – Jankowska 2017). There- fore, there is still a need to evaluate the real share of state ownership (regard- ing not only majority owned enterprises but also companies controlled by the state through the minority stake) and to compare the financial performance of SOEs, especially in the group of post-socialist countries of the CEE region that experienced the ‘unique historic experience’ (Kornai 2006) of rapid institutional changes.
2. DESCRIPTION OF DATASET
In order to indicate to what extent a nation-state operates as an owner in the economies of CEE, a dataset including the largest non-financial enterprises in this region was collected from the Amadeus database (Bureau van Dijk 2017).2 Data were gathered for the years 2014 and 2015 – this choice was based on the fact that many indicators for 2016 were still unavailable when this research was conducted.
The dataset consists of data on non-financial companies, which were classified as ‘very large’ from 11 countries of the CEE region (Bulgaria, Croatia, the Czech Republic, Estonia, Hungary, Latvia, Lithuania, Poland, Romania, Slovakia, and Slovenia).3 A very large enterprise is defined when it fulfils at least one of the fol- lowing conditions: operating revenue higher or equal to 100 million EUR; total assets higher or equal to 200 million EUR; number of employees higher or equal
2 Amadeus is the European subset of the Orbis database. It contains data on more than 20 mil- lion companies. The access to the database was provided by Bureau van Dijk.
3 This group of countries was chosen in order to obtain a complete and reliable dataset. More- over, they are all post-socialist countries that joined the European Union.
to 1000; listed.4 Since for many entities there were no data on the operating reve- nue and total assets for the analyzed years, two additional conditions were added:
operating revenue higher than 50 million EUR in both 2014 and 2015; total assets higher than 50 million EUR in both 2014 and 2015. This procedure allowed for the establishment of a dataset that consisted of 2290 enterprises.
The classification of the enterprises as state-owned is non-trivial due to the different definitions of state ownership and different means that the government uses to influence the companies (Bałtowski – Kozarzewski 2016). Therefore, one needs to precisely define conditions that classify the analysed entities. In this study, the focus is on ownership control of the state.5 Enterprises were classified manually, considering both direct and indirect state ownership, as majority state- owned, minority state-owned or privately-owned enterprises. Majority SOEs are defined as entities in which the state holds, directly or indirectly, an ownership stake of more than 50%. The minority state-owned group consists of enterprises with a dominant position of state shareholders and dispersed ownership struc- ture.6 Privately-owned enterprises (POEs) are controlled by private entities. In or- der to indicate the ownership status of the enterprises, ownership structures were
4 Moreover, companies with ratios operating revenue (or assets) per employee below 100 EUR are excluded from this category, and enterprises with unknown values of operating revenue, total assets and number of employees that reach a level of capital over 5 million EUR are included.
5 At the same time, we are aware that governments might also influence some enterprises through additional, non-ownership tools. We think companies such as MOL (Hungary), PGE, PKN Orlen (Poland), INA, and Koncar Distributivni i Specijalni Transformatori (Croatia). Nev- ertheless, we cannot unambiguously rule out that there were some other companies in which the state had a decisive impact through non-ownership means. A problem of non-ownership tools of control rights in Polish companies is broadly discussed by Bałtowski – Kozarzewski (2016). The authors distinguish between companies that are controlled by ownership and non- ownership means and refer to them as, respectively, SOEs and state-controlled enterprises (SCEs).
6 For each enterprise the sum of the private and state ownership stakes of the entities holding at least a 5% share was calculated. If a state holds (directly and indirectly) a higher ownership stake than all the private entities jointly, an enterprise is classified as a minority SOE. There- fore, minority SOEs are actually controlled by the state, despite the fact that it does not have majority blocks of shares. A 5% threshold was set due to a fact that disclosure requirements in 10 out of 11 analyzed countries impose an obligation on entities reaching 5% stake (10%
in Croatia) to notify the issuer of the proportion of voting rights in publicly quoted companies (Clearstream 2018). The terms ‘majority state-owned enterprises’ and ‘minority state-owned enterprises’ are used by OECD (2017) to describe enterprises with a state stake above 50%
and between 10–49%, respectively. Henceforth, unless indicated otherwise, we refer to both majority and minority state-owned enterprises as ‘state-owned enterprises’ or ‘SOEs’.
checked using the Amadeus (Bureau van Dijk 2017), EMIS (2017) and EIKON Thomson Reuters (2017) databases and official company reports.7
Since we focus on for-profit non-financial enterprises whose ownership can be easily taken over by the private sector (Florio 2014; Szarzec – Nowara 2017), entities from the following sectors were excluded from the dataset: compulsory social security activities, public administration, forestry, public education, de- fence activities, public health care, urban transport and public research institutes.
Additionally, enterprises owned by municipalities were also not included – this choice was based on the fact that the focus in this research is on the ownership by central governments. Due to these criteria, 143 companies from the raw database were not included in the analysis.
Data collected from Amadeus were based on unconsolidated accounts. This choice was driven by the fact that by employing data from unconsolidated ac- counts, one can avoid double-counting and can consider a wider range of activi- ties by sector within holding companies and conglomerates. Subsidiaries were classified in the same ownership group as their parent companies. Registered and operating abroad subsidiaries of state-owned companies, i.e. in a different coun- try than the parent company is registered, were classified as POEs.8 When the sta- tus of an enterprise changed during the analysed year, i.e. it was either privatised or nationalised, the company was excluded from the dataset for this year.9
3. THE SCALE OF STATE OWNERSHIP IN CEE
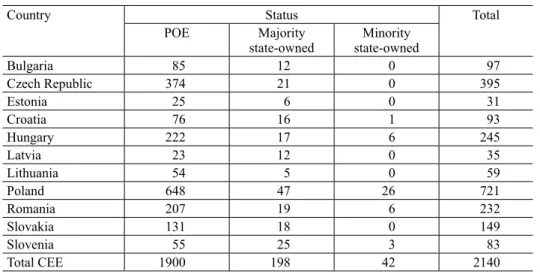
Using all the selection criteria described above, 198 majority and 41 minority SOEs were identified among 2140 largest non-financial companies in CEE in 2015 (Table 1).10 All entities included in this research recorded a sum of operating revenue of 867 billion EUR and total assets of 852 billion EUR, which is equal to, respectively, 75% and 74% of the GDP11 of the CEE region. SOEs had a share of 19% in total operating revenue and 35% in total assets.
The number of enterprises in the dataset by country is presented in Table 2. The country with the highest number of observations was Poland (721), followed by the Czech Republic (395), Hungary (245) and Romania (232). The countries with
7 In such cases where the data on the ownership structure differed between sources, the official reports were decisive.
8 There were 21 such cases in 2014 and 20 in 2015.
9 Due to changes in the ownership structure, 7 enterprises were excluded from the analysis for the year 2015 and 5 for the year 2014.
10 In this part, data for 2015 are presented. Data for 2014 are available upon request.
11 Data on GDP were collected from the World Bank internet database.
the least enterprises in the dataset were Estonia (31), Latvia (35) and Lithuania (59). More than 20 SOEs were registered in Poland (73), Slovenia (28), Romania (25), Hungary (23) and the Czech Republic (21). In five countries, there was at least one company controlled by the state without a majority stake – most of these were in Poland (26).
Unsurprisingly, the SOEs were larger than the POEs in the analysed dataset in terms of their operating revenue and total assets.12 A median majority SOE had an operating revenue of 284 million EUR and a median minority SOE had 430
12 Descriptive statistics of operating revenue, total assets and profit is available upon request.
Table 1. Largest enterprises in CEE, 2015
Status POE Majority
state-owned Minority
state-owned Total
Number of observations 1900 198 42 2140
Operating revenue
EUR, billion 705.791 110.665 50.950 867.406
% database 81.37 12.76 5.87
% GDP 61.13 9.59 4.41 75.13
Total assets
EUR, billion 557.673 234.424 59.716 851.813
% database 65.47 27.52 7.01
% GDP 48.30 20.30 5.17 73.77
Source: Own elaboration based on data from Amadeus.
Table 2. Number of large enterprises by countries, 2015
Country Status Total
POE Majority
state-owned Minority state-owned
Bulgaria 85 12 0 97
Czech Republic 374 21 0 395
Estonia 25 6 0 31
Croatia 76 16 1 93
Hungary 222 17 6 245
Latvia 23 12 0 35
Lithuania 54 5 0 59
Poland 648 47 26 721
Romania 207 19 6 232
Slovakia 131 18 0 149
Slovenia 55 25 3 83
Total CEE 1900 198 42 2140
Source: Own elaboration based on data from Amadeus.
million EUR, while for POEs this value was equal to 195 million EUR. Similarly, the median values of total assets were substantially higher in the group of SOEs.
Despite the fact that the median SOE had higher profit before tax than the median POE, the share of companies which reported losses was higher among the compa- nies controlled by the state – 23% for majority SOEs and 29% for minority SOEs as compared to 12% in the group of POEs.
In the list of the 15 largest enterprises in CEE in terms of operating revenue,13 one can indicate three minority SOEs (Polski Koncern Naftowy Orlen S.A., MOL Magyar Olaj- és Gázipari Nyrt.14 and KGHM Polska Miedź) and two majority SOEs (Grupa LOTOS S.A., Polskie Górnictwo Naftowe i Gazownictwo S.A.).
All of them were publicly-listed, which suggests that their status is an effect of
‘reluctant privatisation’ (Bortolotti – Faccio 2004). State ownership dominates among Poland’s largest companies – four of the five entities from this country were SOEs. On the other hand, none of the five largest companies registered in the Czech Republic was an SOE (in fact, they were all owned by foreign entities).
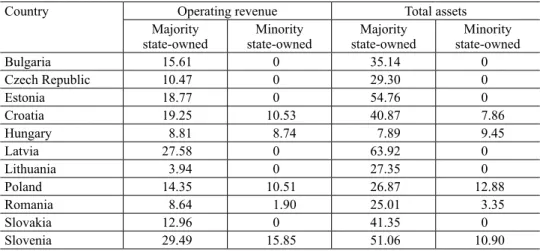
To indicate the scale of state ownership in CEE, the data on operating revenue and total assets were summarised (Table 3). It should be pointed out that the countries with the highest share of majority SOEs in terms of operating revenue
13 The list is available upon request.
14 MOL was classified as a minority SOE despite the fact that the Hungarian State held a lower ownership stake than private investors (holding at least a 5% share) jointly at the end of the years 2014 and 2015. This choice was based on a fact that the state holds special rights con- cerning, among others, election and dismissal of the members of the board of directors, the supervisory board’s decision of the profit distribution (MOL 2017: 171).
Table 3. Operating revenue and total assets of SOEs by countries, 2015, %
Country Operating revenue Total assets
Majority
state-owned Minority
state-owned Majority
state-owned Minority state-owned
Bulgaria 15.61 0 35.14 0
Czech Republic 10.47 0 29.30 0
Estonia 18.77 0 54.76 0
Croatia 19.25 10.53 40.87 7.86
Hungary 8.81 8.74 7.89 9.45
Latvia 27.58 0 63.92 0
Lithuania 3.94 0 27.35 0
Poland 14.35 10.51 26.87 12.88
Romania 8.64 1.90 25.01 3.35
Slovakia 12.96 0 41.35 0
Slovenia 29.49 15.85 51.06 10.90
Source: Own elaboration based on data from Amadeus.
in 2015 were Slovenia (29%) and Latvia (28%). The same indicator for minority SOEs exceeded a level of 10% for Slovenia (16%), Croatia (11%) and Poland (11%). SOEs had a substantially high share in the sum of total assets in Latvia (64%), Slovenia (62%) and Estonia (55%).
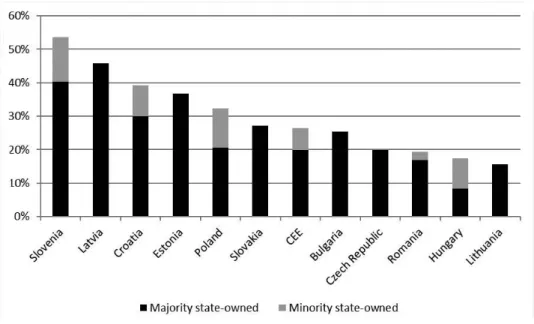
In order to measure the relative importance of SOEs among the largest compa- nies in the CEE region, the ‘Country SOE Index’ was calculated. The index is an equally weighted average of SOE shares of operating revenues and total assets in the dataset.15 It ranges from 0% to 100% – the higher the value, the more substan- tial share of SOEs in the analysed country. Values of the index for 11 countries in the CEE region are presented in Figure 1.
The index value for the whole CEE region was equal to 26%. The country with the highest SOE share of operating revenue and total assets was Slovenia – 54%.
Another country with an index value higher than 40% was Latvia (46%). Three countries with values between 30% and 40% were Croatia (39%), Estonia (37%) and Poland (32%). Slovakia and Bulgaria had a SOE share close to the value of the whole analysed region – 27% and 25%, respectively. Four countries obtained index values below 20%: the Czech Republic (19.89%), Romania (19.45%), Hungary (17%) and Lithuania (16%). When compared to the year 2014, the most substantial declines in the ‘Country SOE Index’ in 2015 were for Slovenia (–5.62 percentage points) and Romania (–3.47 p.p.). An increase of the state share among largest enterprises was recorded in one country – Bulgaria (+1.22% p.p).
Countries with the highest share of minority SOEs were Slovenia (13%) and Poland (12%). At the same time, this group of enterprises accounted for almost a half of the value of the index in Hungary (9% out of 17%). If companies control- led by the state without a majority stake were not taken into account, the state share in the CEE region would be 24% less.
Slovenia appears to be the country with the most substantial state share among largest enterprises. Similar conclusions are presented in the report by the EC (2016). Moreover, it is pointed out that the Slovenian SOEs are present in sectors where state involvement is less pronounced in other countries (such as manu- facturing and tourism). In the report, Poland, Croatia and Romania were also mentioned as countries with extensive scopes of public ownership. At the country level, a comparison to the study of Bałtowski – Kozarzewski (2016) for Polish enterprises can be made. They pointed out that state-owned and state-controlled enterprises accounted for, respectively, 9.8% and 6.3% in the sum of revenues in the whole non-financial sector in Poland in 2013. Among the 500 largest Polish
15 A similar approach was employed by Kowalski et al. (2013) that also considered employment in their index. We decided not to include the number of employees due to the problem of miss- ing data.
companies, these values equalled 14.0% and 14.5%. In our study, companies with a state stake above 50% had a share of 14% in operating revenue and minority SOEs – 11%. This shows that both analyses lead to similar conclusions on the scale of state ownership in Poland and by not considering enterprises that are controlled by the state with the minority stake the state share would be substan- tially less. Szarzec – Nowara (2017) analysed Slovakia’s largest companies and show that the SOEs accounted for 13% of turnover in 2013, while the operating revenue value in our study equalled 13% in 2015. Similarly, based on data from the EC (2016), the Romanian SOEs (with at least 50% state stake) had a share of 7.1% in revenues in 2013 as compared to 8.64% in 2015 in our research. Such comparison shows that based on individual-level data and a precisely defined classification as SOEs, one can obtain more precise measures of state involve- ment as an owner.
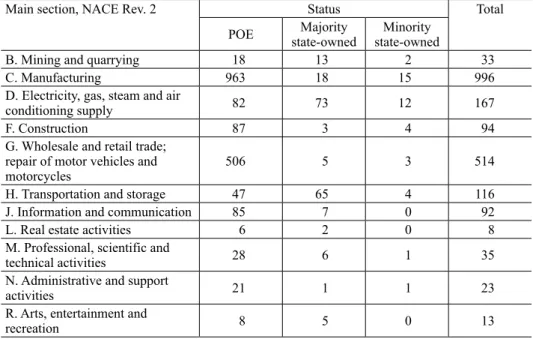
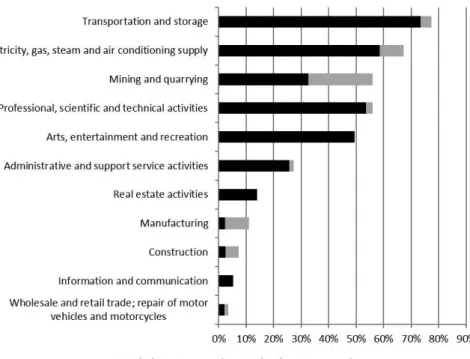
The sector structure of the largest enterprises in the CEE region is presented in Table 4. The manufacturing section was dominant (996 entities) in the group of largest companies in CEE. Most SOEs were classified as electricity, gas, steam and air conditioning supply (85 SOEs) and transportation and storage (69 SOEs).
The share of enterprises controlled by the state was also substantial in mining and quarrying (15 SOEs of 33 entities) and arts, entertainment and recreation (5 SOEs of 13 companies).
Figure 1. Country SOE Index, 2015 Source: Own elaboration based on Amadeus database.
The ‘Sector SOE Index’ was employed to compare the state share in terms of operating revenue and total assets by sector. Figure 2 shows the index values in 2015. The highest state share was indicated in the transportation and storage sec- tor – 77%. This was driven by the fact that the largest enterprises in this sector operated in rail transportation and pipeline transportation, which were dominated by the state.
Another sector with a substantial state share was electricity, gas, steam and air conditioning supply (67%). 6 of the 10 largest natural gas distribution companies in terms of assets were state-owned in 2015. At the same time, there were seven SOEs among the 10 largest enterprises in electric power generation, transmission and distribution.
The index value was also higher than 50% in mining and quarrying and profes- sional, scientific and technical activities (56% each). In the first sector, the largest SOEs were operating in metal ore mining, coal mining and oil and gas extrac- tion. In the second one, the value was driven by the fact that PGE Polska Grupa Energetyczna S.A., Polskie Koleje Państwowe S.A. and Cesky Aeroholding, a.s.
were classified as operating in the management of companies and enterprises. All of them are parent companies of subsidiaries operating mainly in, respectively, energy supply, rail and air transportation. This shows that, by employing consoli-
Table 4. Number of large enterprises by sectors, 2015
Main section, NACE Rev. 2 Status Total
POE Majority
state-owned Minority state-owned
B. Mining and quarrying 18 13 2 33
C. Manufacturing 963 18 15 996
D. Electricity, gas, steam and air
conditioning supply 82 73 12 167
F. Construction 87 3 4 94
G. Wholesale and retail trade;
repair of motor vehicles and
motorcycles 506 5 3 514
H. Transportation and storage 47 65 4 116
J. Information and communication 85 7 0 92
L. Real estate activities 6 2 0 8
M. Professional, scientific and
technical activities 28 6 1 35
N. Administrative and support
activities 21 1 1 23
R. Arts, entertainment and
recreation 8 5 0 13
Source: Own elaboration based on data from Amadeus.
dated accounts, one cannot account for the broad range of activities of the holding companies and conglomerates, and that the share of such enterprises in particular sectors can be either overestimated or underestimated.
Besides all this, 49% of SOEs were recorded in the arts, entertainment and recreation sector. This was due to state control over the largest companies in the gambling industries in Hungary, Poland, Romania, Slovakia and Slovenia.
The index value for the sector with the highest number of observations in the dataset – manufacturing – was equal to 10.5%. The share of minority SOEs was the highest in the mining and quarrying (23%), electricity, gas, steam and air conditioning supply (9%) and manufacturing (8%) sectors.
The dominant role of the state in the energy and transport sectors in the CEE countries was already indicated by the EC (2016). The presence of companies controlled by the state in these sectors is often justified by the need to correct market failures and to provide essential services at lower prices in less competi- tive markets. Kowalski et al. (2013) pointed out that mining, the extraction of crude petroleum and gas and transport were sectors with the highest state share in the group of the world’s largest companies. Szarzec – Nowara (2017) showed
Figure 2. Sector SOE Index, 2015 Source: Own elaboration based on data from Amadeus.
that there was at least one energy supplier controlled by the government among the largest enterprises in each of the 13 analysed countries of CEE. Therefore, it may be said that the results in our study are in line with the conclusions presented in the literature.
4. DETAILED ANALYSIS
State intervention through enterprises is often justified as a means to correct mar- ket failures or to provide services to society at subsidized and/or controlled prices and good quality. SOEs might also be used to foster innovativeness, to protect employment in a particular sector or region and as a tool of international expan- sion (Bałtowski – Kwiatkowski 2017). Bozec et al. (2002) pointed out that the main reason for setting up SOEs is rarely maximisation of profit and this im- pacts on their financial performance. Nevertheless, profitability and efficiency of state companies might be substantially lower even when they pursue the same set of goals as their privately-owned counterparts. It might be due to soft budget constraints, corruption or rent-seeking behaviours or a combination of all these reasons (Kornai 1986; Estrin – Perotin 1991; Vickers – Yarrow 1991; Shleifer – Vishny 1997; Shleifer 1998; Toninelli 2000).
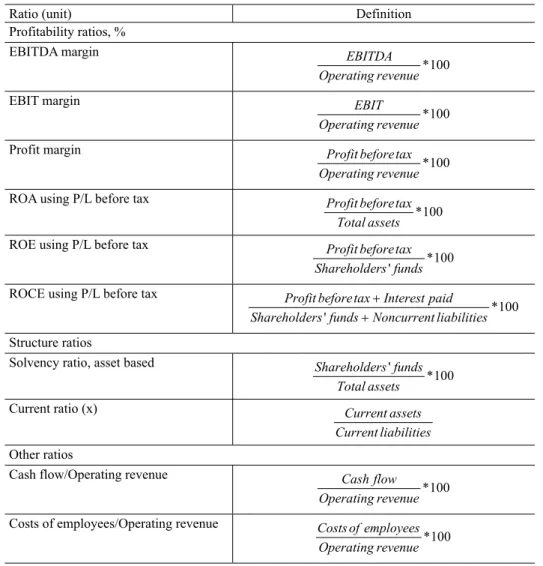
In this study, the financial performance of SOEs is assessed with a focus on the profitability, the efficiency with which they use their capital and labour and the ability to meet their short-term and long-term obligations. 10 ratios from the Amadeus database16 are employed to compare the financial performance of SOEs (including both majority and minority SOEs) to the group of POEs.
One of the most commonly used methods of analysing the differences among group means is the analysis of variance (ANOVA) (StatSoft 2006). Its purpose is to test differences in means by partitioning the total variance into components that are due to true random error (within group, SS error) and differences between means caused by analysed factors (treatments, SS effects). The latter variance components are tested for statistical significance with the null hypothesis that there are no differences between means. As it was discussed in the previous part, the numbers of SOEs differ substantially among the different sectors, therefore in the ANOVA analysis one needs to also address the issue that the values of ratios may be different due to operation in various sectors of the economy. For this rea- son, it was decided to employ the two-way ANOVA with independent variables indicating ownership status and the sector in which a particular enterprise oper- ates (based on the NACE Rev. 2, main section classification (Eurostat 2008)).
16 The formulae are presented in Table A1 in the Appendix.
ANOVA is a parametric test that assumes that analysed data are normally dis- tributed. This assumption was tested for the values of the employed ratios and it was shown that each of them was not normally distributed. However, in the literature (Harwell et al. 1992), it was indicated that when the number of obser- vations is sufficiently high, due to the central limit theorem the violation of the assumption on normal distribution does not significantly influence the value of the F-test and does not lead to an increase in the false positive rate in ANOVA.
Therefore, it can be argued that the two-way ANOVA is an appropriate method for this study. Nevertheless, to avoid the incorrect rejection of a true null hy- pothesis and to check the robustness of the results, it was decided to conduct an additional analysis with a nonparametric test that does not require the assumption of normal distributions.
The Mann-Whitney U test allows to check if there are significant differences in medians between two groups and the null hypothesis states that there are no statistically significant differences. The test is based on the U statistic that is cal- culated by assigning numeric ranks to all observations from both groups, adding up the ranks for observations from the same group and adjusting by the group sample size (StatSoft 2006).
In the next two parts, the results of the analysis using the two-way ANOVA and the Mann-Whitney test are presented. Tests were conducted for each of the ratios.
In the two-way ANOVA, first-order (non-interactive) effects of ownership status and sectors were analysed. Since the Mann-Whitney U test is a nonparametric test that checks differences in medians due to one factor (ownership status), it was decided to also provide results for smaller samples to address the problem of different levels of ratios between sectors.
5. RESULTS AND ROBUSTNESS CHECK
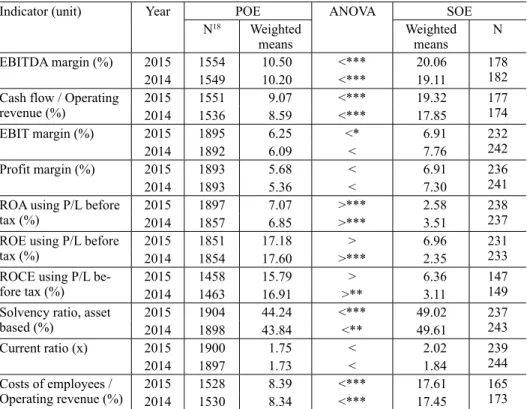
Table 5 shows whether differences between means due to ownership status are statistically significant based on the two-way ANOVA.17 The results reveal that there are significant differences (at the 1% level) in the means of the EBITDA margin and cash flow to operating revenue ratios in both the analysed years. It shows that SOEs were characterised by higher earnings (before interest taxes, de- preciation and amortisation) on operating revenue and a higher ability to generate cash from revenues. However, when depreciation and amortisation were consid- ered, means differed significantly only at the 10% level in 2015. In the case of
17 Detailed results of the two-way ANOVA and descriptive statistics of the ratios are available from the authors upon request.
the profit margin before tax, it should be pointed out that despite the fact that the weighted means were slightly higher for the SOE group, these differences were statistically insignificant.
In the next step, returns on assets, shareholders’ funds and capital employed were compared. Results suggest that POEs recorded higher profits from the capi- tal they used – this may be interpreted as an indicator of their higher efficiency.
All differences were significant at least at the 5% level in 2014. The ROA ratio was also substantially higher in the group of POEs in 2015, however, the ROE and ROCE ratios did not differ significantly at the 10% level despite the higher weighted means of the POEs.
18 The number of observations varies due to missing data for some ratios, from 1612 to 2141 in 2014 and from 1605 to 2139 in 2015.
Table 5. Two-way ANOVA of financial ratios
Indicator (unit) Year POE ANOVA SOE
N18 Weighted
means Weighted
means N
EBITDA margin (%) 2015 1554 10.50 <*** 20.06 178
2014 1549 10.20 <*** 19.11 182
Cash flow / Operating
revenue (%) 2015 1551 9.07 <*** 19.32 177
2014 1536 8.59 <*** 17.85 174
EBIT margin (%) 2015 1895 6.25 <* 6.91 232
2014 1892 6.09 < 7.76 242
Profit margin (%) 2015 1893 5.68 < 6.91 236
2014 1893 5.36 < 7.30 241
ROA using P/L before
tax (%) 2015 1897 7.07 >*** 2.58 238
2014 1857 6.85 >*** 3.51 237
ROE using P/L before
tax (%) 2015 1851 17.18 > 6.96 231
2014 1854 17.60 >*** 2.35 233
ROCE using P/L be-
fore tax (%) 2015 1458 15.79 > 6.36 147
2014 1463 16.91 >** 3.11 149
Solvency ratio, asset
based (%) 2015 1904 44.24 <*** 49.02 237
2014 1898 43.84 <** 49.61 243
Current ratio (x) 2015 1900 1.75 < 2.02 239
2014 1897 1.73 < 1.84 244
Costs of employees /
Operating revenue (%) 2015 1528 8.39 <*** 17.61 165
2014 1530 8.34 <*** 17.45 173
Notes: ***1%, **5%, *10% significance levels. N = number of observations. A SOE group consists of both majority and minority state-owned enterprises.
Source: Own elaboration with Statistica based on data from Amadeus.
A substantially higher share of shareholders’ funds in total assets was observed in the SOE group in both of the analysed years. This shows that SOEs were sig- nificantly less leveraged than privately-owned counterparts. At the same time, there were no significant differences in the means of the current ratio. Therefore, one can point out that the ability to pay its short-term obligations did not differ significantly between the POE and SOE groups.
The costs of employees to operating revenue were significantly higher (at the 1% level) in the SOE group in 2014 and 2015, which could suggest that SOEs were overemployed and/or their employees were overpaid.
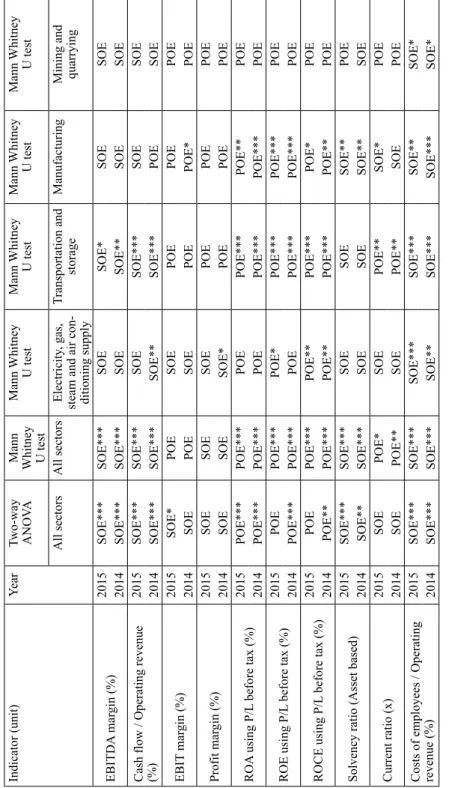
The Mann Whitney U test was employed to check the robustness of the results.
The test was conducted for all enterprises in the dataset and by particular sectors (electricity, gas, steam and air conditioning supply; manufacturing; transportation and storage; mining and quarrying).19 The results of the test are summarised in Table A2 in the Appendix.20
An analysis of the whole dataset indicates that SOEs had a substantially higher EBITDA margin and cash flow to operating revenue ratios. When division by sector was considered, differences were significant in transportation and storage.
As previously, the test values of EBIT and profits margins lead to ambiguous conclusions.
The ROA, ROE and ROCE ratios were higher in the group of POEs in each specification. All differences in the median values were statistically significant in the whole dataset and individually for the transportation and storage and manu- facturing sectors.21 In the energy sector, the ROCE ratio was substantially higher in both the analysed years.
SOEs had a higher median value for the solvency ratio (apart from mining and quarrying in 2015), which shows that they were less leveraged and had a higher ability to meet long-term obligations. Differences were statistically significant in the whole dataset and manufacturing. At the same time, the median of the current ratio, which is a measure of the ability to pay short-term obligations, was substan- tially higher when all sectors were considered and in transportation and storage.
Costs of employees to operating revenue were higher among SOEs and differ- ences were statistically significant in each specification.
19 The number of SOEs exceeded a level of 10 in each of the selected sectors. This threshold was set to avoid the problem of a small sample size. SOEs from these four sectors accounted for 84% (2015) and 85% (2014) of the total number of SOEs in the dataset.
20 Detailed results are available upon request from the authors.
21 There were no substantial differences indicated in mining and quarrying, however it should be pointed out that one needs to treat results in this sector with caution due to the small sample size (18 POEs and 15 SOEs in 2015).
6. CONCLUSIONS
Our analysis shows that the state is still a significant player in the national econ- omy of the CEE countries, though the scale of state ownership varies. We esti- mated the real share of state ownership including companies with a minority but controlling stake by the state, which is neglected in a lot of research. Without minority SOEs the scale of state ownership in the region would be lessened by approximately one-quarter. In order to compare the economic weight of SOEs in countries and sectors, we introduced two SOE indices. The ‘Country SOE Index’
is the highest in Slovenia, Latvia and Croatia, while the lowest in Hungary and Lithuania. The ‘Sector SOE Index’ values show that the main sections H (trans- portation and storage) and D (energy supply) were dominated by the state.
Analysis employing two-way ANOVA and its robustness check reveal that the SOEs had a higher EBITDA margin and cash flow to operating revenue ratios, this suggests their stronger market position and a higher ability to generate cash from revenues. When EBIT and profit margins were considered as measures of profitability, no substantial differences were indicated. POEs were characterised by higher returns on assets, shareholders’ funds and capital employed ratios. This indicates that the capital in SOEs was employed less efficiently than in POEs.
SOEs were less leveraged and did not have a substantially higher ability to cover their short-term obligations. Significantly higher employee costs to operating revenue suggest overemployment and/or the fact that workers were overpaid and may be an indicator of the inefficiency of state-owned companies. These results suggest that SOEs have still the potential to improve their corporate governance and financial results.
Our results are in line with other literature indicating that SOEs are character- ised by lower returns on the capital employed and higher employee costs. At the same time, the higher cash flow to operating revenue ratio and EBITDA margin may suggest that SOEs use their market power to keep more favourable terms of sales and to increase margins. This may contradict the hypothesis that the poorer performance of SOEs is an effect of incurring the social burden of providing es- sential services at lower prices. This issue, along with consumer costs, should be addressed in further research. Furthermore, we believe that for each SOE there is a need to explicitly indicate a set of goals that such an entity fulfils. This will al- low assessing more precisely costs and gains of state intervention through enter- prises, considering not only financial performance but also other aims, including political and social ones.
REFERENCES
Abramov, A. – Radygin, A. – Entov, R. – Chernova, M. (2017): State Ownership and Effi ciency Characteristics. Russian Journal of Economics, 3: 1–23.
Bałtowski, M. – Kozarzewski, P. (2016): Formal and Real Ownership Structure of the Polish Econ- omy: State-Owned Versus State-Controlled Enterprises. Post-Communist Economies, 28(3):
405–419.
Bałtowski, M. – Kwiatkowski, G. (2017): Przedsiębiorstwa państwowe we współczesnej gospodar- ce (State-Owned Enterprises in the Contemporary Economy). Warszawa: PWN.
Borghi, E. – Del Bo, C. – Florio, M. (2016): Institutions and Firms’ Productivity: Evidence from Electricity Distribution in the EU. Oxford Bulletin of Economics and Statistics, 78(2): 170–
196.
Bortolotti, B. – Cambini, C. – Rondi, L. (2013): Reluctant Regulation. Journal of Comparative Economics, 41(3): 804–828.
Bortolotti, B. – Faccio, M. (2004): Reluctant Privatization. Nota di Lavoro, Fondazione Eni Enrico Mattei, No. 130.2004. Milano: Fondazione Eni Enrico Mattei.
Boyer, R. (2006): Half a Century of Development Theories. An Institutional Survey. In: Stathakis, G. – Vaggi, G. (eds): Economic Development and Social Change. Historical Roots and Modern Perspectives. London – New York: Routledge, pp. 29–73.
Böwer, U. (2017): State-Owned Enterprises in Emerging Europe: The Good, the Bad, and the Ugly.
IMF Working Paper, No. 17(221), Washington.
Bureau van Dijk (2017): Amadeus Database. https://amadeus.bvdinfo.com/.
Christiansen, H. (2013): Balancing Commercial and Non-Commercial Priorities of State-Owned Enterprises. OECD Corporate Governance Working Papers, No. 6. Paris: OECD Publishing.
Clearstream (2018): Disclosure Requirements. http://www.clearstream.com/.
EBRD (1999): Transition Report 1999. Ten Years of Transition. London.
EMIS (2017): EMIS Emerging Markets Information Services. http://www.emis.com/.
Estrin, S. – Perotin, V. (1991): Does Ownership Always Matter? International Journal of Industrial Organization, 9(1): 55–72.
European Commission (2016): State-Owned Enterprises in the EU: Lessons Learnt and Ways For- ward in a Post-Crisis Context. Institutional Paper, No. 031. Luxembourg: Publishing Offi ce of the European Union.
Eurostat (2008): NACE Rev. 2: Statistical classifi cation of Economic Activities in the European Community. Luxembourg: European Communities.
Florio, M. (2014): The Return of Public Enterprise. Centre for Industrial Studies (CSIL) Working Papers. Milano, Italy.
Goldeng, E. – Grünfeld, L. – Benito, G. (2008): The Performance Differential between Private and State Owned Enterprises: The Roles of Ownership, Management and Market Structure. Journal of Management Studies, 45(7): 1244–1273.
Götz, M. – Jankowska, B. (2017): Outward Foreign Direct Investment by Polish State-Owned Multinational Enterprises: Is ‘Stateness’ an Asset or a Burden? Post-Communist Economies, 30(2): 216–237.
Harwell, M. R. – Rubinstein, E. N. – Hayes, W. S. – Olds, C. C. (1992): Summarizing Monte Carlo Results in Methodological Research: The One- and Two-Factor Fixed Effects ANOVA Cases.
Journal of Educational and Behavioral Statistics, 17(4): 315–339.
Irwin, D. A. (2008): Infant-Industry Protection. In: Durlauf, S.N. – Blume, L. E. (eds): The New Palgrave Dictionary of Economics. London: Palgrave Macmillan.
Kornai, J. (1986): The Soft Budget Constraint. Kyklos, 39(1): 3–30.
Kornai, J. (2006): The Great Transformation of Central Eastern Europe: Success and Disappoint- ment. Economic Transition, 14(2): 207–244.
Kowalski, P. – Buge, M. – Sztajerowska, M. – Egeland, M. (2013): State-Owned Enterprises: Trade Effects and Policy Implications. OECD Trade Policy Papers, No. 147. Paris: OECD Publis- hing.
Kozarzewski, P. (2006): Prywatyzacja w krajach postkomunistycznych (Privatisation in Post-Socia- list Countries). Warszawa: Instytut Nauk Politycznych PAN.
Kozarzewski, P. – Bałtowski, M. (2016): Change in Economic Policy Paradigm: Privatization and State Capture in Poland. CASE Working Papers, No. 3.
Liao, S. – Zhang, Y. (2014): A New Context for Managing Overseas Direct Investment by Chinese State-Owned Enterprises. China Economic Journal, 7(1): 126–140.
Lin, J. Y. – Monga, C. (2012): The Growth Report and New Structural Economics. In: Lin, J.Y.
(eds): New Structural Economics. A Framework for Rethinking Development and Policy. Wash- ington: The World Bank.
MOL (2017): MOL Group Annual Report 2016. Budapest, Hungary: MOL. https://molgroupp.
info/images/molgroup/pdf/investor_relations/annual_general_meeting/documents/mol_group_
annual _report_2016_en_0606.pdf.
OECD (2005): OECD Comparative Report on Corporate Governance of State-Owned Enterprises.
Paris: OECD Publishing.
OECD (2017): The Size and Sectoral Distribution of State-Owned Enterprises. Paris: OECD Pub- lishing.
Privatization – What’s Next (2013): Report from the Conference about the Future of the Public Sec- tor (Warsaw 13 May 2013). CASE − Ministry of Treasury of the Republic of Poland – OECD.
https://msp.gov.pl/download/3/3737/privatisationwhatsnextenglishreportfi nal.
Putniņš, T. J. (2015): Economics of State-Owned Enterprises. International Journal of Public Ad- ministration, 38(11): 815–832.
Roland, R. (2008): Privatization. Successes and Failures. New York: Columbia University Press.
Shleifer, A. (1998): State versus Private Ownership. Journal of Economic Perspectives, 12(4):
133–150.
Shleifer, A. – Vishny, R. W. (1997): A Survey of Corporate Governance. The Journal of Finance, 52 (2): 737–783.
Snowdon, B. (2007): Globalisation, Development and Transition. Cheltenham UK–Northampton USA: Edward Elgar.
StatSoft (2006): Elektroniczny Podręcznik Statystyki PL (Electronic Statistical Handbook). Kraków, Poland.
Szanyi, M. (2016): The Reversal of the Privatisation Logic in Central European Transition Econo- mies. Acta Oeconomica, 66(1): 33–55.
Szarzec, K. – Nowara, W. (2017): The Economic Performance of State-Owned Enterprises in Central and Eastern Europe. Post-Communist Economies, 29(3): 375–391.
Thomson Reuters (2017): EIKON Thomson Reuters, https://fi nancial.thomsonreuters.com/en/
products/tools-applications/trading-investment-tools/eikon-trading-software-c.html.
Toninelli, P. A. (ed.) (2000): The Rise and Fall of Public Enterprise in the Western World. Cam- bridge: Cambridge University Press.
Vickers, J. – Yarrow, G. (1991): Economic Perspectives on Privatization. The Journal of Economic Perspectives, 5(2): 111–132.
APPENDIX
Table A1. Financial ratios from the Amadeus database
Ratio (unit) Definition
Profitability ratios, % EBITDA margin
EBITDA *100 Operating revenue EBIT margin
EBIT *100 Operating revenue Profit margin
Profit beforetax *100 Operating revenue ROA using P/L before tax
Profit beforetax*100 Total assets ROE using P/L before tax
' *100 Profit beforetax Shareholders funds ROCE using P/L before tax
' *100
Profit beforetax Interest paid Shareholders funds Noncurrent liabilities
Structure ratios
Solvency ratio, asset based '
Shareholders funds*100 Total assets
Current ratio (x) Current assets
Current liabilities Other ratios
Cash flow/Operating revenue
Cash flow *100 Operating revenue Costs of employees/Operating revenue
Costs of employees*100 Operating revenue Source: Own elaboration based on the Amadeus database, 2017.
Table A2. Robustness check Indicator (unit)Year
Two-way ANOV
AMann Whitney U test
Mann Whitney U testMann Whitney U testMann Whitney U testMann Whitney U test All sectorsAll sectorsElectricity, gas,
steam and air con- ditioning supply
Transportation and storageManufacturing
Mining and quarrying
EBITDA margin (%)2015SOE***SOE***SOESOE*SOESOE 2014SOE***SOE***SOESOE**SOESOE
Cash flow / Operating revenue (%)
2015SOE***SOE***SOESOE***SOESOE 2014SOE***SOE***SOE**SOE***POESOE EBIT margin (%)2015SOE*POESOEPOEPOEPOE 2014SOEPOESOEPOEPOE*POE Profit margin (%)2015SOESOESOEPOEPOEPOE 2014SOESOESOE*POEPOEPOE ROA using P/L before tax (%)2015POE***POE***POEPOE***POE**POE 2014POE***POE***POEPOE***POE***POE ROE using P/L before tax (%)2015POEPOE***POE*POE***POE***POE 2014POE***POE***POEPOE***POE***POE ROCE using P/L before tax (%)2015POEPOE***POE**POE***POE*POE 2014POE**POE***POE**POE***POE**POE Solvency ratio (Asset based)2015SOE***SOE***SOESOESOE**POE 2014SOE**SOE***SOESOESOE**SOE Current ratio (x)2015SOEPOE*SOEPOE**SOE*POE 2014SOEPOE**SOEPOE**SOEPOE
Costs of employees / Operating revenue (%)
2015SOE***SOE***SOE***SOE***SOE**SOE* 2014SOE***SOE***SOE**SOE***SOE***SOE* Notes: ***1%, **5%, *10% significance levels. SOE and POE denote that a weighted mean (two-way ANOVA) or a median (Mann Whitney U test) is higher in the group of, respectively, SOEs or POEs. A SOE group consists of both majority and minority SOEs. Source: Own elaboration.