Data in Brief 31 (2020) 105877
ContentslistsavailableatScienceDirect
Data in Brief
journalhomepage:www.elsevier.com/locate/dib
Data Article
Hydrochemical data on groundwater quality for drinking and irrigation use around Dangila town, Northwest Ethiopia
Mulugeta C. Fenta
a,b,∗, Zelalem L. Anteneh
b, János Szanyi
a, David Walker
c,daUniversity of Szeged, Department of Mineralogy, Geochemistry and Petrology, Egyetem street 2, 6722, Szeged, Hungary.
bBahir Dar University, School of Earth Science, P.O. Box 79, Bahir Dar, Ethiopia.
cNewcastle University, School of Engineering, Newcastle upon Tyne, UK.
dKyushu University, Faculty of Design, Fukuoka, Japan.
a rt i c l e i n f o
Article history:
Received 14 May 2020 Revised 9 June 2020 Accepted 10 June 2020 Available online 18 June 2020 Keywords:
Hydrochemical Groundwater Water quality Drinking Irrigation Ethiopia
a b s t r a c t
The groundwater ofvolcanic aquifers, dissected by various structuresand affectedbyseveralvolcaniceruptionevents, variesinquality.Alargenumber ofruralpeopledependon shallowaquiferstappedbyshallowhandwellsandsprings.
On the otherhand, the urban population isdependant on deepaquifersusingdrilledboreholes.Thelocationofsprings, shallow hand-dug wells and boreholes inside or close to farmlands,andtheadvancementofirrigationwaterusefrom groundwater by the government entail the assessment of groundwater quality. Therefore, the focus of the present studyistodetermine thequalityand suitabilityofground- water around DangilaTown,Northwest Ethiopia,for drink- ing and irrigation uses. The water quality assessment was conductedbycollectinggroundwatersamplesfrom14shal- low hand-dug wells, 4springs, and 7deep boreholesthen analysingfordifferentphysicalandchemicalparameters.
A total of 25 selected groundwater samples from shallow and deepaquiferswereanalysed inalaboratory forphysi- calandchemicalparameters.Thephysicalparametersmea- suredbothinthefieldandthelaboratoryincludedpH,elec-
DOI of original article: 10.1016/j.gsd.2020.100408
∗ Corresponding author.
E-mail address: mulugeta@geo.u-szeged.hu (M.C. Fenta).
https://doi.org/10.1016/j.dib.2020.105877
2352-3409/© 2020 The Author(s). Published by Elsevier Inc. This is an open access article under the CC BY-NC-ND license. ( http://creativecommons.org/licenses/by-nc-nd/4.0/ )
2 M.C. Fenta, Z.L. Anteneh and J. Szanyi et al. / Data in Brief 31 (2020) 105877
tricalconductivity(EC)andtotaldissolvedsolids(TDS).The chemical parameters analysed inthe laboratory comprised cations ofcalcium(Ca2+),magnesium(Mg2+), sodium(Na+), potassium (K+), Iron (Fe),manganese (Mn2+)and anionsof bicarbonate(HCO3-),sulfate(SO42-),carbonate(CO32-),chlo- rine(Cl-),nitrate (NO3-), fluoride(F-), andboron(B). Based on the laboratory results,the variation in groundwater fa- cies, and majorcationand anionsourcesweredetermined.
Furthermore, thegroundwaterquality forhuman consump- tion was assessedand sodiumadsorption ratio (SAR),Na%, and the residualsodiumcarbonate (RSC)values,whichare crucialtodeterminetheoverallgroundwaterqualityforirri- gationaluses,werecalculated.Detailedinterpretationsofthe datahavebeen presentedinthe paperentitled“Hydrogeo- logical frameworkofthevolcanicaquifersandgroundwater qualityinDangilaTownandthesurroundingarea,Northwest Ethiopia” [1].Thepresenteddatasetdemonstratestheneces- sity ofwater quality assessments that wouldbe helpful to watersectors,government,andpolicymakersforsustainable groundwatermanagement.
© 2020 The Author(s). Published by Elsevier Inc.
ThisisanopenaccessarticleundertheCCBY-NC-ND license.(http://creativecommons.org/licenses/by-nc-nd/4.0/)
SpecificationsTable
Subject Earth and planetary sciences Specific subject area Hydrogeochemistry
Type of data Tables, Figures
How data were acquired The lightweight, portable, and multi-parameter measuring instrument (Hanna HI 991,301, USA) was used to measure pH, electrical conductivity (EC), and total dissolved solids (TDS) values. The atomic absorption spectrometry (novAA 400P, Germany) integrated with ASPECT LS software was used to measure the concentration of cations, and the colourimetry instrument (palintest photometer 7100, UK) was used to measure the concentration of anions.
Data format Raw, Analysed
Parameters for data Collection The new plastic bottles were rinsed with the sample water, and groundwater samples were collected, stored in a cool place, and transported to the laboratory within a day. The samples from shallow hand wells and springs were taken after pouring water for a few minutes, whereas samples from deep boreholes were taken in the middle of the continuous pumping test. Before laboratory analysis, water samples were filtered with a 45-micron filter to remove the suspended particles.
Description of data Collection A total of 14 shallow hand-dug wells, two deep boreholes, and four spring water samples were collected during the dry season (February to April) 2015 and 2017 while the remaining five deep boreholes groundwater samples were collected during their pumping tests. The physical water parameters comprising pH, EC, TDS were measured in the field during sample collection.
The chemical groundwater parameters comprising cations (Ca 2+,Mg 2+,Na +, K +, Mn 2+,Fe) and anions (Cl -, SO 42-, HCO 3-, CO 32-, NO 3-, F -, B) were measured in the laboratory.
Data source location Data area boundaries from world geodetic systems 84 (WGS84) are; longitude:
36.70 to 37.00 0E and latitudes: 11.07 to 11.41 0Naround Dangila Town, Northwest Ethiopia.
Data accessibility Data are included in this article
Related research article Mulugeta C. Fenta, Zelalem L. Anteneh, János Szanyi, David Walker;
Hydrogeological framework of the volcanic aquifers and groundwater quality in Dangila Town and the surrounding area, Northwest Ethiopia. Groundwater for sustainable development [1] .
M.C. Fenta, Z.L. Anteneh and J. Szanyi et al. / Data in Brief 31 (2020) 105877 3
ValueoftheData
• Hydrochemical data presented in this article will enable the society to understand the groundwaterquality ofthe areaasit istheprimary source fortheprovision offreshwater supply.
• The various groundwater datasets will be beneficial to develop effective strategies to strengthentheDangilaTownandsurroundingruralareadrinkingandsmall-scaleirrigation watersupply.
• Thewatersector,government,policymakers,andscientificcommunitycanmakeuseofthese datatocomprehendthehydrochemicalcharacteristicsofvolcanicaquifersoftheareaandto plansustainablegroundwatermanagementsystems.
• Therawandanalyseddatawillserveasabenchmarkforfurtherresearchandstudiesasthe regionlacks hydrochemistrydatasources.Moreover,itcanbe usefulforfurtherinsightson heterogeneoushydrochemicalvolcanicaquiferstocreategroundwaternumericalmodels.
1. DataDescription
This datasetofDangila Town andits surroundingarea of NorthwestEthiopia comprisesof oneFigureand7Tables.Table1,Table2,andTable3consistofgroundwaterphysicalandchem- ical parameters usedto assessgroundwater quality fordrinkingandirrigationusefrom bore- holes,shallowhand-dugwells,andsprings,respectively.Table4containsthequalityofground- watersamplesfordrinkingpurposesbasedontheWHO2011drinkingwaterqualityindex[2]. Table5consistsofthedifferentwaterfaciesofthearea,whereasTable6comprisestheformulas usedtocalculatetheSAR,Na%,andRSCvaluesofgroundwatersamples.Table7consistsofthe calculatedSAR,Na%,andRSCvaluesofallgroundwatersamples.Alldatasetsinthetablescon- taineitherwatersamplelaboratoryanalysisdataorthecalculatedresultsandstatisticalvalues ofminimum,maximum,mean,andstandarddeviationforeachgroundwaterscheme.
2. Experimentaldesign,materials,andmethods 2.1. Studyareadescription
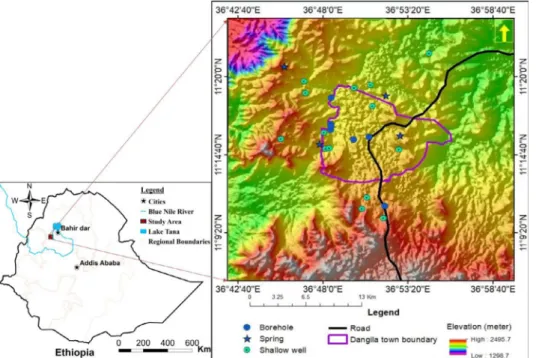
ThecollectionofphysicochemicaldatafromgroundwatersampleswasconductedatDangila town andits surrounding area located in Dangiladistrict, known in Ethiopia asa woreda, in northwestEthiopia(Fig.1).ItissituatedatthesouthwestofLakeTana,whichisthesourceof theBlueNileriver.ItismainlycoveredbyQuaternaryvolcanicrockswithanannualrainfallof 1640mm (measuredsince 1988atthe NationalMeteorological Agency(NMA)weather station at Dangilatown), ofwhich 91% fallsfrom Mayto October. Ithas a moist subtropical climate witha medianannualdaily maximumtemperatureof25 °C anda minimumof9 °C[6].The groundwatersamplingwasaimedtoassessthequalityofbothshallowanddeepaquifersystems of thearea usingexisting springs, shallowhand-dug wells,anddeep boreholes.The sampling siteswerechosentocovertheareawithinthetownanditssurroundingruralvillages.
Atotalof25groundwatersampleswerecollectedfromdeepboreholes(7samples),shallow hand-dugwells(14samples),andsprings(4samples)withplasticbottlesrinsedbysamplewa- teraheadofsampling.Thesampleswerepouredintotheplasticbottlesafterpumpingoutwater for10 mintoremove thestagnant waterfromshallowhand-dug wells.Theboreholesamples were collectedin themiddleofconstantratepumpingteststhatlastedfor24, 36,48,or72h dependingontheplanofthetest.Thespringwatersamplesweresampledatthepointofspring dischargecontinuouslyfromtheground.
4M.C.Fenta,Z.L.AntenehandJ.Szanyietal. / DatainBrief31(2020)105877
Table 1
Hydrochemical and physical data of volcanic aquifers sampled from boreholes. The values of TDS, cations, and anions are given in (mg/L), whereas the EC is ( μS/cm).
Borehole ID pH EC TDS Ca 2+ Mg 2+ Na + K + Mn 2+ Fe Cl - SO 42- HCO 3- CO 32- NO 3- F - B
BH1 6.83 245 159.25 35.34 6.03 15.54 15.1 0.022 0.08 1.9 1 175 0 1 0.63 0.057
BH2 7.84 262 150 23.8 4.9 39 1.7 0.022 BDL ∗ 1.08 8 139 0 0.13 0.25 0
BH3 8.67 290 188.5 27.94 6.921 13.6 10.32 0.005 BDL 0.6 1.8 145 15 1.5 0.34 0.06
BH4 8.4 295 204 36 5.35 25 0.9 BDL BDL 0 1.6 170.6 14.4 4.8 0 0
BH5 8.51 204 124 8 1.95 30 2.6 BDL BDL 2 1.3 90 0 0 1.1 0
BH6 7.44 313 203 8.4 2.8 25.4 7.63 BDL BDL 2.2 0.8 93 0 1.23 0 0
BH7 8.81 335 214 0.97 4.51 34.5 1.86 BDL 0.01 2.5 0.5 97.6 0 1.44 0.64 0
Min 6.83 204 124 0.97 1.95 13.60 0.90 0 0 0 0.5 90 0 0.13 0 0
Max 8.81 335 214 36.00 6.92 39.00 15.10 0.02 0.08 2.5 8 175 15 4.8 1.1 0.06
Mean 8.07 277.71 177.54 20.06 4.64 26.15 5.73 0.01 0.013 1.47 2.14 130.03 4.2 1.44 0.42 0.02
SD 0.73 44.21 33.56 14.20 1.75 9.32 5.43 0.01 0.023 0.93 2.62 36.51 7.18 1.60 0.40 0.03
∗BDL represents below detectable limit for manganese and iron using flame AAS instrument with 0.0 015 mg/L and 0.0 05 mg/L values respectively. These low detection limits of flame AAS instrument values are based on PerkinElmer’s work that determined elemental standards in dilute aqueous solution with a 98% confidence level [3] .
M.C.Fenta,Z.L.AntenehandJ.Szanyietal. / DatainBrief31(2020)1058775 Table 2
Hydrochemical and physical data of volcanic aquifers sampled from shallow wells. The values of TDS, cations, and anions are given in (mg/L), whereas the EC is ( μS/cm).
Shallow well ID pH EC TDS Ca 2+ Mg 2+ Na + K + Mn 2+ Fe Cl - SO 42- HCO 3- CO 32- NO 3- F - B
SW1 6.12 260 169 24.62 2.116 2.78 2.94 0.016 0.01 4.2 0.8 85 0 3 0.66 0.06
SW2 6.07 480 312 25.1 2.14 3.56 3.12 0.006 BDL 0.8 0.5 75 0 11 0.35 0.06
SW3 5.62 70 45.5 6.09 1.98 1.69 1.39 0.029 BDL 6.7 0.8 15 0 1 0.34 0.05
SW4 5.37 90 58.5 23.41 1.89 7.45 3.92 0.029 BDL 2.1 0.8 95 0 3 0.48 0.04
SW5 6.14 160 104 19.81 2.288 3.14 6.52 0.02 BDL 12.5 0.7 60 0 3 0.4 0.05
SW6 6.4 140 91 25.55 2.23 2.45 1.9 0.005 BDL 1.6 1.5 75 0 15 0.44 0.06
SW7 5.53 171.9 87 12.5 2.28 0.08 0.15 BDL 0.01 2.7 1.5 48.8 0 4.85 0.21 0
SW8 6.31 264.4 135 18.07 2.94 2.54 2.29 BDL 1.65 0.7 1.6 97.3 0 1.22 0.56 0
SW9 6.17 174 88 17.4 2.81 4.6 1.54 BDL BDL 1.3 6.2 60.2 0 1.48 0.4 0
SW10 5.83 130.7 66 14.6 2.37 1.73 0.42 BDL 0.2 0.5 1.1 52 0 4.37 0.22 0
SW11 6.88 334.9 172 19.4 3.4 0.08 1.74 BDL 0.01 3.7 1.1 85.2 0 2.9 0.31 0
SW12 5.76 200.4 102 18.4 3.44 0.08 2.13 BDL 0.01 1.3 0.84 90.4 0 3.2 0.32 0
SW13 5.69 196.8 100 18.7 3.12 0.1 1.14 BDL 4.3 1.7 1.4 86.1 0 2.37 0.28 0
SW14 5.99 309.4 159 27.1 3.18 0.19 9.06 BDL 0.7 2.7 1.2 125.4 0 4.12 0.25 0
Min 5.37 70 45.50 6.09 1.89 0.08 0.15 0.00 0 0.5 0.5 15 0 1 0.21 0
Max 6.88 480 312.00 27.10 3.44 7.45 9.06 0.03 4.3 12.5 6.2 125.4 0 15 0.66 0.06
Mean 5.99 213.04 120.64 19.34 2.58 2.18 2.73 0.01 0.49 3.04 1.43 75.03 0 4.32 0.37 0.02
SD 0.40 108.99 67.88 5.74 0.54 2.13 2.42 0.01 1.19 3.19 1.41 26.69 0 3.92 0.13 0.03
BDL ∗represents below detectable limit for manganese and iron using flame AAS instrument with 0.0015 mg/L and 0.005 mg/L values respectively [3] .
6M.C.Fenta,Z.L.AntenehandJ.Szanyietal. / DatainBrief31(2020)105877
Table 3
Hydrochemical and physical data of volcanic aquifers sampled from Springs. The values of TDS, cations, and anions are given in (mg/L), whereas the EC is ( μS/cm). .
Springs ID pH EC TDS Ca 2+ Mg 2+ Na + K + Mn 2+ Fe Cl - SO 42- HCO 3- CO 32- NO 3- F - B
SP1 5.64 75 48.75 18.55 1.99 2.09 2.35 0.002 BDL 0.8 5 50 0 6.82 0.65 0.06
SP2 5.53 40 26 3.58 1.8 1.67 1.45 0.012 BDL 1.7 0.8 15.5 0 0.8 0.82 0.3
SP3 6 189.6 97 23.3 3.87 0.8 1.24 BDL 0.01 1.2 1.1 91.2 0 2.5 0.37 0
SP4 5.31 48.67 24 14.1 2.42 0.08 5.13 BDL 0.01 0.8 2.4 50.2 0 2.34 0.8 0
Min 5.31 40 24 3.58 1.80 0.08 1.24 0.00 0.00 0.80 0.80 15.50 0 0.80 0.37 0.00
Max 6.00 189.60 97 23.30 3.87 2.09 5.13 0.01 0.01 1.70 5.00 91.20 0 6.82 0.82 0.30
Mean 5.62 88.32 48.94 14.88 2.52 1.16 2.54 0.00 0.01 1.13 2.33 51.73 0 3.12 0.66 0.09
SD 0.29 69.14 33.95 8.42 0.94 0.90 1.79 0.01 0.00 0.43 1.91 30.96 0 2.59 0.21 0.14
BDL ∗represents below detectable limit for manganese and iron using flame AAS instrument with 0.0015 mg/L and 0.005 mg/L values respectively [3] .
M.C.Fenta,Z.L.AntenehandJ.Szanyietal. / DatainBrief31(2020)1058777
Table 4
Quality of groundwater samples from the study area for drinking purposes based on the WHO 2011 drinking water quality index [2] . The values of TDS, cations, and anions are given in (mg/L), whereas the EC is ( μS/cm).
Water quality parameter Measured ranges of samples WHO (2011) maximum allowable limit Samples above allowable limit Boreholes Shallow wells Springs
pH 6.83–8.81 5.37–6.88 5.31–6.00 6.5–8.5 3 borehole samples
EC 204–335 70- 480 40–189.60 10 0 0 μS/cm Nil
TDS 124–214 45.50–312 24–97 500 mg/L Nil
Ca +2 0.97–36 6.09–27.1 3.58–23.3 75 mg/L Nil
Mg +2 1.95–6.92 1.89–3.44 1.80–3.87 50 mg/L Nil
Na + 13.60–39 0.08–7.45 0.08 -2.09 200 mg/L Nil
Fe BDL-0.08 BDL-4.3 BDL-0.01 0.4 mg/L 2 shallow well samples
HCO 3- 90–175 15–125.4 15.50–91.20 120 mg/L 4 borehole and one shallow well samples
SO 4–2 0.5–8 0.5–6.2 0.80–5 250 mg/L Nil
Cl - 0–2.5 0.5–12.5 0.80–1.70 250 mg/L Nil
NO 3- 0.13–4.8 1–15 0.80–6.82 50 mg/L Nil
F - 0–1.1 0.21–0.66 0.37–0.82 1.5 mg/L Nil
BDL ∗represents below detectable limit for iron using flame AAS instrument with 0.005 mg/L value [3] .
8 M.C. Fenta, Z.L. Anteneh and J. Szanyi et al. / Data in Brief 31 (2020) 105877 Table 5
The different groundwater facies of the area.
No. Water scheme Sample quantity Water facies type
1. SP 1 Ca-HCO 3
SW 7
2. SP 3 Ca-Mg-HCO 3
SW 5
3. BH 2 Ca-Na-HCO 3
4. BH 3 Na-Ca-HCO 3
5. BH 1 Ca-Na-Mg-HCO 3
6. BH 1 Na-HCO 3
7. SW 1 Ca-Mg-HCO 3-Cl
8. SW 1 Ca-HCO 3-Cl
Table 6
The formulas used to calculate groundwater parameters for irrigation use.
Indices Formula
Sodium adsorption ratio (SAR) SAR = Na+
(Ca2++Mg2+) 2
based on Suarez et al., [4] . Sodium percentage (Na%) Na% = [ (Ca2++MgN2+a++Na++K+)]x100 based on the
United States Salinity Laboratory Staff[5] . Residual sodium carbonate (RSC) RSC = (HCO 3-+ CO 32-)- (Ca 2++ Mg 2+).
Where Na +, Ca 2+, Mg 2+, K +, HCO 3-and CO 32-are in meq/L.
The samples were separately labelled with sample identification (ID) and water schemes, suchasBH1 torepresentboreholegroundwater sampleno.1,andstoredat10 °Ctemprature before analysis fordifferent physicochemical parameters. The pH, electrical conductivity (EC), andtotal dissolvedsolids(TDS) wereanalysed inthefieldusinga pH/EC/TDSmulti-parameter measuringinstrument(HannaHI991,301,USA).Thedevice ischaracterisedbyhavingsimulta- neouspH, EC/TDS, andtemperature measurements ona large three-line liquidcrystaldisplay (LCD). During the measurement of EC/TDS, the probe wasplaced in the samplewater to be tested, andplasticbeaker containerswere used tominimiseany electromagneticinterference.
ThevalueofEC,TDS,andtemperaturewastakenafterthetemperaturesensorreachesthermal equilibrium.ThemetrewasregularlycalibratedforpHbyimmersionoftheprobeinpurewater withaneutralpHof7.0beforepHmeasurements.
Theatomicabsorptionspectroscopy(AAS)(novAA400P,Germany)wasusedtoanalyse the cationconcentration ofthe groundwater samples.The cation concentrationswere determined usinga flame technology system inthe laboratory that has a typical characteristic feature of precision,fastspeed analysis,automated dilution,andreliablequality monitoring,allwithun- complicatedhandlingwiththeaidofAutosampler.Thegroundwatersamplestobeanalysedfor cationsconcentrations (Ca2+, Mg2+,Na+,K+, Mn2+, andFe)usingAASin thelaboratorywere placedonAutosamplerintheirstandardsolutionsforms.Theatomisationprocess,thenebuliser deliverstheliquid sampleata controlled rate,createsa fineaerosolthat mixeswithfueland oxidantfora starter intotheflame.The nebuliseruses thecombustionflames toatomiseand introducethesampleintothelightpath.ThephotomultipliertubeofAASasthedetectordeter- minestheintensityofphotonsoftheanalyticallineexitingthemonochromator.Thedecreasein intensityofthelightistheprocessofatomicabsorption,andAASmeasuresthechangeininten- sity.Acomputerdatasystemconvertsthischangeinintensityoflight intoanabsorbence.The Softwarepackage (ASPECTLS)offersboth routineoperationandseveraldevelopmentsandop- timisationfacilities.Itallowscomprehensivecontrol,monitoring,andrecordingofall processes runinthespectrometeranditsaccessories.
TheanalysisofanionsinthelaboratorywasconductedbyPalintestinstrument(Photometer 7100,UK),which uses the colourimetric method.The photometer isfully integratedwith the wholerangeofPalintestwatertestsanduseslighttomeasurecolourchangesinwatersamples
M.C.Fenta,Z.L.AntenehandJ.Szanyietal. / DatainBrief31(2020)1058779 Table 7
The calculated values of SAR, Na%, and RSC of groundwater samples from boreholes, shallow hand-dug wells, and springs.
Boreholes ID SAR Na% RSC Shallow hand-dug wells ID SAR Na% RSC Springs ID SAR Na% RSC
BH1 0.636 20.35 0.608 SW1 0.144 7.563 -0.010 SP1 0.123 7.329 -0.270
BH2 1.902 50.93 0.687 SW2 0.183 9.310 -0.199 SP2 0.180 16.642 -0.073
BH3 0.597 20.98 0.913 SW3 0.152 12.764 -0.221 SP3 0.040 2.248 0.014
BH4 1.028 32.49 1.039 SW4 0.398 18.538 0.233 SP4 0.005 0.335 -0.080
BH5 2.467 67.57 0.915 SW5 0.178 9.227 -0.193 Min 0.005 0.335 -0.27
BH6 1.939 56.67 0.875 SW6 0.125 6.604 -0.229 Max 0.180 16.642 0.014
BH7 3.277 76.26 1.180 SW7 0.005 0.425 -0.012 Mean 0.087 6.639 -0.102
Min 0.60 20.35 0.61 SW8 0.146 8.416 0.451 SD 0.079 7.29 0.120
Max 3.28 76.26 1.18 SW9 0.270 14.943 -0.113
Mean 1.69 46.47 0.89 SW10 0.111 7.454 -0.071
SD 1.00 22.30 0.20 SW11 0.004 0.269 0.148
SW12 0.004 0.276 0.280
SW13 0.006 0.356 0.221
SW14 0.009 0.446 0.441
Min 0.004 0.27 -0.229
Max 0.398 18.54 0.451
Mean 0.124 6.90 0.052
SD 0.116 5.97 0.242
10 M.C. Fenta, Z.L. Anteneh and J. Szanyi et al. / Data in Brief 31 (2020) 105877
Fig. 1. Groundwater sampling points of Dangila Town and its surrounding area, Northwest Ethiopia.
treatedwith a reagent. The colourimeter is used to photoelectrically measure the amount of colouredlight absorbedbyacoloured sampleinreferenceto acolourless sample( astandard deionisedsample).TheconcentrationsofCl-,SO42-,HCO3-,CO32-,NO3-,F-andBweremeasured usingthecolourimetric method,andalternatively,theconcentrationsofHCO3- andCO32-were determined by titration with HCl. The laboratory analyses to determine the concentration of cations and anions of groundwater samples were conducted based on APHA (2005) standard methods[7].Thevaluesofcationandanionconcentrationsthat canimpacthumanhealthare belowthemaximumallowablelimitsofWHO2011drinkingwaterqualitystandards[2].
Thegroundwater ofthearea hasfivemain typesofwaterfacies (Table 5) asCa-HCO3 and Ca-Mg-HCO3 in shallow aquifers, andNa-Ca-HCO3, Ca-Na-HCO3 and Na-HCO3 water facies in thedeepaquifersystem.ThePiperdiagramplotandthedetailsofdifferentwaterfacesarede- scribedbyFentaetal.[1],.TherearealsoCa-HCO3–ClandCa-Mg-HCO3–Cltypesofwaterfacies inshallowhand-dugwellsandCa-Na-Mg-HCO3typewaterfaciesinboreholes.Thepresenceof a significant amountof chloride ina few shallowhand-dug wellsis relatedto anthropogenic pollution, whereas the increasing tendency inthe concentration of Ca2+, Mg2+, and Na+ with depthlead to Ca-Na-Mg-HCO3 type of waterfacies.The existence of thesetypes ofwater fa- ciesmightbe duetothe intermixingofshallowanddeepgroundwater systems.The workby Fentaetal.[1]statedrock-waterinteractionsinvolvingsilicateweathering,cationexchange,and carbonationare themainhydrochemicalprocessesthatcontrol theprimary compositionofthe groundwaterchemistry.
The threecommonly used factors inassessing the suitability of groundwater forirrigation useareSAR, Na%,andRSC.SAR isthemeasure ofpossiblesodiumhazard forirrigationwater byUnitedStatesSalinityLaboratoryStaff (1954)[5],andNa%isavitalparameterthathelpsto categorisewatersuitabilityforirrigationpurposes[8].TheexcessamountofSAR,Na%,andRSC willaffectwaterandair movementin soilsandlateraffect plantgrowth.Thethree valuesof eachwatersamplearecalculatedusingtheformulaslistedinTable6,andthecalculatedvalues arepresentedinTable7.
M.C. Fenta, Z.L. Anteneh and J. Szanyi et al. / Data in Brief 31 (2020) 105877 11
Basedonthecalculatedvalues,allwatersampleshavelowSARvalues( <10),whichcate- gorisesallsamplesasexcellentforirrigational use.ThecalculatedNa%valuesofshallowhand- dugwellsandspringsamplesare< 20that classifiestheshallowgroundwaterasexcellent for irrigational purposes.The calculatedNa% valuesofboreholesvaryfrom20to40(3boreholes), 40–60( 2boreholes ),and60–80 (2boreholes), which classifiesthedifferent deepaquifers as good, permissible and doubtful respectively for irrigational use. The RSC values of all water schemesare<1.25,whichmakesitsuitableforagriculturaluse.Theotherrelatedgroundwater physicalparameter,theelectricalconductivity,has<750μs/cmvalue,whichislowtomedium categorybasedonUSregionallaboratorystaff test[5].
DeclarationofCompetingInterest
Theauthorsdeclarethattheyhavenoknowncompetingfinancialinterestsorpersonalrela- tionshipswhichhaveorcouldbeperceivedtohave,influencedtheworkreportedinthisarticle.
Acknowledgments
Theauthorsare thankfultoAmhara DesignandSupervisionWorksEnterprise(ADSWE)hy- drochemistry laboratory staff for their cooperation and offering laboratory facilities. The first authorwould liketo thankthe governmentofHungary, andBahid darUniversity of Ethiopia, fortheireducationalandfieldlogisticssupports,respectively.
Supplementarymaterials
Supplementary material associatedwiththisarticle canbe found, inthe onlineversion, at doi:10.1016/j.dib.2020.105877.
References
[1] M.C. Fenta, Z.L. Anteneh, J. Szanyi, D. Walker, Hydrogeological framework of the volcanic aquifers and groundwater quality in Dangila Town and the surrounding area, Northwest Ethiopia, Groundw. Sustain. Dev. (2020) 1–21, doi: 10.
1016/j.gsd.2020.100408 .
[2] WHOGuidelines For Drinking-water Quality., 2011 Geneva, Switzerland .
[3] PerkinElmer, Atomic Spectroscopy: A Guide to Selecting the Appropriate Technique and System, 2018, pp. 1–16.
Waltham, USA .
[4] D.L. Suarez, J.D. Wood, S.M. Lesch, Effect of SAR on water infiltration under a sequential rain – irrigation management system, Agric. water Manag. 86 (2006) 150–164, doi: 10.1016/j.agwat.2006.07.010 .
[5] United States Salinity Laboratory StaffDiagnosis and Improvement of Saline and Alkali Soils , Agriculture, United States Department of Agriculture, Washington, D.C, 1954 .
[6] D. Walker, N. Forsythe, G. Parkin, J. Gowing, Filling the observational void : scientific value and quantitative validation of hydrometeorological data from a community-based monitoring programme, J. Hydrol. 538 (2016) 713–725, doi: 10.
1016/j.jhydrol.2016.04.062 .
[7] APHA , AWWA , and WEFStandard Methods for the Examination of Water and Wastewater, 21st ed., 2005 Washington, D.C. USA .
[8] L.V. Wilcox , The Quality of Water for Irrigation Use, US Department of Agriculture, Technical Bulletin No. 962, Wash- ington, D.C, 1948 .