Capturing Expert’s Knowledge to Guide Data Flow and Structure Analysis of Large
Corporate Databases
Gergő Balogh
†, Tamás Gergely
†, Árpád Beszédes
†, Attila Szarka
‡, Zoltán Fábián
‡† University of Szeged, Department of Software Engineering 6720 Szeged, Dugonics tér 13. Hungary
E-mail: {geryxyz,gertom,beszedes}@inf.u-szeged.hu
‡ Clarity Consulting Kft.
1145 Budapest, Erzsébet Királyné útja 29/b E-mail: {Szarka.Attila,Fabian.Zoltan}@clarity.hu
Abstract: Maintaining and improving existing large-scale systems that are based on relational databases is proven to be a challenging task. Among many other aspects, it is crucial to develop actionable methods for estimating costs and durations in the process of assessing new feature requirements. This is a very frequent activity during the evolution of large database systems and data warehouses. This goal requires the analysis of program code, data structures and business level objectives at the same time, which is a daunting task if made manually by experts. Our industrial partner started to develop a static database analysis software package that would automate and ease this process in order to make more accurate estimations. The goal of this work was to create a quality assessment model that can effectively help developers to assess the data flow (lineage) quality and the database structure quality of data warehouse (DWH) and online transaction processing (OLTP) database systems. Based on related literature, we created different models for these two interconnected topics, which were then evaluated by independent developers. The evaluation showed that the models are suitable for implementation, which are now included in a commercial product developed by our industrial partner, Clarity.
Keywords: Database systems, data warehouses, cost estimation, software quality models, data flow, database structure, data lineage.
1 Introduction and Motivation
Maintaining and improving existing large-scale systems that are based on relational databases is proven to be a challenging task. For example, from an IT operation manager’s point of view, it is crucial to develop professional methods to estimate
costs and durations when a new feature requirement needs to be assessed. These estimations are usually performed by senior experts (e.g. senior database developers), who walk through main system components, data structures and program code to review everything that needs to be modified. These experts need to understand not only the nature of the change itself, but all of the affected systems as well. Understanding a large system such as an all-round corporate Data Warehouse (or DWH) system is never easy but estimating the impact of a medium sized change on the system’s operation is even harder. Any method that can help experts to better understand what actually happens behind the lines of program code is a large step towards a more accurate and faster (thus cheaper) estimation of the above mentioned consequences of modifications [8] [18] [22].
Our goal is to help the experts of our industrial partner, Clarity Consulting Ltd.
during the analysis of large industrial database systems (OLTP databases or DWHs). As dynamic or online analysis of these is rarely feasible due to compliance or IT security reasons, we established a static analysis methodology that provides an objective toolkit for data lineage (data flow) analysis for DWH systems and database structure quality assessment for OLTP systems. To assemble this framework, we made a manual assessment of the existing workflows Clarity uses to perform such analysis, and set up a measurement model that captures the experts’
knowledge. We also sought practical ways to reduce the time needed to understand data flows and database structures in these large software systems.
Clarity Consulting Ltd. is a privately founded Hungarian consulting company, established in 2001, specialized in management and IT-related consultancy services, as well as the implementation of IT solutions for large companies. The company covers the full range of solution delivery to solve business problems (consulting, design, implementation, testing, deployment). The company also develops front-ends (e.g. CRMs, transaction systems, special applications), and database-driven systems (like campaign management databases, data warehouses).
They also have products for data cleaning, migration, and DWH-supportive systems. Their clients are typically multinational companies and government- related agencies, e.g. MNB (the central bank of Hungary), Aegon (insurance company), MAK (Hungarian State Treasury). There are several huge systems managed or developed by Clarity. For example, one of their large-bank systems serving a local bank’s customers presents 40 man years of development in a 9 years long life-cycle, currently used by 2000 active users and serving 8 business areas;
another large DWH also developed by Clarity for 10 years incorporates tens of thousands of tables and more than a million columns.
In this paper, we present the work we performed in order to assemble a methodology and quality model that can, through semi-automatic analysis, help cost estimations of Clarity’s staff (including developers, project managers, quality maintenance staff). In particular, we present our experiences how we managed to capture and encode the expert’s knowledge in the resulting quality model, and thus hopefully help other organizations facing similar challenges.
The rest of the paper is organized as follows. We elaborate on the related works in Section 2. In Section 3, we describe the whole process we followed during this research, then in Section 4 we introduce the steps related to the model construction in detail. We show how the results were validated in Section 5 and describe the resulting quality models in Section 6. In Section 7 the threats to validity are elaborated and we sum up in Section 8.
2 Related work
There are several studies that deal with the assessment of database quality.
Chaudhuri et al. [1] provided a method to identify faulty program parts and bad programming practices. They used dynamic database logs to detect bad practices about the data flow of the system that prevent client and server-side query optimization. This method attempts to identify several database related problems (e.g. setting the number of queues returned by queries, which reduces data traffic;
identifying dynamic data within the queries and marking parameters that allow the server to perform more accurate optimizations; formulating suggestions and detecting potential indices based on successive queries). In an other work the authors described how tools can support these kind of analyses [2]. Chen also combined static and dynamic techniques to help developers to improve the performance of the database-intensive systems by 3-88% [3]
Wassermann et al. [20] used static analysis techniques to detect type-related problems in dynamically generated queries. Their method is based on context-free language analysis and is able to detect the problems like type conflicts, incorrect variable types, or context-specific deviations. Haraty et al. [8] presented a method to prepare Control and Data Flow Graphs for database systems. They used column level entities and defined different connection types to represent data query and data manipulation instructions. Dasgupta et al. [4] examined embedded SQL queries, and combined the data flow in SQLs and non-SQL parts of the system. This way they could perform a more precise analysis of data flows.
Genero et al. [7] concentrated on the structure of the database and defined metrics derived from its static schema to describe its quality. Wedemeijer [21] and Papastefanatos et al. [11] [12] used schema-based metrics to describe the amount of changes made to the database schema. Wedemeijer used metrics designed for the different types of the database schema, while Papastefanatos et al. used graph based metrics. In our work, we derive separate but interconnected metrics from the data flow information and from the database structure.
Another way to assess the quality of a database system is to define different rules and check whether these rules are observed; or count how many times they are violated. Delplanque et al. [6] implemented a tool called DBCritics that analyzed DDL instructions and checked them against some rules. Their work focused on the
schema evolution problem, but many of their rules can be used on the schema itself to check the actual quality of the schema. Rodic et al. [17] dealt with the data quality processes of data warehouses and provided a method to implement data quality rules. Their rules can be used to mark or correct the defective records in the selected tables. The data quality process is integrated into the ETL process enabling automatic, quick and correct operation. Using their research results, a rule generator used in the industrial (banking) sector was prepared. They used several rules that checked whether components that ensure data integrity are present in the database schema. Nagy and Cleve also used rules to detect bad smells in (embedded) SQL queries, based on code, database schema and data analysis [10].
The most complete list of database quality rules we found are collected on the red- gate community pages1. The lists included several Microsoft SQL Server specific rules, but most of them were either general or could be used as a template for general or Oracle specific rules. We defined rules only for the database structure (i.e. for DDL instructions), and not for the data manipulation instructions2.
In our research, we only found loose definitions of high-level database metrics.
Although high-level definitions of the so called QoX (Quality of X) metrics [5] [13]
are also known, and some of these metrics are used in other areas of software development, we are not aware of low-level (implementation-close) definitions, which would be generally accepted. In the studies, researchers generally interpret and clarify these definitions themselves, but we did not find an official or de facto standard.
Dayal et al. [5] defined several high-level quality metrics for database systems based on the regular high-level software metrics. These metrics capture the quality of the software from different human-understandable points of view. Simitsis et al. [19] and Pavlov [13] have examined these metrics and their relations to the classic software metrics. Herden [9] also published a methodology including several high-level quality criteria to assess the quality of the database system.
Piattini et al. [14] [15] [16] conducted several studies where they measured low- level attributes of the schema to express high-level quality attributes of the database.
In our methodology introduced below, we partially relied on the high-level metrics introduced by Simitsis et al.
1 https://www.red-gate.com/hub/
2 This was required by our industrial partner, as while there are several static analysis tools available for Oracle PL/SQL code, no suitable tool was found for database structures (DDLs). Data flow analysis is a different topic from this point of view because information could be extracted from DMLs to construct data lineage graphs.
3 Description of the Manual Assessment Process
Clarity Consulting relies on a manual method (supported by some automated analysis and measurement tools) to assess the resources and time required to perform modifications on a database system or a DWH. In practice, simple call graphs are created and affected database objects are identified. Simple metrics are also computed by supporting tools to enable estimation of modification cost and duration. This process consumes a lot of resources (expert and computation time), because a manual walkthrough of the code and database structures are required. The current method is adequate but due to the high ratio of manual analysis, it is expensive and slow. During the process, only those parts of the system are examined that are considered important (making the analysis more subjective than an automatic analysis). The actual assessment consists of the following steps:
1. Read and understand the change request (e.g. rewriting the structure, optimizing a component for performance, or inserting a new one)
2. Identify the relevant system objects (programs, modules, interfaces) 3. Examine the affected table structure
4. Manually analyse the affected program code
5. Estimate the amount of resources required for the development (estimate the size and complexity of the code need to be constructed)
6. Estimate the resources required for testing, documentation and go-live 7. Cross-validate and confront different estimations
In this process, the examination of the table structure is supported by tools at low- level. In step 3, graphs that describe the structure of the database and the database- related data flow are constructed to help the experts in understanding how the workflows operate. Then, the experts examine the program code, ETL processes, their complexity, etc. and make estimations on the development.
Our goal was to support these steps by automated software tools. According to our analysis, several low-level attributes of the database structure and of the data flow could be automatically detected based on the graphs and the source code itself.
These low-level values could then be used directly in the experts’ estimations, but it is also possible to further help the experts by computing high-level metrics. The estimations would still be made by the experts, but the high-level metrics have a more direct connection to the experts’ estimations than the low-level metrics. In other words, part of the experts’ estimation knowledge could be captured by the model that states how to compute the high-level metrics from the low-level ones.
4 Capturing Expert’s Knowledge
As elaborated earlier, our main goal was to help the experts with a (semi-)automatic system. The developers will use this system to accomplish repetitive audit tasks and it will allow users to retrieve objective data on the quality through reproducible measurements. To achieve this, the underlying models should contain the aggregated knowledge of the experts. Our industrial partner, Clarity included our findings in features of its database analysis software package. This software has two modules: DALIA (Database Lineage and Impact Analyzer) and DEXTER (Database Structure Analyzer).
DALIA is a database lineage tool capable of parsing Oracle PL/SQL code while identifying data connections implemented in DML statements. The data flow graph is constructed using static analysis, i.e. the extraction process does not require access to the working database instance (and its actual data); it works offline on uploaded structure and PL/SQL code extracts. DALIA can display a data flow graph thus enabling the evaluation of data dependencies at the database schema, table or column level (or a mix of these). The edges and vertices of this graph are labelled with calculated values of high-level concepts like maintainability or complexity. It also supports impact analysis by estimating the efforts and costs of planned modifications. The edges and vertices of this graph will be labelled with estimated values of high-level concepts.
DEXTER is a database structure analysis tool that is able to measure the quality of database models or structures. Its operation is similar to static source code analysis tools, but it does not work on programming languages, rather on the implemented database structure itself. It evaluates most of the database objects (tables, indexes, triggers, etc.) against simple or complex rules to gain an understanding of the quality of the database model. It helps to understand which actions could be made to increase the performance, maintainability or scalability of the database model.
DALIA and DEXTER use the above-mentioned models to compute certain metrics and rules to help our goal of supporting the comprehension and development of database-intensive systems.
We performed a multi-phase expert’s knowledge capturing process to construct these models. Figure 1 shows an overview of the whole process. It started with the evaluation of the related literature to retrieve suggestions and best practices. Based on the findings, we conducted a series of informal interviews to collect general information and opinion from the developers. Then, based on the literature and the experts’ knowledge, we defined the metrics and rules that would help the experts’
work of assessing the data lineage and structural quality of a system.
As the analysis and the models should be implementable in DALIA and DEXTER, the project management of Clarity were also involved in the rule and metrics definition phase. We defined low-level (directly measurable) and high-level (conceptual) metrics. Low level metrics represent some objective, quantitative
attributes of the system that can be measured directly from the database model and/or the source code (including number of rule violations of each rule). There were several rules that required some parameters; we asked the experts to set them based on their experience. High level metrics cover some quality-related conceptual properties and their values are computed from other (usually low-level) metrics.
These computational processes (which, in our case, are weighted linear aggregations) are called the quality model. We performed a survey to collect the experts’ knowledge regarding these models (i.e. to provide weights to the models).
Figure 1
Overview of Expert’s Knowledge Capturing Process
The following sections provide details about each step of our knowledge capturing process.
4.1 Related Work’s Evaluation
During this phase we evaluated 173 articles published by more than 400 different authors published at 41 distinct forums (conferences or journals). We grouped these papers into 89 topics according to their major contribution. These topics included:
conceptual model, data flow, data uncertainty, database as a service, database complexity, database generation, database migration, database summarization, database testing, ER model extraction, keyword search, metrics, object oriented database, online tuning, parallel join, performance evaluation, persistence, query comprehension, query optimization, query prediction, query validation, reverse
engineering, schema analysis, schema expansion, schema filtering, schema summarization, standard, summarization, UML, workload estimation.
In this phase we sought answers to the following questions:
Which methods and techniques are used to analyze the database structure and its data flow connections?
Are there any widely accepted techniques, metrics, or rule sets for analyzing databases?
The first question was addressed in Section 2 of this article by listing the relevant related works. During the evaluation of these papers we could not find any widely accepted, general methods or techniques for database analysis. There are several key concepts and methods commonly used in various works, like data flow analysis and the use of the so-called QoX (Quality of X) metrics, but we could not find any (de facto) standards for this topic. These common methods are usually context sensitive and constructed to solve a specific problem, or they lack any strict definition. To conclude this phase, related work provided a good general basis for the research, but there were several details that had to be worked out in order to meet the industrial needs of Clarity.
4.2 Informal Interviews with developers
To collect preliminary information about the experience of the developers, we performed informal interviews at the office of Clarity, with all participants present at the same time. Altogether 15 experts were involved: 5 juniors with less than 4 years of experience, 5 seniors with 4-10 years of experience, and 5 experts with more than 10 years of experience. We have also assigned different roles to the participants: there were 5 back-end, 2 front-end, and 3 lead developers, 2 testers, and 3 project managers.
The goal of these guided discussions was to collect the expert’s professional viewpoints in various topics related to the evolution challenges of database constructs and technologies. Based on these data we were able to define the following topics Clarity was interested in:
Generated PL/SQL statements
EXECUTE IMMEDIATE statements and related code chunks
Various graph topology descriptors, like count of cycles
Error handling and dblink-connected database items
Data flow connections of different database items
Various weights based on the complexity of the implementation
Property distribution among layers of the database
4.3 Metric Categorization and Rule Sets
The next steps of the knowledge capturing process were the definition of the metrics and rules. Rules were defined to check suspicious locations and constructs in the structure of the database. These rules can directly help developers to improve the quality of such systems, but cannot be directly used in the quality model. We have derived metrics from these rules by counting how many times were they violated, and these rule violation metrics were then used in the quality model. Data connection metrics were defined to quantitatively capture different properties of data, flowing in the system from column to column. Note, that we have not defined metrics or rules that used both database structure and data flow information; this was a technical decision made by Clarity to enable the standalone operation of the two modules, DALIA and DEXTER.
In the following, we briefly describe the different metric and rule categories.
4.3.1 Data Structure Rules
There can be several constructs in a database and its structure that can cause the loss of some quality attributes, e.g. lack of indexes can hinder performance or very similar names can hinder understandability. These constructs or properties can be detected by analyzing the database structure whether it satisfies some predefined rules or not. We have collected a large set of general and database system specific rules that were used in the practice, selected and modified the most relevant and appropriate ones to fit the needs of Clarity (relying on the opinion of its experts).
There were some rule violations that required some parameters to be set. We’ve done this together with Clarity’s team. Developers and managers were also asked to define the importance of the different rules on a scale from 1 (least important) to 5 (most important). Finally, we defined 53 rules in five categories.
Table rules define rules about the tables and the relationships between them. This rule set includes rules like a check for isolated tables (without foreign key and referencing tables), a check for using proper column types (e.g. use DATE, not CHAR or INTEGER), a check for using too many or too few indexes (which may reduce performance). The above mentioned rules are considered to be important (level 4) by the experts; the average importance of the rules in this group is 3.2.
The key rules capture primary and foreign key related issues and, if kept, they help in maintaining data integrity. Rules like checking for the existence of primary keys, using monolithic primary keys, or checking whether a foreign key refers to a key are included. The mentioned rules have high-level of importance (at least 4), and the average importance of the group is 3.4.
The type rules provide help for safe and efficient use of data types. This group includes rules for checking deprecated types, checking whether fixed or variable length types are more appropriate at a certain place, or proposing Unicode types
where those seem to be more appropriate. Although some of these rules have the highest importance, the average importance of the group is 3.1.
The syntactic rules help to improve readability which is necessary for understanding the code during a manual analysis, and to avoid bad coding practices that would otherwise make maintenance activities more error prone. This set includes rules like checking the use of reserved words as identifiers, whether indexes have descriptive names, if there are very similar identifiers in use, or whether the same name is used for several elements (in different contexts). As following these rules can severely reduce the time required for understanding the system, many of them have high importance (with an average of 3.3).
Other rules include various rules that do not belong to any of the above categories but are still important for the quality assessment of a database. These rules suggest, for example, to use static database models (do not change the structure during operation), to avoid using the Entity-Attribute-Value model, or to restrict column values with additional tables and foreign keys instead of constraints. These rules have lower importance in general, as they can be reasonably ignored in certain systems (however, Clarity experts feel them appropriate).
4.3.2 Data Structure Metrics
Beside the rules, we defined metrics that capture some quantitative properties of the database structure. We have two groups of such metrics: one considering the different elements (like tables, views, columns, indexes, procedures, keys), and the other one considering the relations (like connected components, foreign keys). For both groups, we defined metrics to count the number of given elements or relations, and, if available, average and total number of them. For example, the number of indexes can be counted for each table but can also be summarized for the database, and an average index count per table can also be computed.
4.3.3 Data Connection Metrics
Beside the structure, data connections and data flow of the database also affects its quality. There are several metrics that quantitatively express the data flow related attributes of the system. In this work, we have defined 83 data connection metrics to be measured. Some of the metrics are local, meaning that they can be computed for smaller structures (e.g. for a stored procedure) and then be easily aggregated for larger structures (e.g. for all of the program code that exist in the database system).
Other metrics are global, meaning that they have to be computed directly for larger structures (and cannot be aggregated from the values of smaller ones).
We can also make difference between source code level and low-level metrics; we defined 23 and 60 of these, respectively. Source code level metrics are directly measurable numeric characteristics that express certain attributes of the source code. These metrics are based on the relationships between elements, size, and complexity. Low-level metrics express the number of elements, the number of
relationship between them, or the proportion of these. Each such metric has a domain, which specifies what type of items of the data flow graph the metric is computed for (column, table, schema, database). These metrics are based on
“EXECUTE IMMEDIATE commands”, generated code, complexity, graph description, usage, and grouping.
4.4 High Level Concepts
On one hand, rules and low-level metrics express some well defined properties of the database. On the other hand, high-level metrics are proposed in the literature to express some concepts like maintainability or reliability of the system. In this work, we have used 8 high-level: MAINTAINABILITY, RELIABILITY, ROBUSTNESS,
TECHNICAL COST, SCALABILITY, LOG RATE, FLEXIBILITY and INTEGRITY. These high-level QoX metrics can be used by the experts to assess the overall quality of a database system and estimate the cost and duration of a modification.
4.5 Fine Tuning Quality Models
We use low-level metrics and rule violation counts to estimate the value of high- level concepts. There are many publications that elaborate on what features can be used (and how) to calculate high-level metrics of a database. This computational process is called the quality model. However, papers rarely provide specific models, instead, they examine how the automatically computed values of low-level metrics and the manually assessed values of high-level metrics are correlated in real database systems. As the goal of the quality model is to compute high-level (abstract) concepts using low-level (measurable) metrics, each model determines a kind of aggregation of lower-level metrics to the high-level ones.
As noted earlier, in our case, source code metrics describe the PL/SQL code itself, low-level and high-level metrics are interpreted on data flow graphs and on the database model, while rule violation checking is also applied on the latter. Several source-code based metrics are used to weigh the edges of data flow graphs, hence an abstraction level shift can be observed between the code level and the low-level data flow metrics since the data flow graph could be interpreted as an abstraction over the source code. The formal definition of higher-level metrics in our model is provided by the aggregation of lower-level metrics. These principles define a three- level model in the case of the data connection (source, low-level metrics and high- level concepts) and a two-level model in the case of the database structure.
For each lower-level metric to be aggregated on a higher level, we defined three higher-level metrics: the median, average and standard deviation values of the corresponding lower-level metric values. This model makes it possible to connect any source-, low- and high-level metrics. The user is allowed to set the weights between any metric pairs to fine-tune for an exact situation or problem. These weights enabled us to capture the connection between various concepts commonly
known to database experts. To define initial values for these weights we asked the developers and experts to weigh every connection between two consecutive levels.
Results are shown on Figures 3, 4 and 5.
5 Evaluation
Our evaluation process consists of several phases (see Figure 2). All of our results were checked by Clarity’s experts to correct any misinterpretation. Finally, we asked several independent experts from another company working in a similar domain to express their opinion about our model and methodology.
Figure 2
Overview of the Evaluation Process
Clarity’s first impressions about the methodology were that it is well thought out and allows developers to easily understand the concepts. The data flow metrics and database structure rules made the implementation of client inquiries smoother.
To collect the opinion of independent experts we used an electronic survey, which contained six sections and 20 questions. The questions covered all of the relevant steps of our validation process. These steps are highlighted with green background in Figure 2. The survey took 30-50 minutes to complete by an expert. We used open-ended questions to collect personal ideas without any bias from our side. The closed-ended questions targeted rankings and often meant single-choice questions.
We collected seven responses altogether. Two of these were given by database users and five were filled by developers. Interviewed experts’ solutions for system evaluation and cost estimation varied from person to person, and although they have mentioned the usage of various (semi-)automatic analysis methods, everyone emphasized the importance of the connection with the original developers (face-to- face discussions, documentation). As turned out, the most useful techniques to solve these problems are the well-known static analysis of source code and inspection of the structure of database. The interviewed persons assigned similar scores to data connection analysis either based on data (1.29 of 0-3) or source code (1.33 of 0-3).
It suggests that although the data-based connection analysis plays an important role, the source code based heuristics are not discarded by experts. Two of the key entities in our model, namely directly measurable metrics and high-level concepts also got higher appreciation when solving the above-mentioned problems. We think that the lower scores of the intermediate or derived metrics (like ratios and other compound measures) are explained by their low interpretability.
We also asked experts about the usefulness of various information collecting techniques for different roles. They agreed that in most cases the opinion of the developers and experts could be useful, regardless of the actually used information collection method (e.g. interviews, discussions or surveys). Opinions of users have medium scores, while the value of project managers’ concept shows a more divert picture. There are some areas where they placed the importance of developers and experts higher (for example using formal interviews or surveys to capture data about previous assessment processes). In general, we could conclude that our subjects prefer informal methods and techniques over strict or formal options.
Almost all of the asked experts preferred social or personal oriented methods (like interviews and discussions) to collect and fine tune the information required for the automatic assessment model. They also mentioned various documentation and other auxiliary artifacts as main information sources. Evaluation by independent experts or already validated frameworks were also favored. These concepts coincide our previously advised and executed knowledge capturing processes.
6 Quality Models
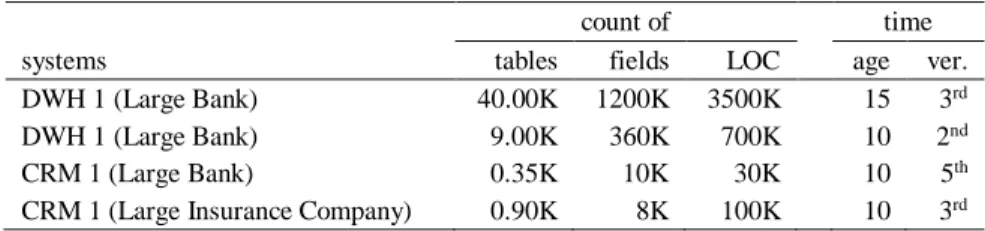
In this section, we describe our final quality models. As mentioned earlier, it was a strategic decision by Clarity to build separate models for the database structure and the data flow of database systems. Clarity plans to utilize the incorporated knowledge during its quality assessment and cost estimation processes implemented in their database analysis software package (DALIA and DEXTER). Some properties of the possible target systems (on which the analysis will be performed) are shown in Table 2.
Table 2 Target Systems
count of time
systems tables fields LOC age ver.
DWH 1 (Large Bank) 40.00K 1200K 3500K 15 3rd
DWH 1 (Large Bank) 9.00K 360K 700K 10 2nd
CRM 1 (Large Bank) 0.35K 10K 30K 10 5th
CRM 1 (Large Insurance Company) 0.90K 8K 100K 10 3rd
6.1 Measuring Database Structure
We have defined rules and metrics for the database structures. Rules provide direct feedback on potential problems but cannot be directly used in the model. However, rule violation counts can be, as described in Section 4.3.1. In our model, the values of these metrics directly affect the high-level metrics.
Our model is the following: we compute a weighted average of the low-level metrics as
𝐻(𝐼) =∑𝐿∈𝐿𝐿𝑀𝑤𝐻,𝐿𝐿(𝐼)
|𝐿𝐿𝑀|
where H(I) is the high-level, L(I) is the low-level, normalized metric value for the I item, LLM is the set of low-level metrics, and wH,L is the weight of metric L in the model of metric H. The weights were set by the experts. They were asked to fill questionnaires about how strongly the number of rule violations and the attributes captured by the metrics affect the high-level concepts (strongly, weakly, not at all) and in what direction (positively, negatively). The answers were summarized and a weight between -1 and 1 were assigned to each metric-concept pairs.
In figures 3 and 4 two examples for the answers given by the experts for metrics of items and relations are shown. As can be seen, while the larger number of entities in a database negatively affects the high-level concepts in most of the cases (red lines in Figure 3), the number of relations usually aid them (green lines in Figure 4).
Before the rule violation counts or the low-level metric values are used, normalization is done. Normalization can be different for the different metrics, but for all of them it is done in a way to eliminate the size bias of the system (which practically means a division by some size related metrics).
Figure 3
Example Database Structure Metric Model (low-level entity metrics). Red connections depict a negative, and green ones positive
influence.
Figure 4
Example Database Structure Metric Model (low-level relation metrics). Red connections
depict a negative, and green ones positive influence.
6.2 Measuring Data Connection
As the result of the above elaborated process, we constructed several models that help assess the quality of databases. Because we were not able to dynamically access the stored data, we decided to rely on the data connection graph (DCG) for the analysis. There are several types of components in relational databases; our models use four of these: columns, tables, schemas and databases (instances). In the constructed DCGs these components are represented by nodes. There are connections between these if at least one code chunk exists, which reads data from the source and presumably writes it into the target component. We created one global and 8 local models. The essence of the global model is to accumulate the low-level global metrics using a simple aggregation function. The result is a numeric descriptor of the whole system.
Local metrics can be divided into two groups according to their domains: metrics for the edges or nodes. They can be further divided by levels: columns, tables, schemas, and databases (instances). This grouping enables the construction of 8 independent local models to be built. These probabilistic models are based on the deviation of the values at the given level, and the aggregate values of these deviations are propagated towards the higher-level metrics.
As an example, the metric model for connection between tables is shown in Figure 5. The basic element of the models is a directed, non-circular graph (DAG) that describes the dependencies between each low-level metric and high-level characteristic. This graph forms the base of upward aggregation, where values of low-level metrics are determined first from the directly computable values, and then propagated along the edges up to the higher levels.
7 Threats to Validity
Although our methods and resulted models were accepted and approved by our industrial partner, there are some threats to validity of this work.
7.1 External Validity
Because of our goal was to provide a context specific system (and methodology to construct it), we do not have any data about the degree of generalization. The current phase of development and integration with the above-mentioned DALIA and DEXTER software systems made it difficult to produce any measurement on real life systems using the new model. Clarity plans to conduct such kind of empirical evaluation after the launch of the first version of the software tools based on our model.
Figure 5
Metric Model for Connection between Tables.
We used the previously mentioned survey to assess the validity of our methodology and our findings. We constructed the survey to minimize unintentional bias of opinions, but we could not eliminate this factor completely. The retrieved number of answers are quite low, which increases the chance of drawing insignificant or over-fitted conclusions. Note, that due to the ongoing development connected to this project and some other privacy considerations the number of potential subject audience were limited.
There were several open-ended questions in the survey. While our opinion is that these types of questions are useful to collect personal impressions and opinions, it could also lead to misinterpretation or subjective evaluation.
7.2 Internal Validity
Building a model where directly measurable metrics are used to estimate high-level, abstract concepts are prone to errors. These errors may emerge because the selected metrics could be unable to capture relevant information. We addressed this problem by carefully selecting and defining our metric sets based on the related works. These metrics were validated using informal interviews and guided discussions with developers and experts. We tried to minimize unintentional bias, but we could not eliminate this factor completely.
There are several parameters of the individual metrics and rules as well for the whole model. These properties are double-edged swords. They provide high-level
customizations increasing the scalability of the measurement system, but it is always possible to set these parameters to a sub-optimal value. We reduced this risk by asking the developers and experts to estimate these parameters using their experiences.
The choice of the aggregation method is another threat to validity. There are several ways to propagate the information to a higher level of abstraction. During the design of the model, there were two main factors needed to be taken into account. First, as the knowledge capturing was a direct process (i.e. we did not ``train’’ the model, but asked the experts to assess its parameters), the parameters must have had a clear interpretation. The second constraint was the implementability and expected performance of the algorithms. This lead to our final decision to use the probability and distribution-based methods in compound multi-level parts of the model, and a weighted average-based method in the case of simpler parts.
8 Conclusions
In this work, our goal was to create a methodology that helps Clarity in the cost estimation of database system development and maintenance. We initially collected related works and existing solutions, and assessed the actual process and the needs of Clarity. Then, we defined different low-level metrics to be automatically measured on the database systems, together with high-level metrics and models.
These help developers and managers to assess the quality of a database system and incorporate this knowledge in cost estimation tasks. The models were parametrized and fine-tuned based on discussions and interviews with Clarity experts. The resulting models were checked by independent developers, and finally accepted by Clarity, who will build them in into their static analysis systems.
Although the methodology and the models have been evaluated by independent developers, they have not yet been actually used: the process and the models were not applied on real systems, they were merely “statically” validated. To make a more thorough evaluation, we plan to use the models for a certain period in real projects, during which we will record different aspects of them (e.g. accuracy of estimations) and then compare them to projects estimated without this support.
Nevertheless, we believe that our experience reported in this paper will help other organizations and teams working on similiar initiatives and facing similar challenges.
Clarity has already included a part of the knowldege and results of this work in two modules of its database analysis software. These modules are DALIA (Database Lineage and Impact Analyzer) which utilizes the dataflow analysis results, and DEXTER (Database Structure Analyzer), which takes advantage of the results related to the database structure.
Although the methodology and the models have been evaluated by independent developers, this did not include the use of all of them: every process and the models were not thoroughly applied on real systems, but some relevant parts were applied on large DWH and CRM systems (see Table 5 above). To make a more thorough evaluation, we plan to use the models more exhaustively in real projects, while we record different aspects of them (e.g. accuracy of estimations) and then compare them to projects estimated without this support.
For further information on Clarity Consulting please visit http://clarity.hu/en or the product page http://daliaflow.com about DALIA (Database Lineage and Impact Analyzer).
Acknowledgement
This work has been supported by GINOP-2.1.1-15 (Economic Development and Innovation Operational Programme) funded by the European Union.
References
[1] S. Chaudhuri, V. Narasayya, and M. Syamala: Bridging the application and DBMS profiling divide for database application developers. 33rd International Conference on Very Large Databases, 2007, pp 1252–1262.
[2] S. Chaudhuri, V. R. Narasayya, and M. Syamala: Database Application Developer Tools Using Static Analysis and Dynamic Profiling. IEEE Data Eng. Bull., 37(1), 2014, pp 38-47.
[3] T. H. Chen:. Improving the quality of large-scale database-centric software systems by analyzing database access code. 31st IEEE International Conference on Data Engineering Workshops, 2015, pp 245-249.
[4] A. Dasgupta, V. Narasayya, and M. Syamala: A static analysis framework for database applications. IEEE 25th International Conference on Data Engineering, 2009, pp 1403–1414.
[5] U. Dayal, M. Castellanos, A. Simitsis, and K. Wilkinson: Data integration flows for business intelligence. 12th International Conference on Extending Database Technology Advances in Database Technology, 2009.
[6] J. Delplanque, A. Etien, O. Auverlot, T. Mens, N. Anquetil, and S. Ducasse:
CodeCritics applied to database schema: Challenges and first results. 24th IEEE International Conference on Software Analysis, Evolution, and Reengineering, 2017, pp 432–436.
[7] M. Genero, G. Poels, and M. Piattini: Defining and validating metrics for assessing the understandability of entity-relationship diagrams. Data and Knowledge Engineering, 64(3), 2008, pp 534–557.
[8] R. A. Haraty, N. Mansour, and B. A. Daou: Regression test selection for database applications. Advanced Topics in Database Research, vol. 3, 2004, pp 141–165.
[9] O. Herden: Measuring quality of database schemas by reviewing–concept, criteria and tool. Oldenburg Research and Development Institute for Computer Science Tools and Systems, Escherweg, 2:26121, 2001.
[10] Cs. Nagy and A. Cleve: A Static Code Smell Detector for SQL Queries Embedded in Java Code. IEEE 17th International Working Conference on Source Code Analysis and Manipulation, Shanghai, 2017, pp 147-152.
[11] G. Papastefanatos, P. Vassiliadis, A. Simitsis, and Y. Vassiliou: Design Metrics for Data Warehouse Evolution. 27th International Conference on Conceptual Modeling, 2008, pp 440–454.
[12] G. Papastefanatos, P. Vassiliadis, A. Simitsis, and Y. Vassiliou: Metrics for the Prediction of Evolution Impact in ETL Ecosystems: A Case Study.
Journal on Data Semantics, 2(1), 2012, pp 75–97.
[13] I. Pavlov: A QoX model for ETL subsystems: Theoretical and industry perspectives. In ACM International Conference Proceeding Series, Vol. 767, 2013, pp 15–21.
[14] M. Piattini, C. Calero, and M. Genero: Table oriented metrics for relational databases. Software Quality Journal , 9(2), 2001, pp 79–97.
[15] M. Piattini, C. Calero, H. A. Sahraoui, and H. Lounis: Object-relational database metrics. L’Objet, 7(4), 2001, pp 477–496.
[16] M. Piattini, M. Genero, and L. Jiménez: A metric-based approach for predicting conceptual data models maintainability. International Journal of Software Engineering and Knowledge Engineering, 11(6), 2001, pp 703–
729.
[17] J. Rodic and M. Baranovic: Generating data quality rules and integration into ETL process. ACM Twelfth International Workshop on Data Warehousing and OLAP, 2009, pp 65–72.
[18] R. Saint-Paul, G. Raschia, and N. Mouaddib: General purpose database summarization. 31st International Conference on Very Large Databases, 2005, pp 733–744.
[19] A. Simitsis, K. Wilkinson, M. Castellanos, and U. Dayal: QoX-driven ETL design: Reducing the cost of ETL consulting engagements. 35th SIGMOD international conference on Management of data, 2009, pp 953–960.
[20] G. Wassermann, C. Gould, Z. Su, and P. Devanbu: Static checking of dynamically generated queries in database applications, ACM Trans. Softw.
Eng. Methodol. 16(4), 2007, pp 14.
[21] L. Wedemeijer: Defining metrics for conceptual schema evolution, Lecture Notes in Computer Science, vol. 2065, 2001, pp 220–244.
[22] X. Yang, C. Procopiuc, and D. Srivastava: Summary graphs for relational database schemas, Very Large Data Bases 4(11), 2011, pp 899–910.